| Param | Original file | Final file |
|---|---|---|
| Filename | modeM0/AS1C05_002T08_9000003556_23984cztM0_level2.evt | modeM0/AS1C05_002T08_9000003556_23984cztM0_level2_quad_clean.evt |
| Size (bytes) | 524,583,360 | 60,949,440 |
| Size | 500.3 MB | 58.1 MB |
| Events in quadrant A | 2,505,704 | 410,578 |
| Events in quadrant B | 2,688,772 | 412,112 |
| Events in quadrant C | 2,541,661 | 391,810 |
| Events in quadrant D | 7,829,994 | 298,164 |
| Mode M0 | |||
|---|---|---|---|
| Quadrant | BADHDUFLAG | Total packets | Discarded packets |
| A | 0 | 10359 | 0 |
| B | 0 | 10857 | 0 |
| C | 0 | 10316 | 0 |
| D | 0 | 26572 | 0 |
| Mode SS | |||
|---|---|---|---|
| Quadrant | BADHDUFLAG | Total packets | Discarded packets |
| A | 0 | 94 | 0 |
| B | 0 | 94 | 0 |
| C | 0 | 94 | 0 |
| D | 0 | 94 | 0 |
| Quadrant | Total seconds | Saturated seconds | Saturation percentage |
|---|---|---|---|
| A | 4730 | 14 | 0.295983% |
| B | 4731 | 58 | 1.225956% |
| C | 4731 | 34 | 0.718664% |
| D | 4731 | 2170 | 45.867681% |
Noise dominated data is calculated using 1-second bins in cleaned event files. If a bin has >2000 counts, and if more than 50% of those come from <1% of pixels, then it is considered to be noise-dominated and hence unusable.
| Quadrant | # 1 sec bins | Bins with >0 counts | Bins with >2000 counts | High rate bins dominated by noise | Noise dominated (total time) | Noise dominated (detector-on time) | Marked lightcurve |
|---|---|---|---|---|---|---|---|
| A | 4730 | 4730 | 0 | 0 | 0.00% | 0.00% | 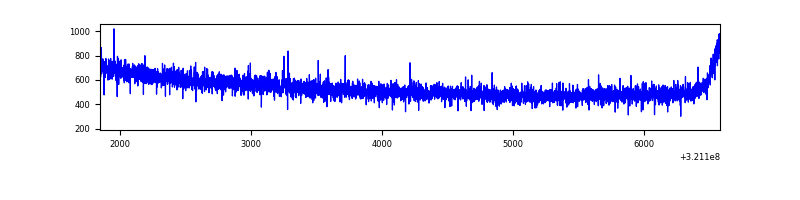 |
| B | 4731 | 4731 | 14 | 14 | 0.30% | 0.30% | 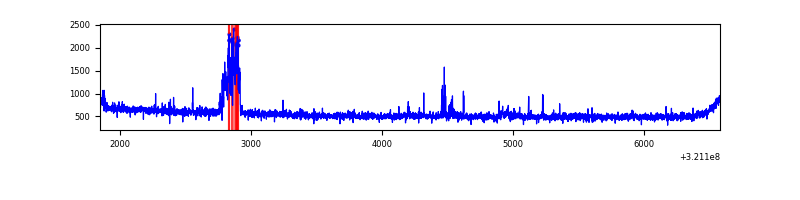 |
| C | 4731 | 4731 | 1 | 1 | 0.02% | 0.02% | 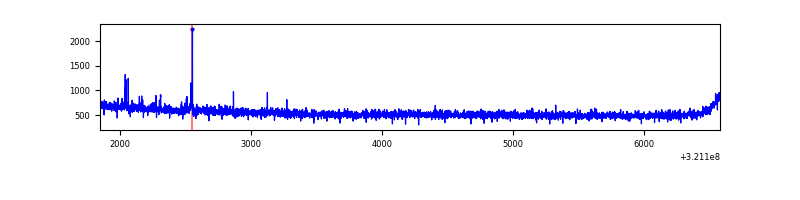 |
| D | 4731 | 4731 | 1596 | 1596 | 33.73% | 33.73% | 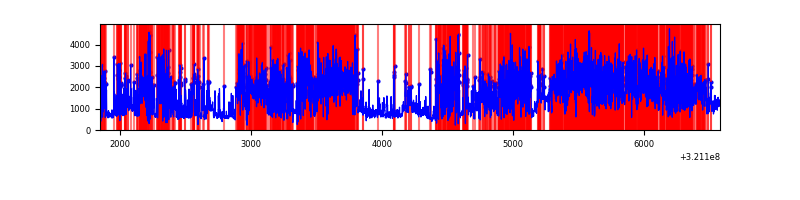 |
Top three noisy pixels from each quadrant. If the there are fewer than three noisy pixels in the level2.evt file, extra rows are filled as -1
| Pixel properties | Quadrant properties | ||||||
|---|---|---|---|---|---|---|---|
| Quadrant | DetID | PixID | Counts | Sigma | Mean | Median | Sigma |
| A | 13 | 254 | 7506 | 52.99 | 650 | 640 | 129.6 |
| A | 0 | 226 | 5571 | 38.06 | 650 | 640 | 129.6 |
| A | 3 | 137 | 5372 | 36.52 | 650 | 640 | 129.6 |
| B | 0 | 197 | 147021 | 1217.66 | 642 | 630 | 120.2 |
| B | 0 | 230 | 17658 | 141.64 | 642 | 630 | 120.2 |
| B | 12 | 111 | 14031 | 111.47 | 642 | 630 | 120.2 |
| C | 14 | 238 | 100895 | 700.8 | 619 | 624 | 143.1 |
| C | 0 | 10 | 26375 | 179.98 | 619 | 624 | 143.1 |
| C | 13 | 61 | 4345 | 26.01 | 619 | 624 | 143.1 |
| D | 12 | 218 | 4909226 | 38418.13 | 516 | 500 | 127.8 |
| D | 1 | 52 | 249893 | 1951.87 | 516 | 500 | 127.8 |
| D | 12 | 250 | 217673 | 1699.7 | 516 | 500 | 127.8 |
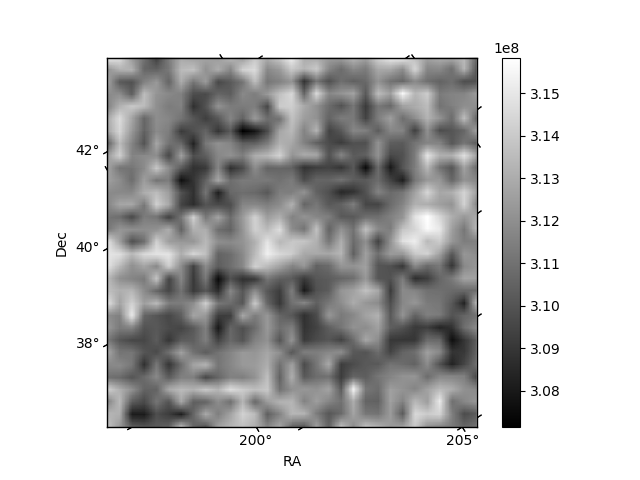
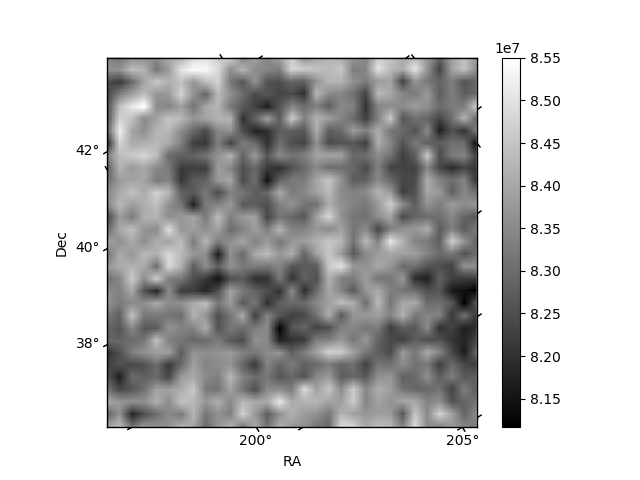
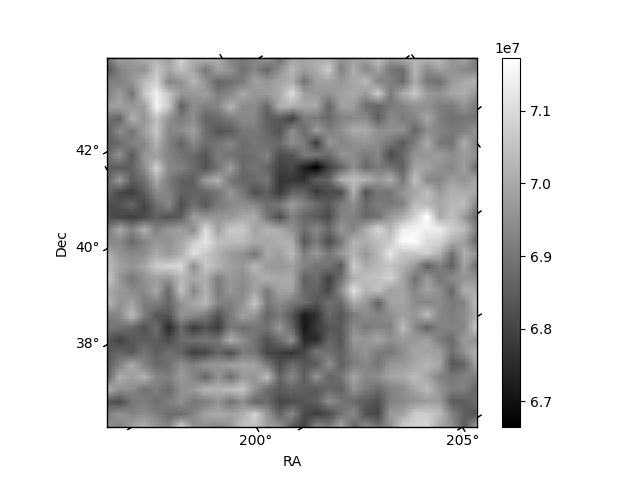
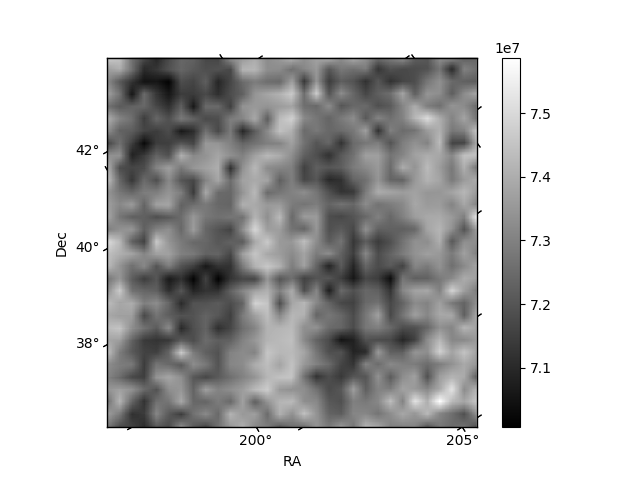
Histogram calculated using DETX and DETY for each event in the final _common_clean file
| Quadrant A | 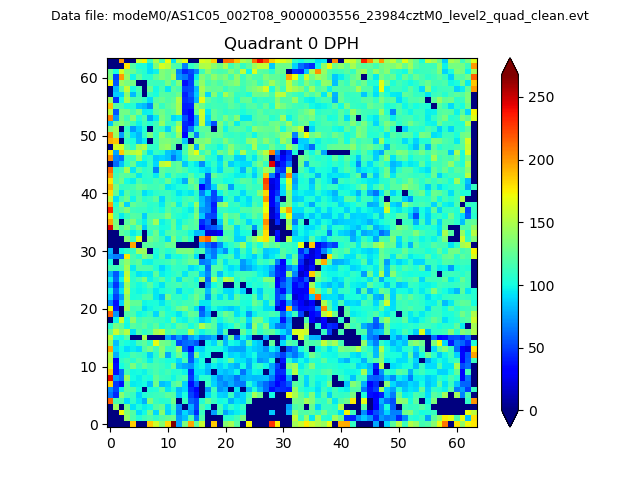 |
 |
Quadrant B |
|---|---|---|---|
| Quadrant D | 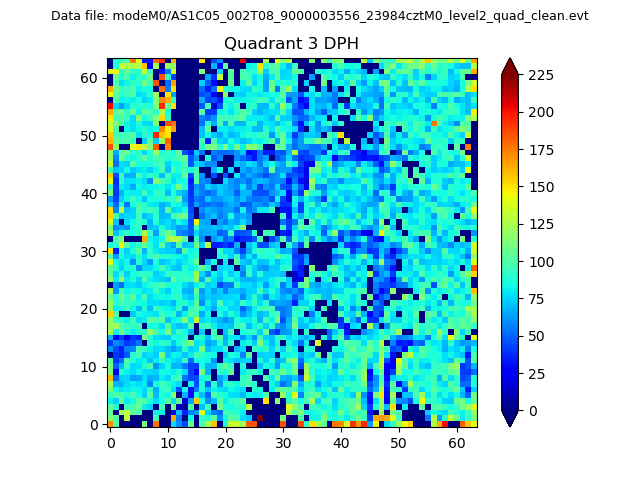 |
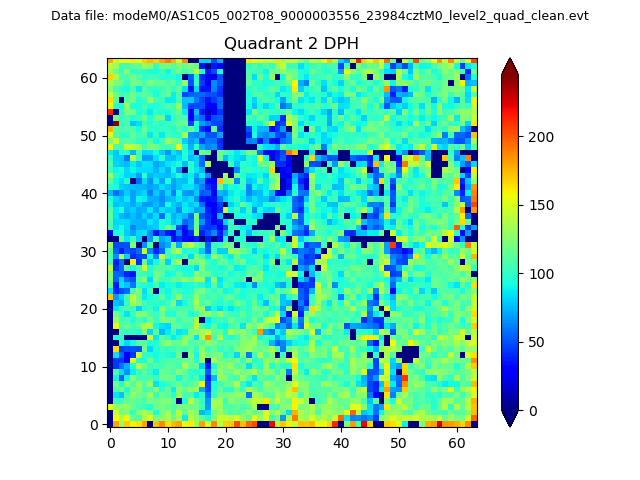 |
Quadrant C |
| Plot type | Count rate plots | Images |
|---|---|---|
| Comparison with Poisson distribution Blue bars denote a histogram of data divided into 1 sec bins. Red curve is a Poisson curve with rate = median count rate of data. |
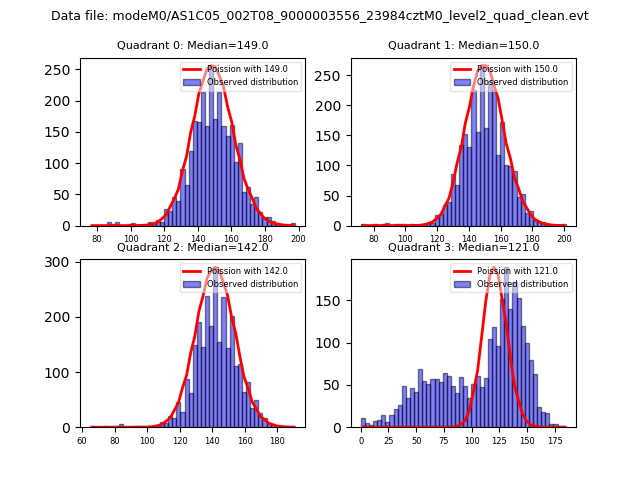 |
 |
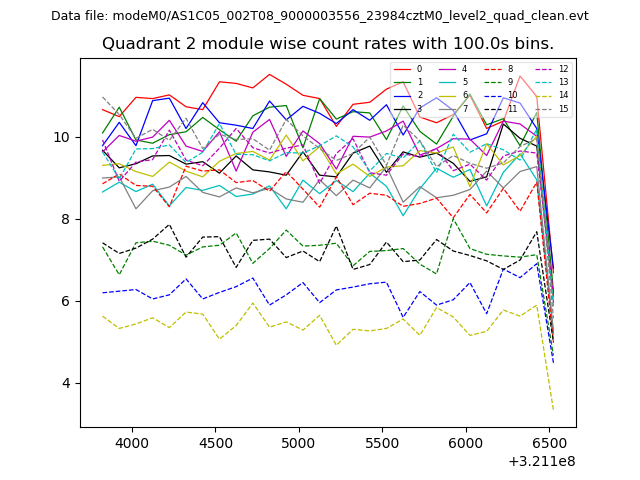
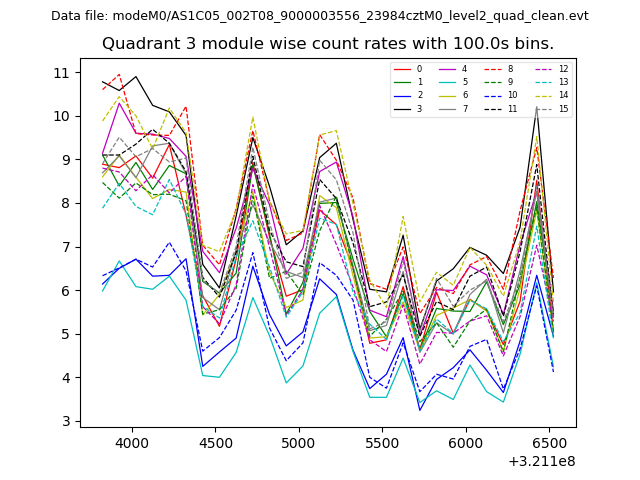
| Quadrant-wise count rates Data is divided into 100 sec bins |
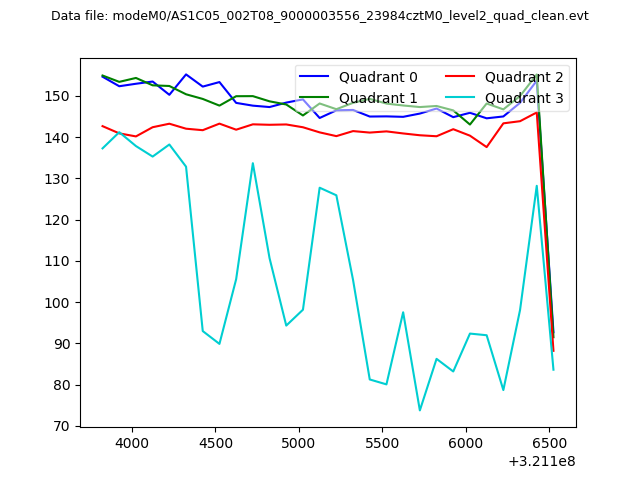 |
|
| Module-wise count rates for Quadrant A Data is divided into 100 sec bins |
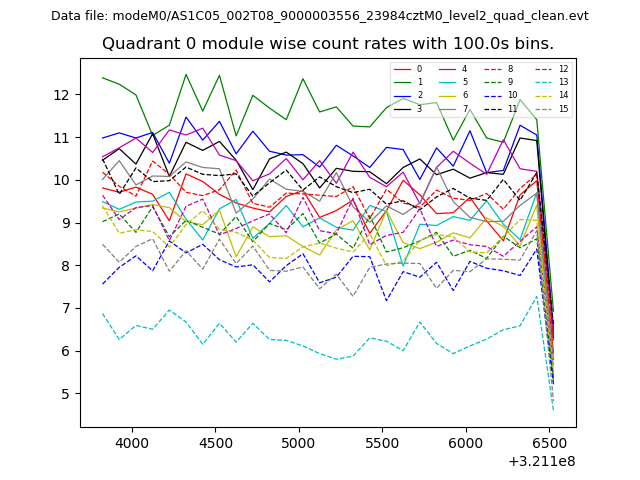 |
 |
| Module-wise count rates for Quadrant B Data is divided into 100 sec bins |
 |
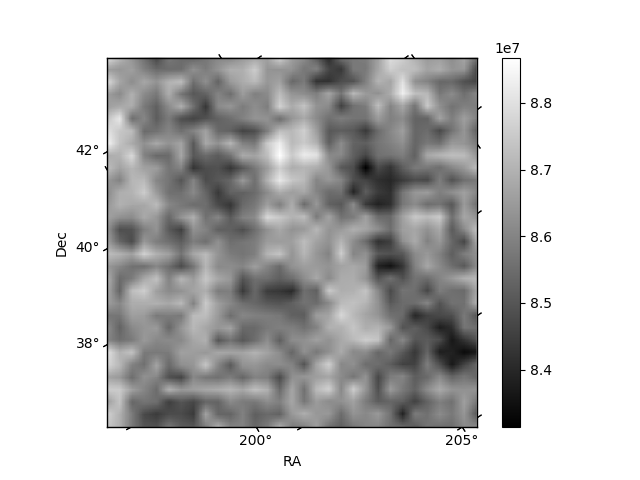 |
| Module-wise count rates for Quadrant C Data is divided into 100 sec bins |
 |
 |
| Module-wise count rates for Quadrant D Data is divided into 100 sec bins |
 |
 |
| Parameter | Plot |
|---|---|
| CZT HV Monitor | 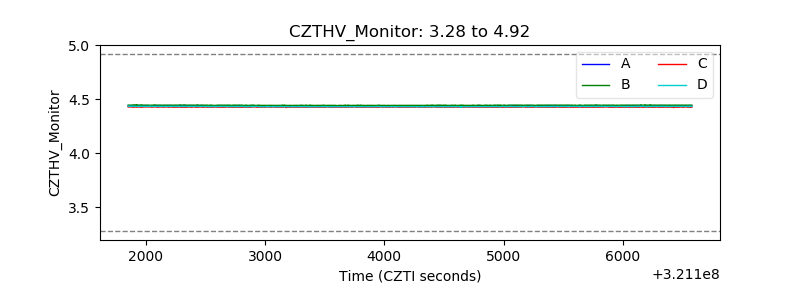 |
| D_VDD | 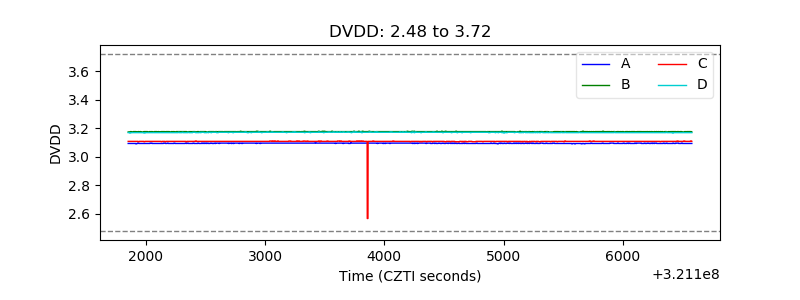 |
| Temperature 1 | 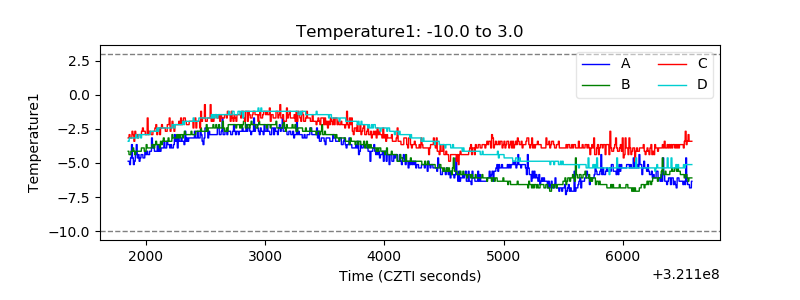 |
| Veto HV Monitor | 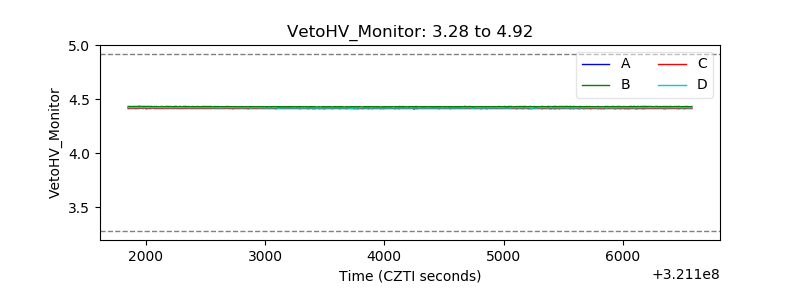 |
| Veto LLD | 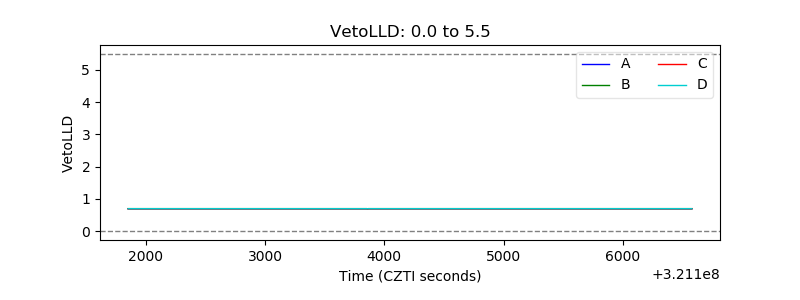 |
| Alpha Counter | 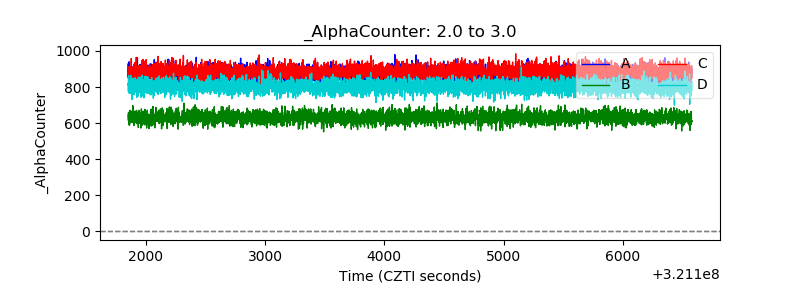 |
| _CPM_Rate | 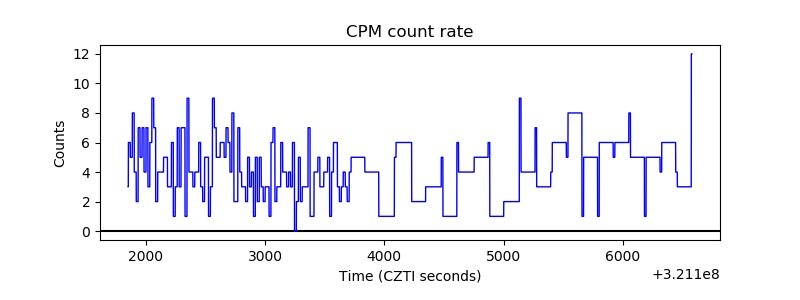 |
| CZT Counter | 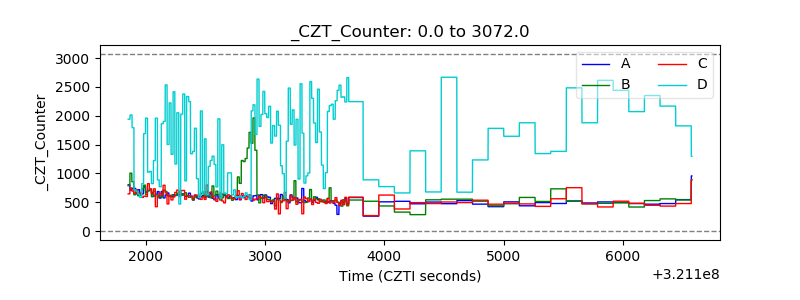 |
| +2.5 Volts monitor |  |
| +5 Volts monitor |  |
| _ROLL_ROT | 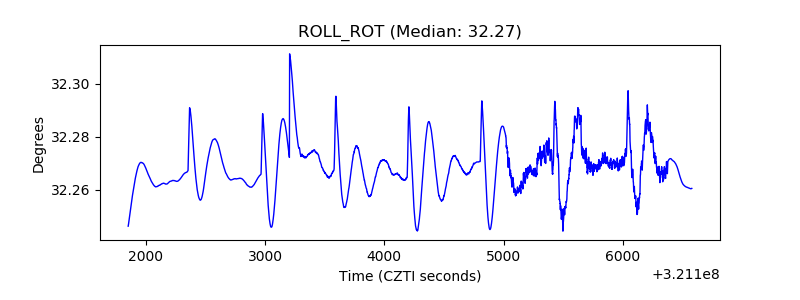 |
| _Roll_DEC | 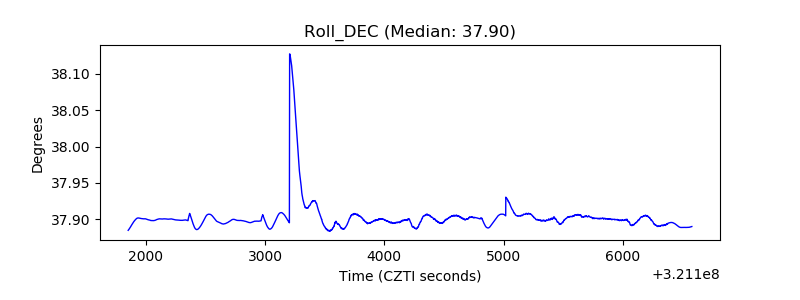 |
| _Roll_RA | 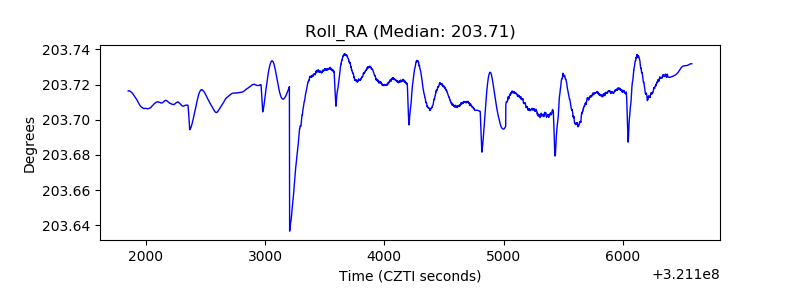 |
| Veto Counter | 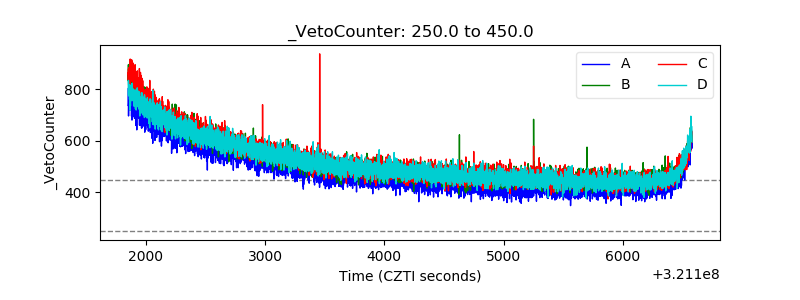 |