| Param | Original file | Final file |
|---|---|---|
| Filename | modeM0/AS1T03_182T01_9000003560_24084cztM0_level2.evt | modeM0/AS1T03_182T01_9000003560_24084cztM0_level2_quad_clean.evt |
| Size (bytes) | 534,124,800 | 109,428,480 |
| Size | 509.4 MB | 104.4 MB |
| Events in quadrant A | 3,509,615 | 721,277 |
| Events in quadrant B | 3,888,876 | 733,107 |
| Events in quadrant C | 3,582,466 | 704,832 |
| Events in quadrant D | 4,737,962 | 685,039 |
| Mode SS | |||
|---|---|---|---|
| Quadrant | BADHDUFLAG | Total packets | Discarded packets |
| A | 0 | 136 | 0 |
| B | 0 | 136 | 0 |
| C | 0 | 136 | 0 |
| D | 0 | 136 | 0 |
| Mode M9 | |||
|---|---|---|---|
| Quadrant | BADHDUFLAG | Total packets | Discarded packets |
| A | 0 | 16 | 0 |
| B | 0 | 17 | 0 |
| C | 0 | 17 | 0 |
| D | 0 | 17 | 0 |
| Mode M0 | |||
|---|---|---|---|
| Quadrant | BADHDUFLAG | Total packets | Discarded packets |
| A | 0 | 14341 | 2 |
| B | 0 | 15760 | 2 |
| C | 0 | 14579 | 2 |
| D | 0 | 18458 | 2 |
| Quadrant | Total seconds | Saturated seconds | Saturation percentage |
|---|---|---|---|
| A | 6745 | 29 | 0.429948% |
| B | 6745 | 96 | 1.423277% |
| C | 6745 | 67 | 0.993328% |
| D | 6745 | 170 | 2.520385% |
Noise dominated data is calculated using 1-second bins in cleaned event files. If a bin has >2000 counts, and if more than 50% of those come from <1% of pixels, then it is considered to be noise-dominated and hence unusable.
| Quadrant | # 1 sec bins | Bins with >0 counts | Bins with >2000 counts | High rate bins dominated by noise | Noise dominated (total time) | Noise dominated (detector-on time) | Marked lightcurve |
|---|---|---|---|---|---|---|---|
| A | 8000 | 6746 | 2 | 2 | 0.03% | 0.03% | 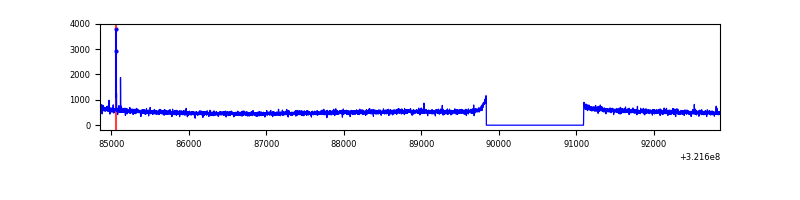 |
| B | 8000 | 6746 | 38 | 38 | 0.47% | 0.56% |  |
| C | 8000 | 6746 | 0 | 0 | 0.00% | 0.00% | 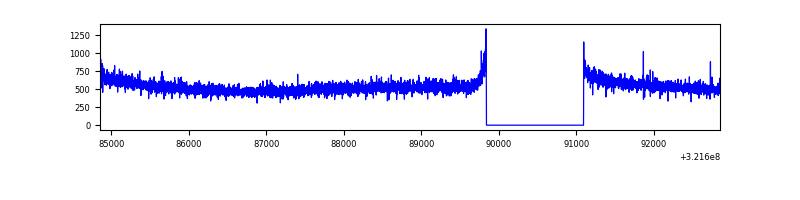 |
| D | 8000 | 6746 | 107 | 107 | 1.34% | 1.59% |  |
Top three noisy pixels from each quadrant. If the there are fewer than three noisy pixels in the level2.evt file, extra rows are filled as -1
| Pixel properties | Quadrant properties | ||||||
|---|---|---|---|---|---|---|---|
| Quadrant | DetID | PixID | Counts | Sigma | Mean | Median | Sigma |
| A | 6 | 16 | 13455 | 69.95 | 905 | 891 | 179.6 |
| A | 13 | 254 | 11363 | 58.3 | 905 | 891 | 179.6 |
| A | 2 | 250 | 9694 | 49.01 | 905 | 891 | 179.6 |
| B | 0 | 245 | 265280 | 1587.91 | 896 | 875 | 166.5 |
| B | 0 | 197 | 72796 | 431.93 | 896 | 875 | 166.5 |
| B | 0 | 229 | 20086 | 115.37 | 896 | 875 | 166.5 |
| C | 14 | 238 | 139234 | 680.14 | 875 | 884 | 203.4 |
| C | 7 | 247 | 28584 | 136.17 | 875 | 884 | 203.4 |
| C | 13 | 61 | 6046 | 25.38 | 875 | 884 | 203.4 |
| D | 8 | 195 | 837078 | 3886.53 | 882 | 860 | 215.2 |
| D | 1 | 52 | 296717 | 1375.07 | 882 | 860 | 215.2 |
| D | 11 | 176 | 157693 | 728.92 | 882 | 860 | 215.2 |
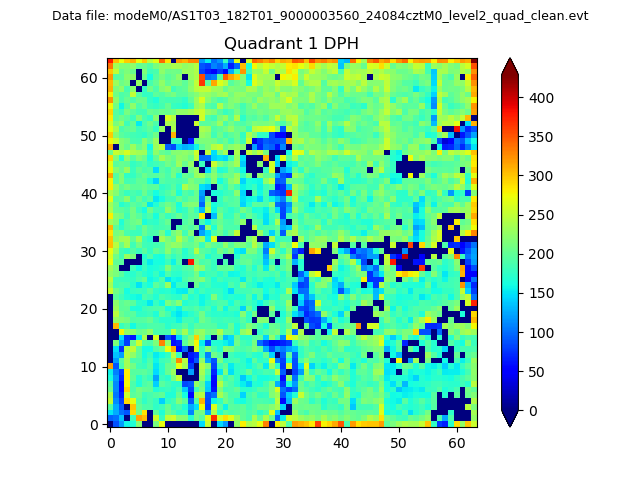
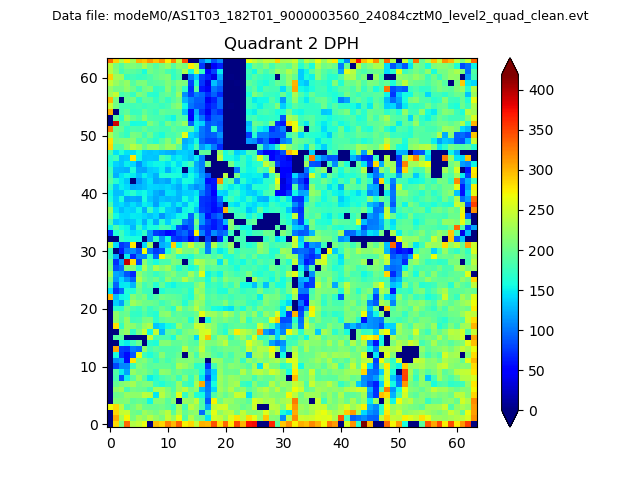
Histogram calculated using DETX and DETY for each event in the final _common_clean file
| Quadrant A |  |
 |
Quadrant B |
|---|---|---|---|
| Quadrant D | 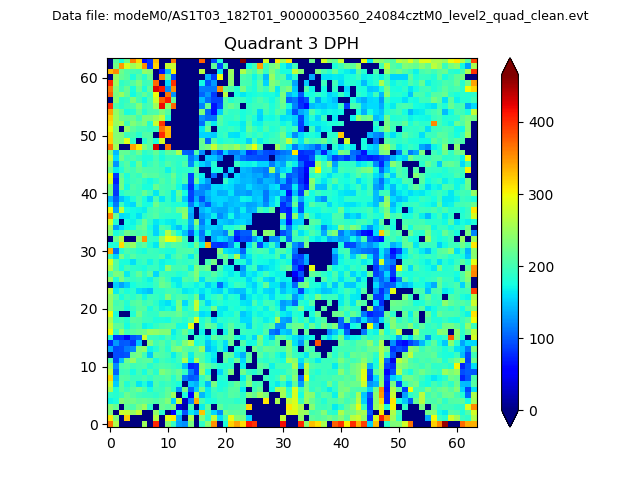 |
 |
Quadrant C |
| Plot type | Count rate plots | Images |
|---|---|---|
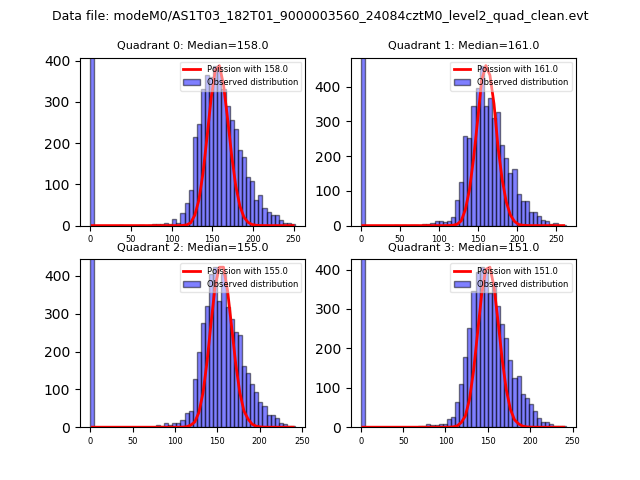
| Comparison with Poisson distribution Blue bars denote a histogram of data divided into 1 sec bins. Red curve is a Poisson curve with rate = median count rate of data. |
 |
 |
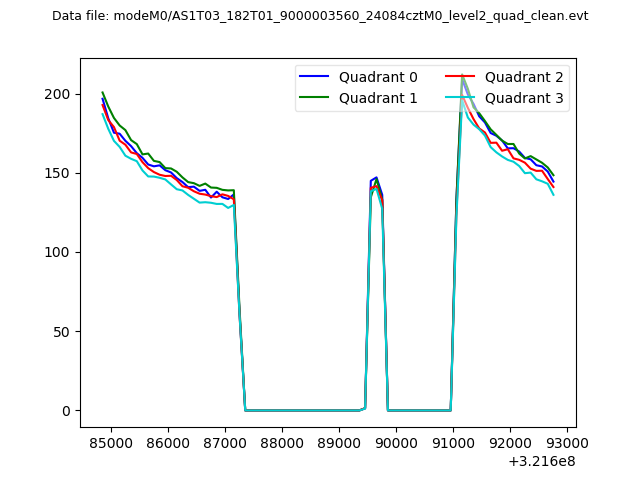
| Quadrant-wise count rates Data is divided into 100 sec bins |
 |
|
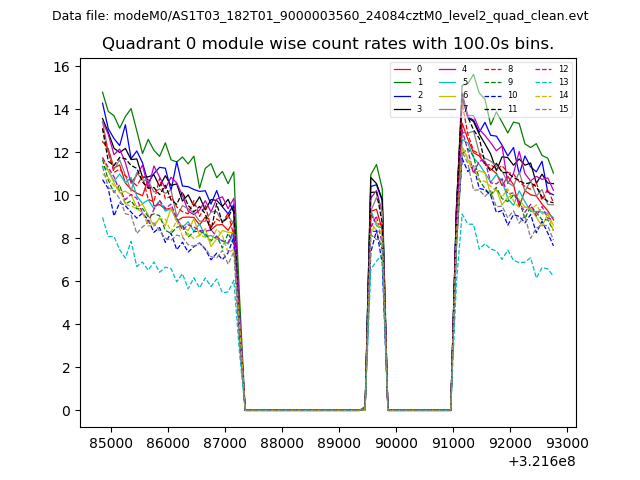
| Module-wise count rates for Quadrant A Data is divided into 100 sec bins |
 |
 |
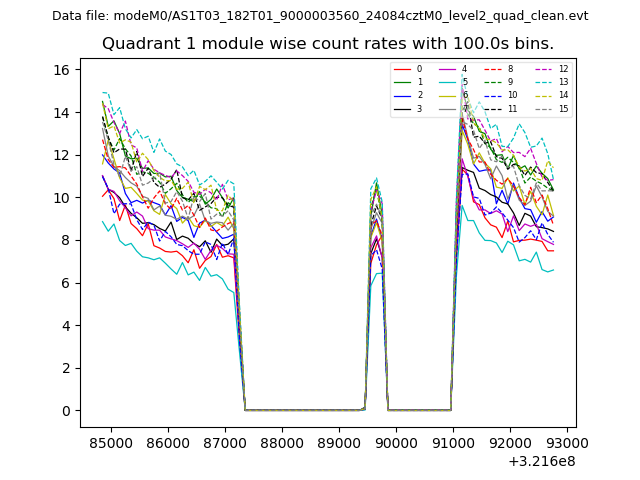
| Module-wise count rates for Quadrant B Data is divided into 100 sec bins |
 |
 |
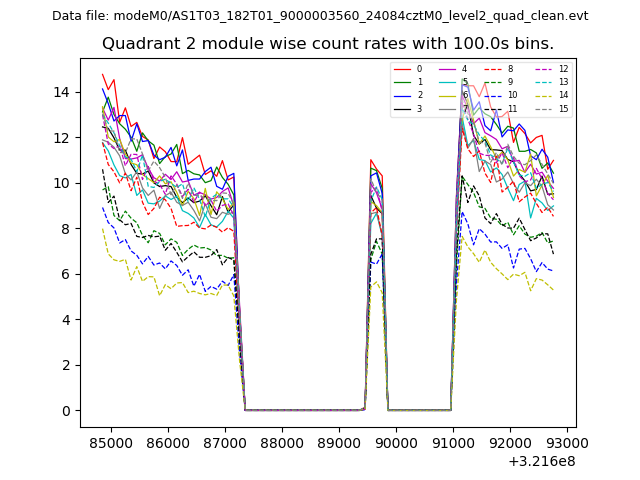
| Module-wise count rates for Quadrant C Data is divided into 100 sec bins |
 |
 |
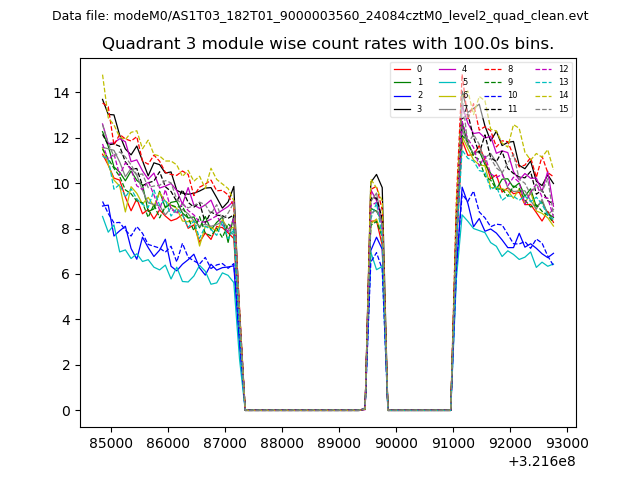
| Module-wise count rates for Quadrant D Data is divided into 100 sec bins |
 |
 |
| Parameter | Plot |
|---|---|
| CZT HV Monitor | 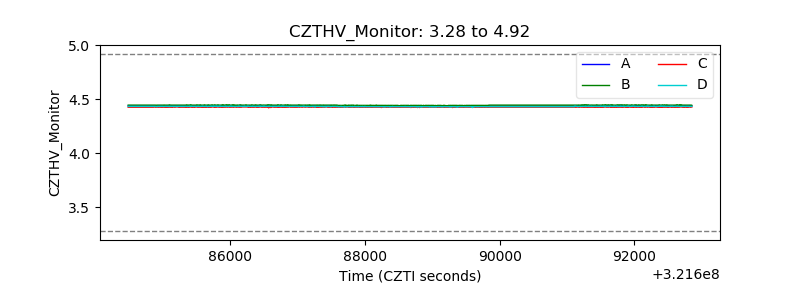 |
| D_VDD | 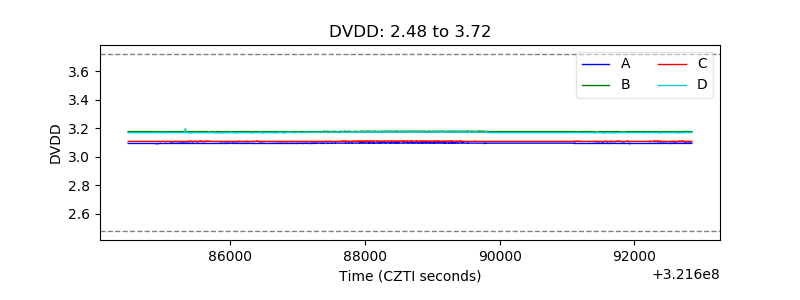 |
| Temperature 1 | 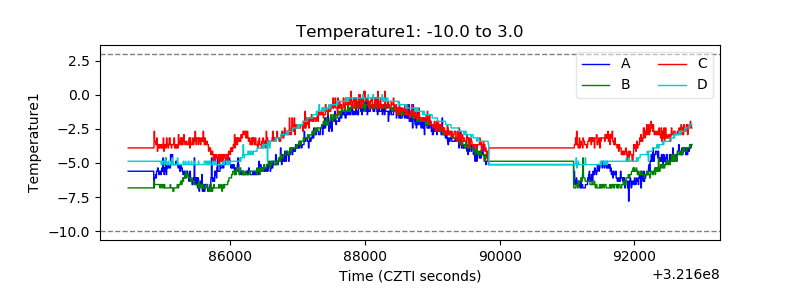 |
| Veto HV Monitor | 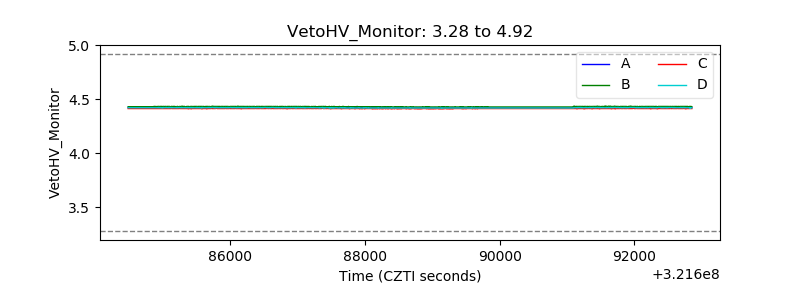 |
| Veto LLD | 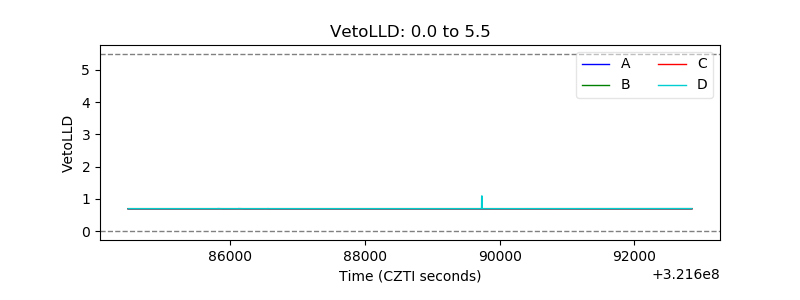 |
| Alpha Counter | 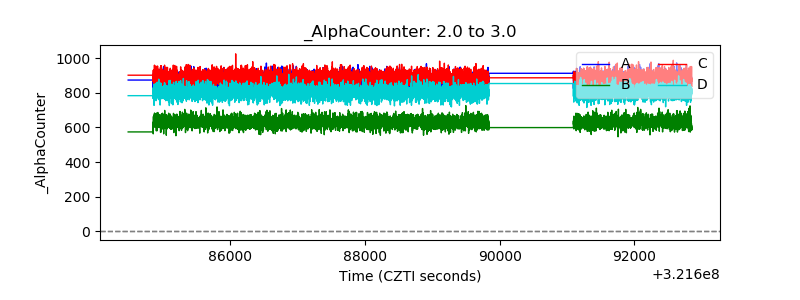 |
| _CPM_Rate | 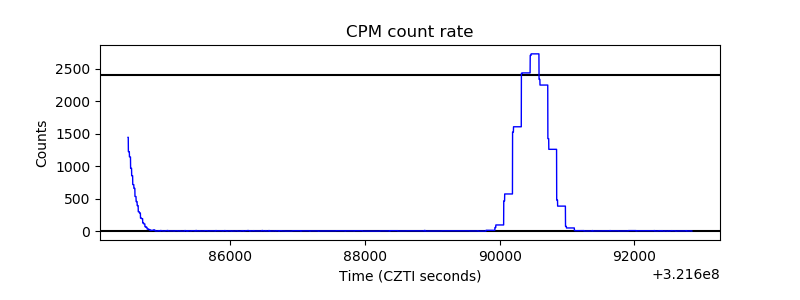 |
| CZT Counter | 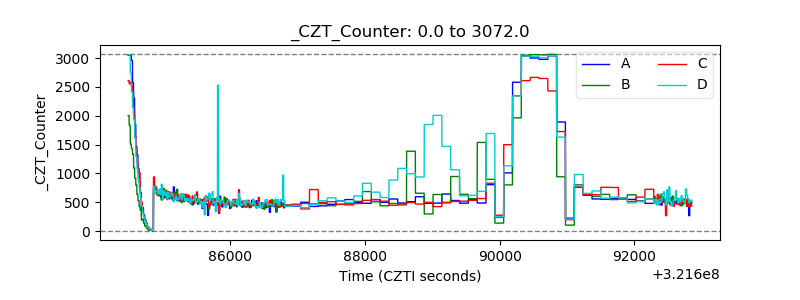 |
| +2.5 Volts monitor |  |
| +5 Volts monitor |  |
| _ROLL_ROT | 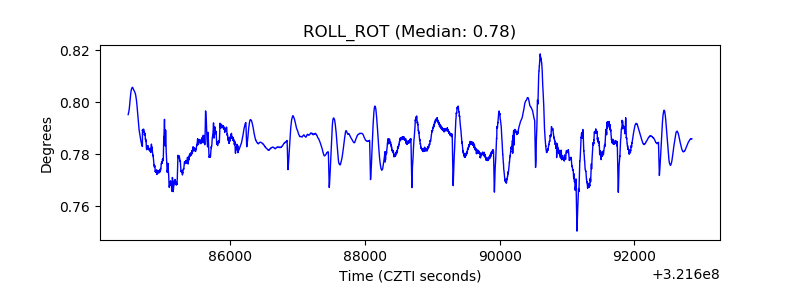 |
| _Roll_DEC | 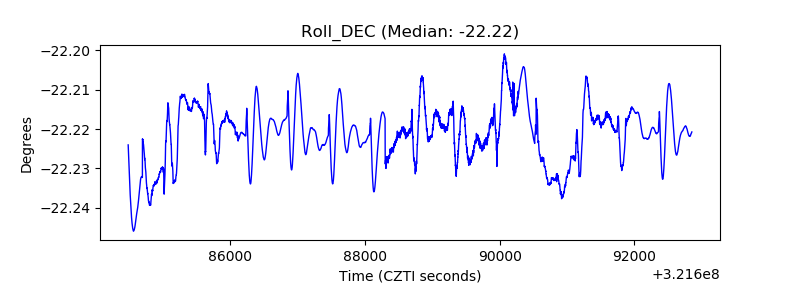 |
| _Roll_RA | 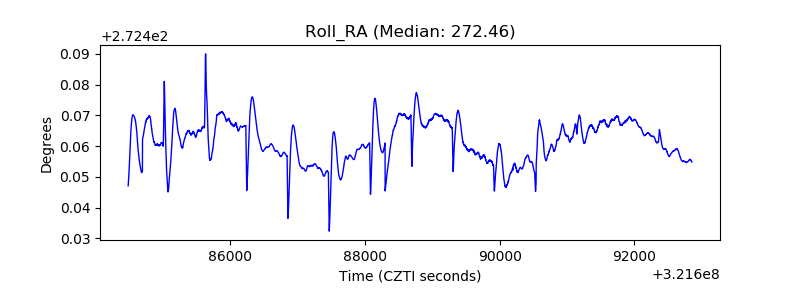 |
| Veto Counter | 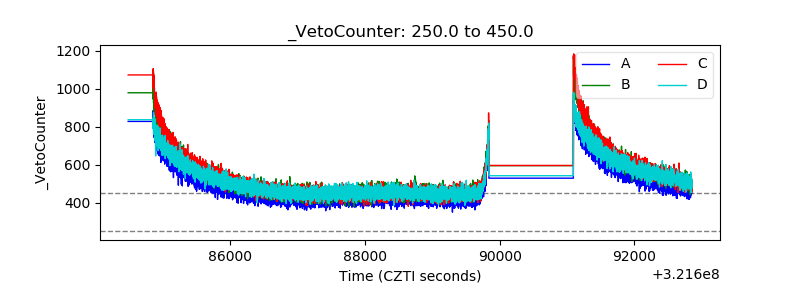 |