| Param | Original file | Final file |
|---|---|---|
| Filename | modeM0/AS1T03_182T01_9000003560_24086cztM0_level2.evt | modeM0/AS1T03_182T01_9000003560_24086cztM0_level2_quad_clean.evt |
| Size (bytes) | 438,848,640 | 74,747,520 |
| Size | 418.5 MB | 71.3 MB |
| Events in quadrant A | 2,858,334 | 488,368 |
| Events in quadrant B | 2,951,197 | 489,662 |
| Events in quadrant C | 2,812,885 | 464,147 |
| Events in quadrant D | 4,312,733 | 454,252 |
| Mode SS | |||
|---|---|---|---|
| Quadrant | BADHDUFLAG | Total packets | Discarded packets |
| A | 0 | 106 | 0 |
| B | 0 | 106 | 0 |
| C | 0 | 106 | 0 |
| D | 0 | 106 | 0 |
| Mode M9 | |||
|---|---|---|---|
| Quadrant | BADHDUFLAG | Total packets | Discarded packets |
| A | 0 | 13 | 0 |
| B | 0 | 13 | 0 |
| C | 0 | 13 | 0 |
| D | 0 | 13 | 0 |
| Mode M0 | |||
|---|---|---|---|
| Quadrant | BADHDUFLAG | Total packets | Discarded packets |
| A | 0 | 11323 | 1 |
| B | 0 | 11749 | 1 |
| C | 0 | 11259 | 1 |
| D | 0 | 16677 | 1 |
| Quadrant | Total seconds | Saturated seconds | Saturation percentage |
|---|---|---|---|
| A | 5243 | 53 | 1.010872% |
| B | 5244 | 66 | 1.258581% |
| C | 5244 | 82 | 1.563692% |
| D | 5244 | 120 | 2.288330% |
Noise dominated data is calculated using 1-second bins in cleaned event files. If a bin has >2000 counts, and if more than 50% of those come from <1% of pixels, then it is considered to be noise-dominated and hence unusable.
| Quadrant | # 1 sec bins | Bins with >0 counts | Bins with >2000 counts | High rate bins dominated by noise | Noise dominated (total time) | Noise dominated (detector-on time) | Marked lightcurve |
|---|---|---|---|---|---|---|---|
| A | 6548 | 5244 | 0 | 0 | 0.00% | 0.00% | 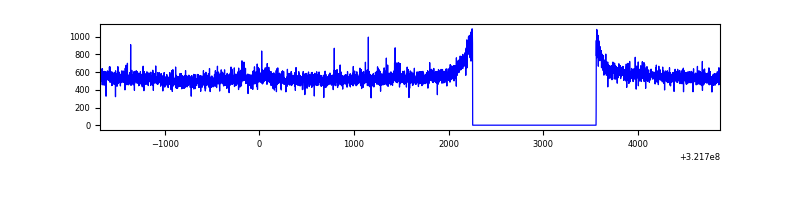 |
| B | 6549 | 5245 | 3 | 3 | 0.05% | 0.06% | 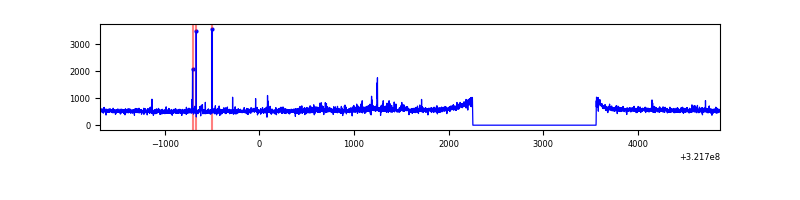 |
| C | 6549 | 5245 | 0 | 0 | 0.00% | 0.00% | 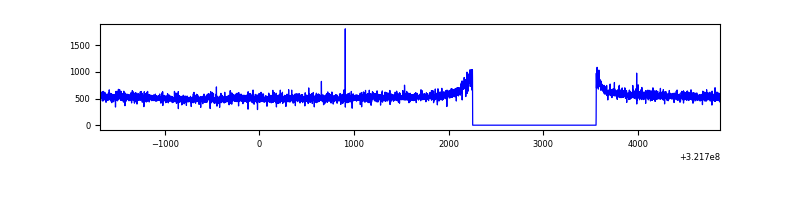 |
| D | 6549 | 5245 | 76 | 76 | 1.16% | 1.45% | 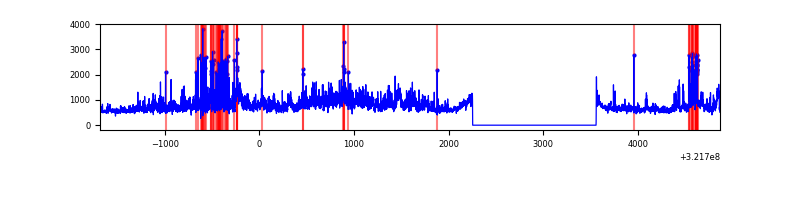 |
Top three noisy pixels from each quadrant. If the there are fewer than three noisy pixels in the level2.evt file, extra rows are filled as -1
| Pixel properties | Quadrant properties | ||||||
|---|---|---|---|---|---|---|---|
| Quadrant | DetID | PixID | Counts | Sigma | Mean | Median | Sigma |
| A | 2 | 250 | 35062 | 236.1 | 731 | 718 | 145.5 |
| A | 13 | 254 | 8868 | 56.03 | 731 | 718 | 145.5 |
| A | 0 | 226 | 6470 | 39.54 | 731 | 718 | 145.5 |
| B | 0 | 197 | 82669 | 611.05 | 716 | 701 | 134.1 |
| B | 0 | 230 | 21274 | 153.37 | 716 | 701 | 134.1 |
| B | 15 | 32 | 16998 | 121.49 | 716 | 701 | 134.1 |
| C | 14 | 238 | 111162 | 690.01 | 689 | 696 | 160.1 |
| C | 7 | 247 | 10167 | 59.16 | 689 | 696 | 160.1 |
| C | 3 | 233 | 5098 | 27.5 | 689 | 696 | 160.1 |
| D | 8 | 195 | 923515 | 5302.69 | 710 | 690 | 174.0 |
| D | 1 | 52 | 466479 | 2676.49 | 710 | 690 | 174.0 |
| D | 12 | 218 | 155371 | 888.82 | 710 | 690 | 174.0 |
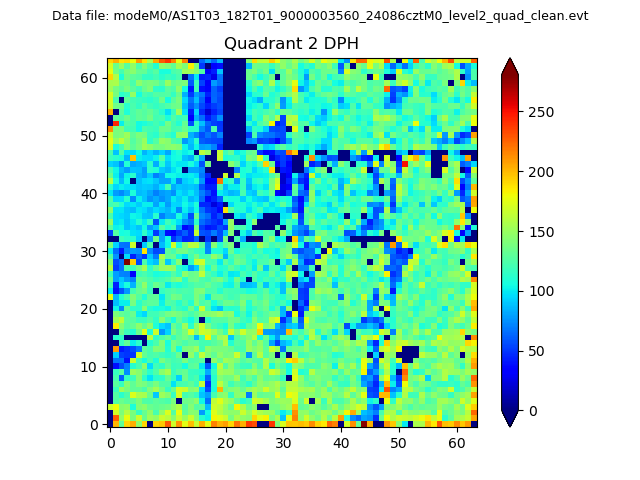
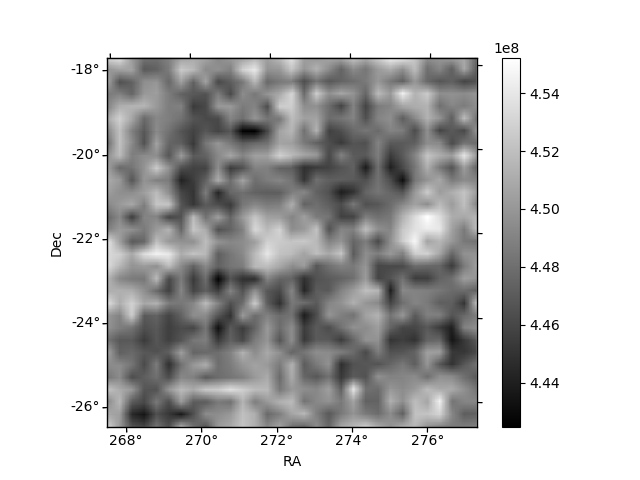
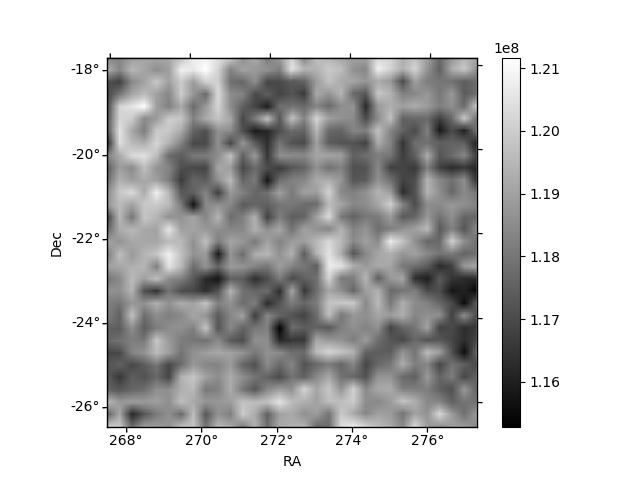
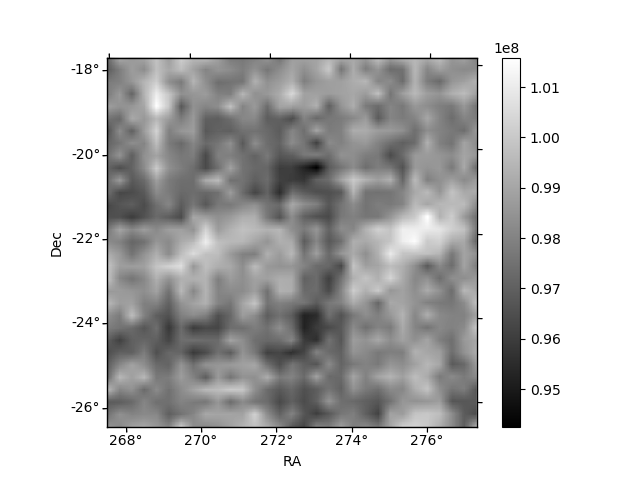
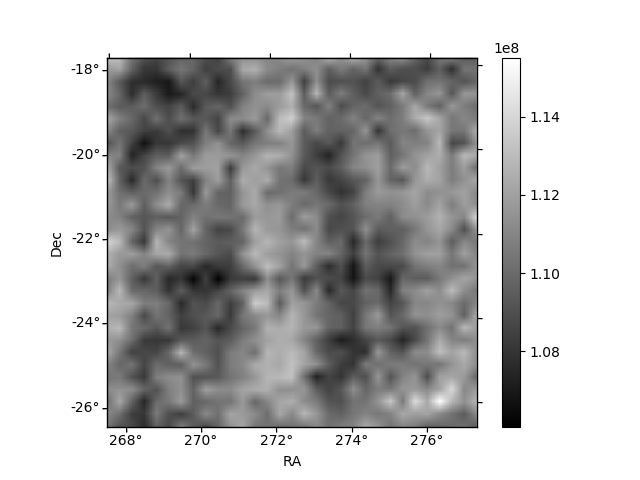
Histogram calculated using DETX and DETY for each event in the final _common_clean file
| Quadrant A | 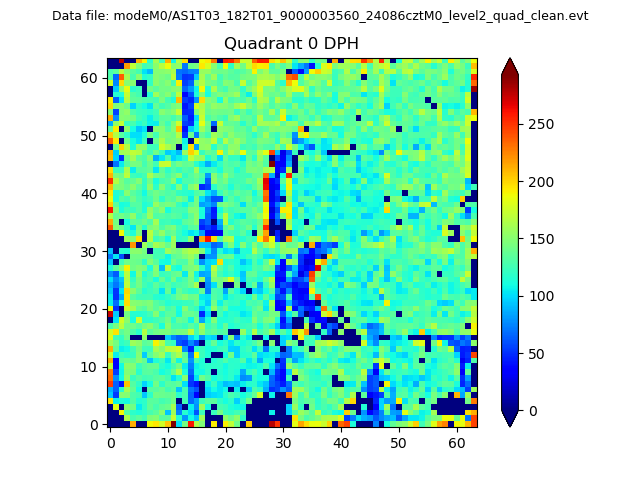 |
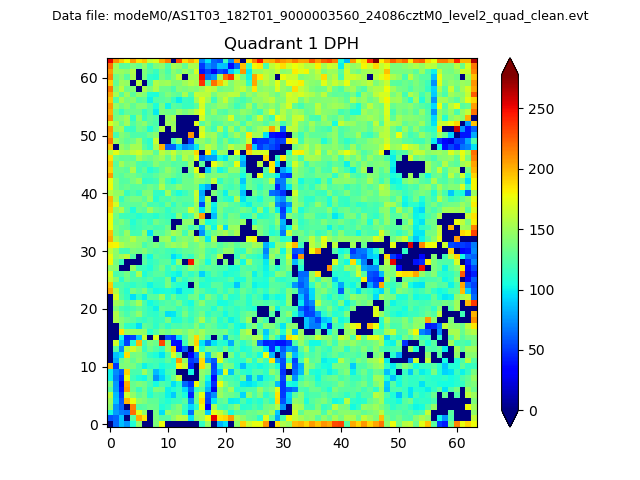 |
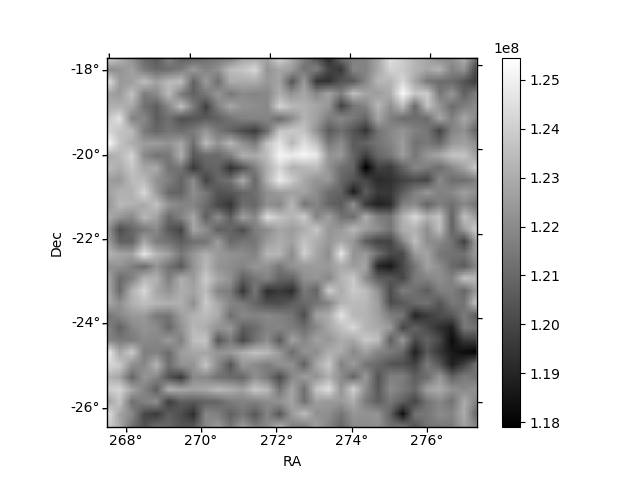
Quadrant B |
|---|---|---|---|
| Quadrant D | 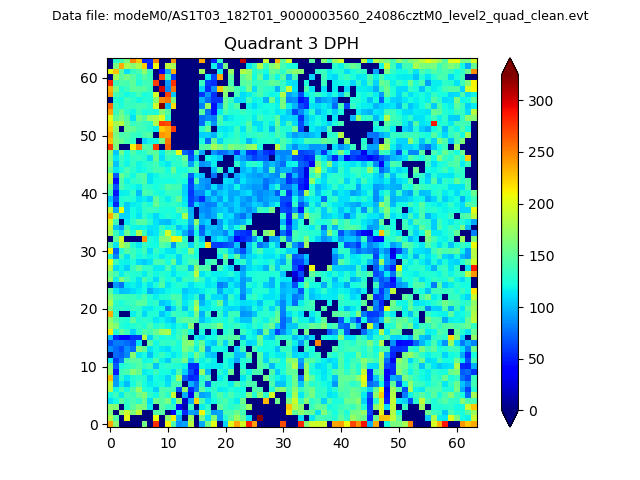 |
 |
Quadrant C |
| Plot type | Count rate plots | Images |
|---|---|---|
| Comparison with Poisson distribution Blue bars denote a histogram of data divided into 1 sec bins. Red curve is a Poisson curve with rate = median count rate of data. |
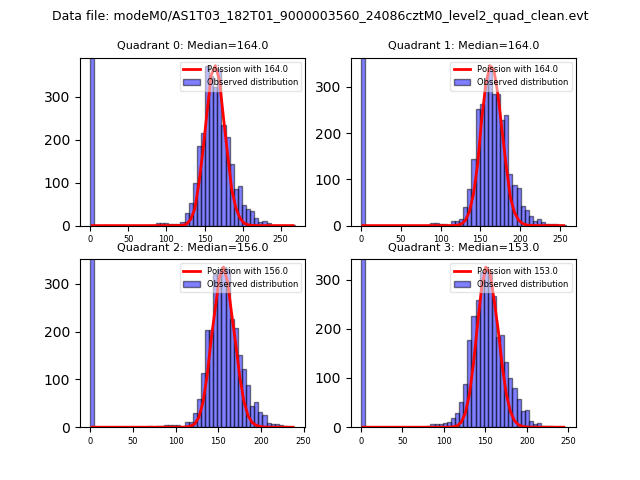 |
 |
| Quadrant-wise count rates Data is divided into 100 sec bins |
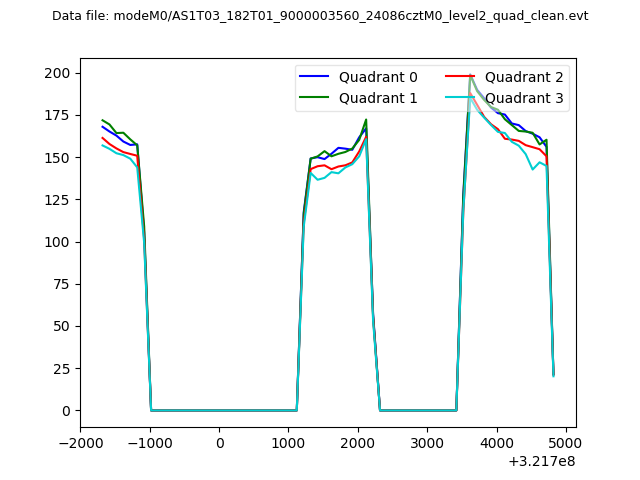 |
|
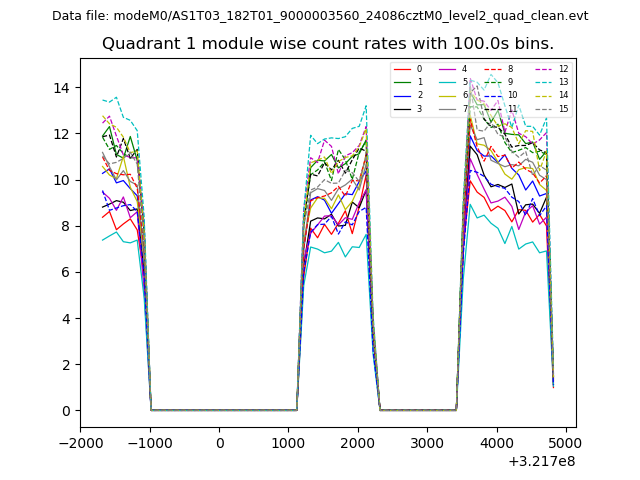
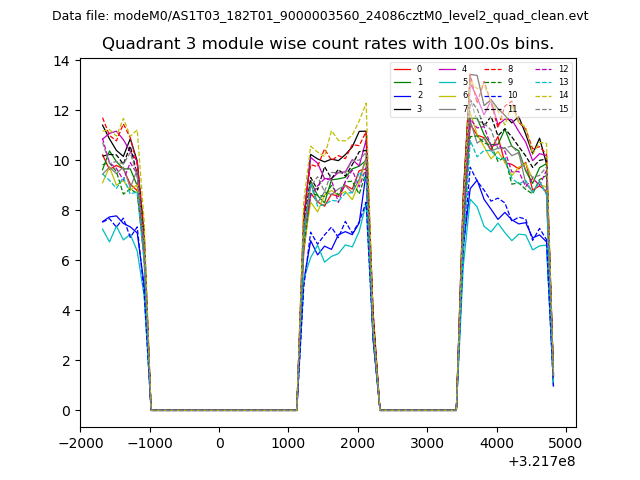
| Module-wise count rates for Quadrant A Data is divided into 100 sec bins |
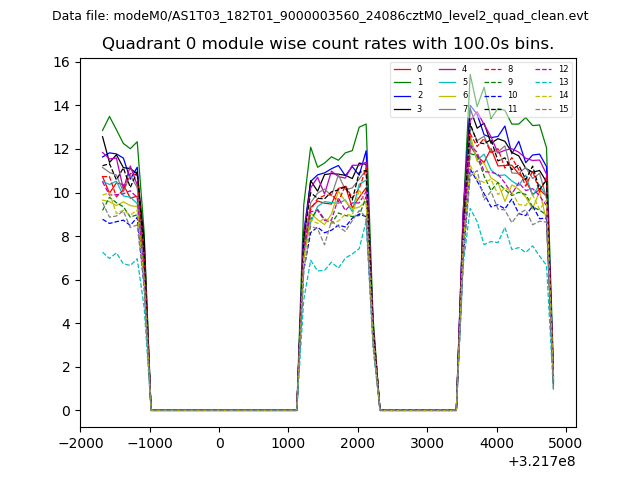 |
 |
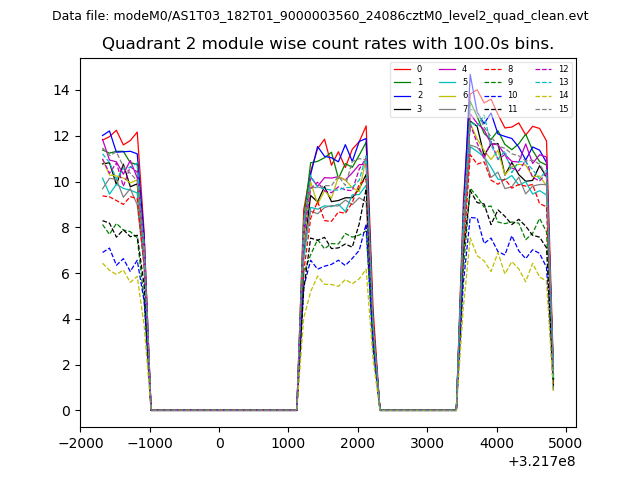
| Module-wise count rates for Quadrant B Data is divided into 100 sec bins |
 |
 |
| Module-wise count rates for Quadrant C Data is divided into 100 sec bins |
 |
 |
| Module-wise count rates for Quadrant D Data is divided into 100 sec bins |
 |
 |
| Parameter | Plot |
|---|---|
| CZT HV Monitor | 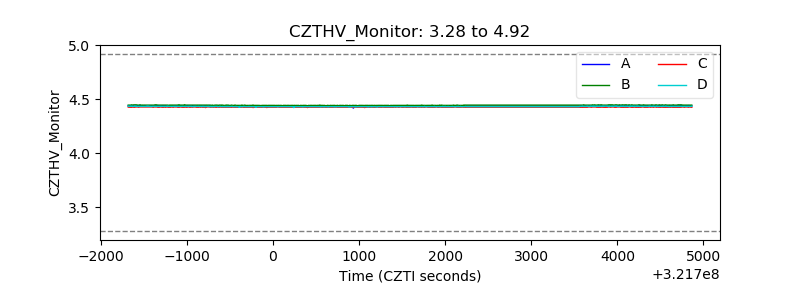 |
| D_VDD | 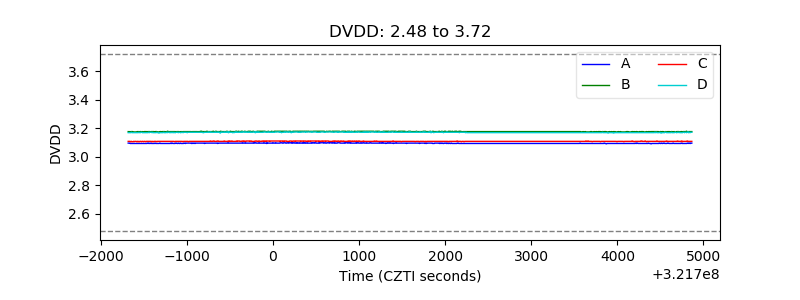 |
| Temperature 1 | 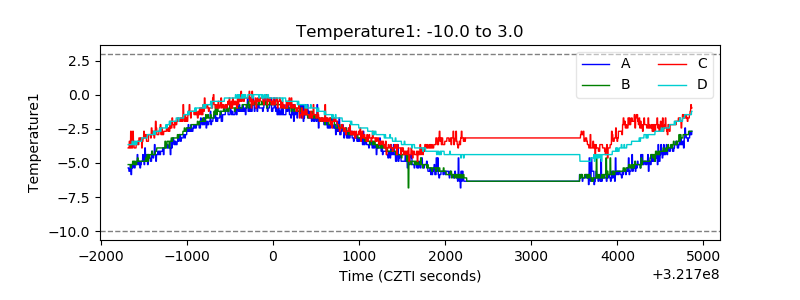 |
| Veto HV Monitor | 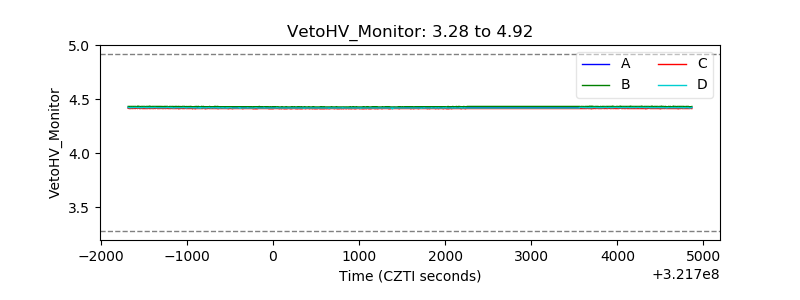 |
| Veto LLD | 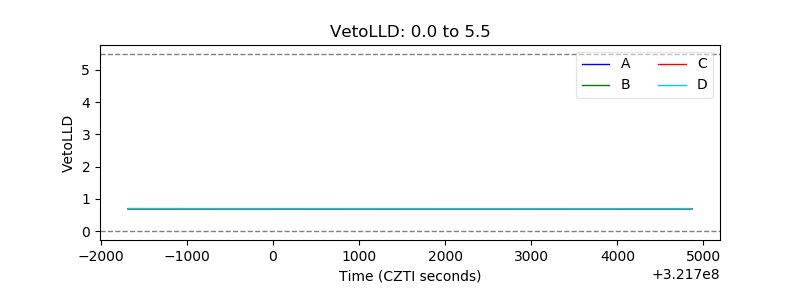 |
| Alpha Counter | 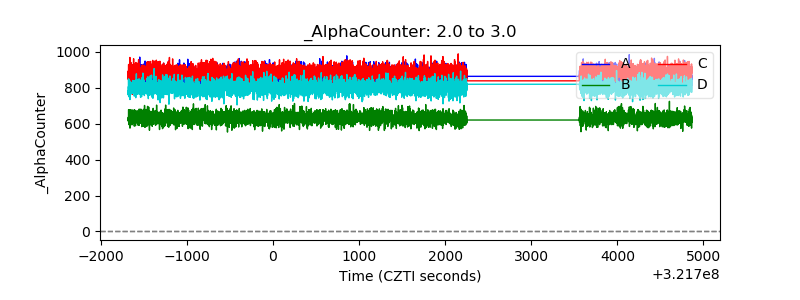 |
| _CPM_Rate | 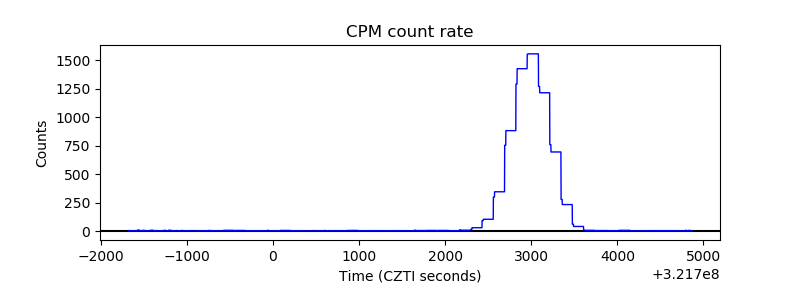 |
| CZT Counter | 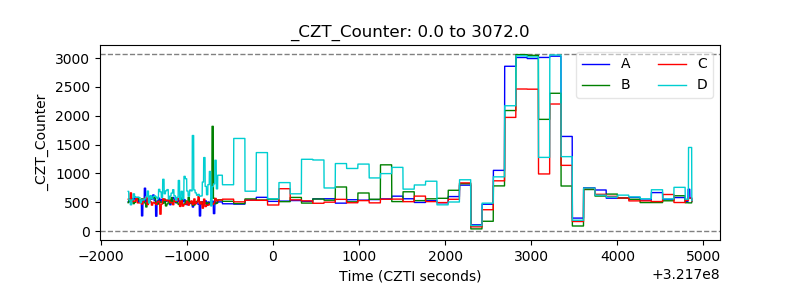 |
| +2.5 Volts monitor |  |
| +5 Volts monitor |  |
| _ROLL_ROT | 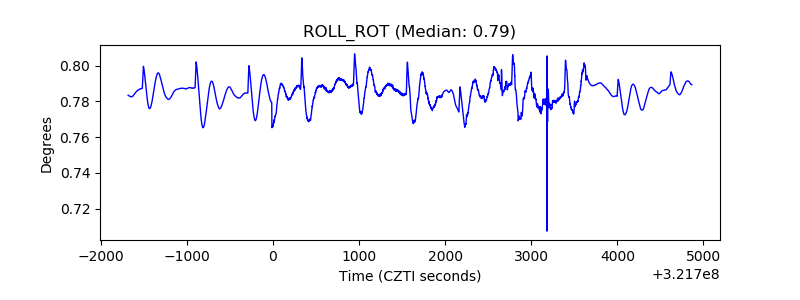 |
| _Roll_DEC | 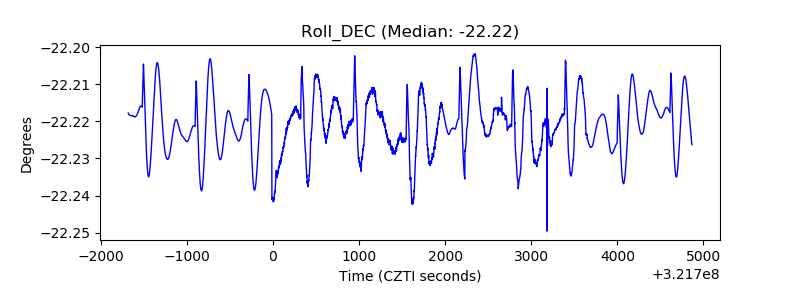 |
| _Roll_RA | 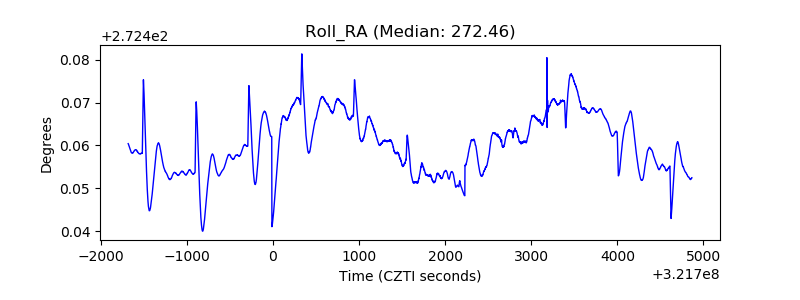 |
| Veto Counter | 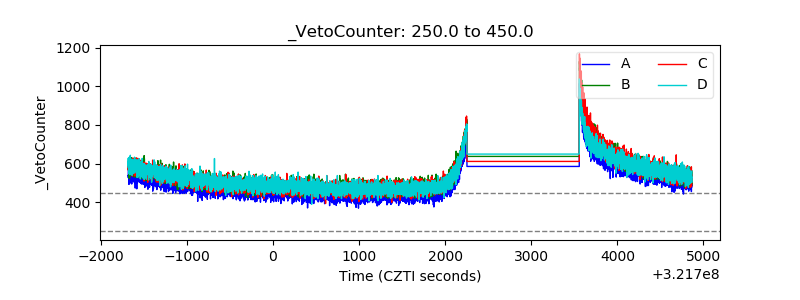 |