| Param | Original file | Final file |
|---|---|---|
| Filename | modeM0/AS1T03_182T01_9000003560_24087cztM0_level2.evt | modeM0/AS1T03_182T01_9000003560_24087cztM0_level2_quad_clean.evt |
| Size (bytes) | 539,758,080 | 82,356,480 |
| Size | 514.8 MB | 78.5 MB |
| Events in quadrant A | 3,338,902 | 527,757 |
| Events in quadrant B | 3,662,925 | 529,588 |
| Events in quadrant C | 3,339,652 | 503,820 |
| Events in quadrant D | 5,577,599 | 492,301 |
| Mode SS | |||
|---|---|---|---|
| Quadrant | BADHDUFLAG | Total packets | Discarded packets |
| A | 0 | 128 | 0 |
| B | 0 | 128 | 0 |
| C | 0 | 128 | 0 |
| D | 0 | 128 | 0 |
| Mode M9 | |||
|---|---|---|---|
| Quadrant | BADHDUFLAG | Total packets | Discarded packets |
| A | 0 | 12 | 0 |
| B | 0 | 12 | 0 |
| C | 0 | 12 | 0 |
| D | 0 | 12 | 0 |
| Mode M0 | |||
|---|---|---|---|
| Quadrant | BADHDUFLAG | Total packets | Discarded packets |
| A | 0 | 13330 | 2 |
| B | 0 | 14500 | 1 |
| C | 0 | 13394 | 1 |
| D | 0 | 21077 | 1 |
| Quadrant | Total seconds | Saturated seconds | Saturation percentage |
|---|---|---|---|
| A | 6311 | 87 | 1.378545% |
| B | 6311 | 103 | 1.632071% |
| C | 6312 | 114 | 1.806084% |
| D | 6312 | 476 | 7.541191% |
Noise dominated data is calculated using 1-second bins in cleaned event files. If a bin has >2000 counts, and if more than 50% of those come from <1% of pixels, then it is considered to be noise-dominated and hence unusable.
| Quadrant | # 1 sec bins | Bins with >0 counts | Bins with >2000 counts | High rate bins dominated by noise | Noise dominated (total time) | Noise dominated (detector-on time) | Marked lightcurve |
|---|---|---|---|---|---|---|---|
| A | 7526 | 6311 | 0 | 0 | 0.00% | 0.00% | 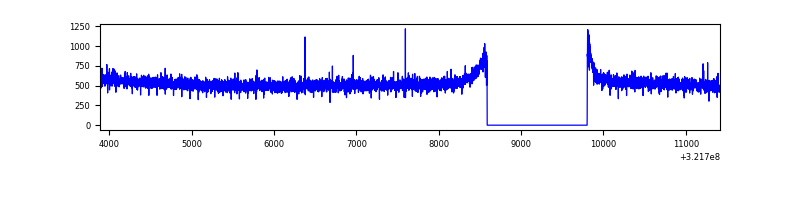 |
| B | 7526 | 6312 | 9 | 9 | 0.12% | 0.14% |  |
| C | 7527 | 6312 | 0 | 0 | 0.00% | 0.00% | 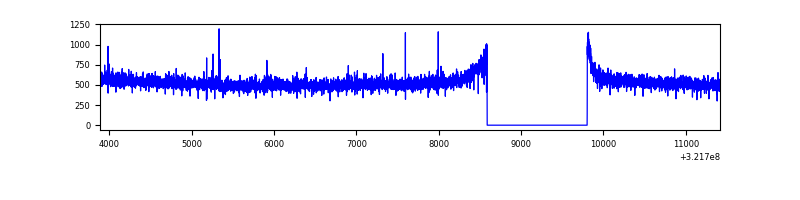 |
| D | 7527 | 6312 | 357 | 357 | 4.74% | 5.66% |  |
Top three noisy pixels from each quadrant. If the there are fewer than three noisy pixels in the level2.evt file, extra rows are filled as -1
| Pixel properties | Quadrant properties | ||||||
|---|---|---|---|---|---|---|---|
| Quadrant | DetID | PixID | Counts | Sigma | Mean | Median | Sigma |
| A | 13 | 254 | 10476 | 55.47 | 863 | 847 | 173.6 |
| A | 0 | 226 | 7487 | 38.25 | 863 | 847 | 173.6 |
| A | 3 | 137 | 6786 | 34.22 | 863 | 847 | 173.6 |
| B | 0 | 197 | 288689 | 1818.15 | 845 | 826 | 158.3 |
| B | 0 | 189 | 20310 | 123.06 | 845 | 826 | 158.3 |
| B | 12 | 111 | 18051 | 108.79 | 845 | 826 | 158.3 |
| C | 14 | 238 | 130406 | 683.0 | 816 | 824 | 189.7 |
| C | 7 | 247 | 19933 | 100.72 | 816 | 824 | 189.7 |
| C | 0 | 239 | 6117 | 27.9 | 816 | 824 | 189.7 |
| D | 12 | 218 | 931673 | 4659.82 | 822 | 803 | 199.8 |
| D | 8 | 195 | 730183 | 3651.18 | 822 | 803 | 199.8 |
| D | 1 | 52 | 614643 | 3072.81 | 822 | 803 | 199.8 |
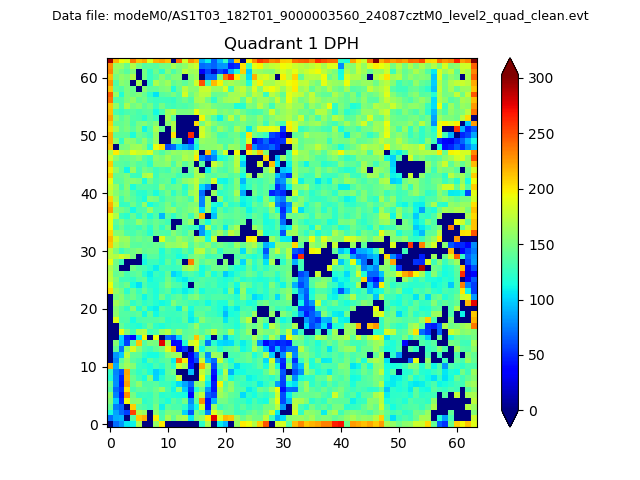
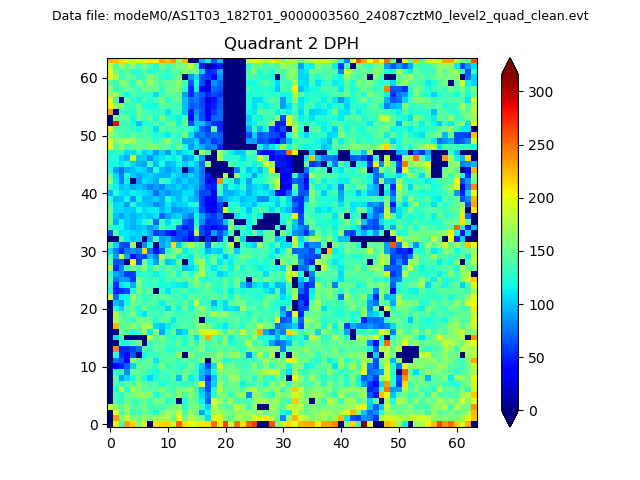
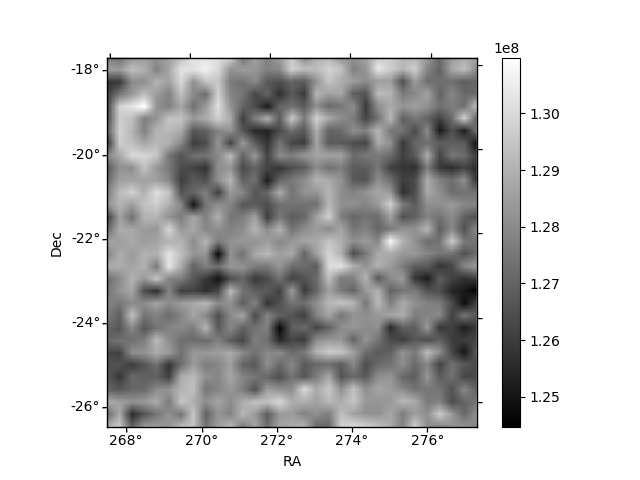
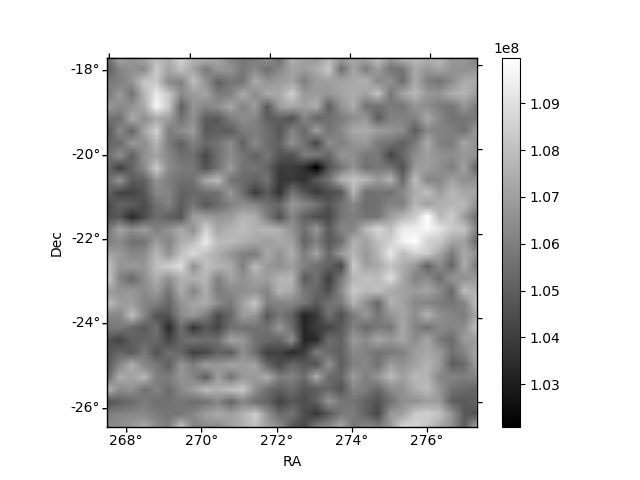
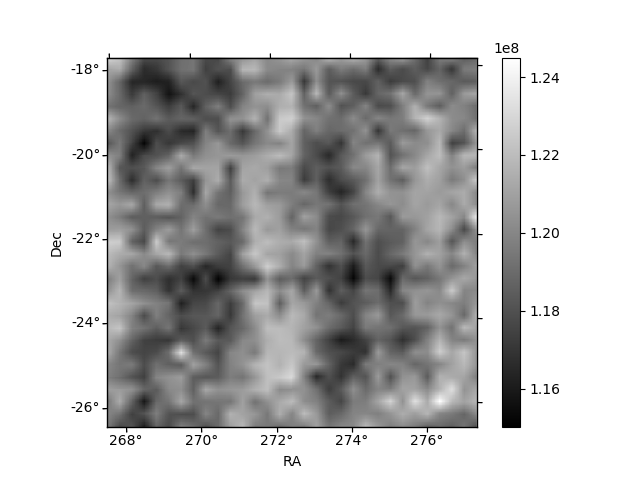
Histogram calculated using DETX and DETY for each event in the final _common_clean file
| Quadrant A | 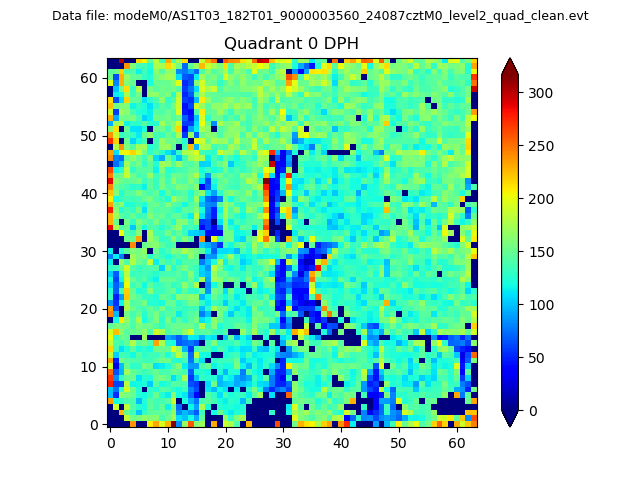 |
 |
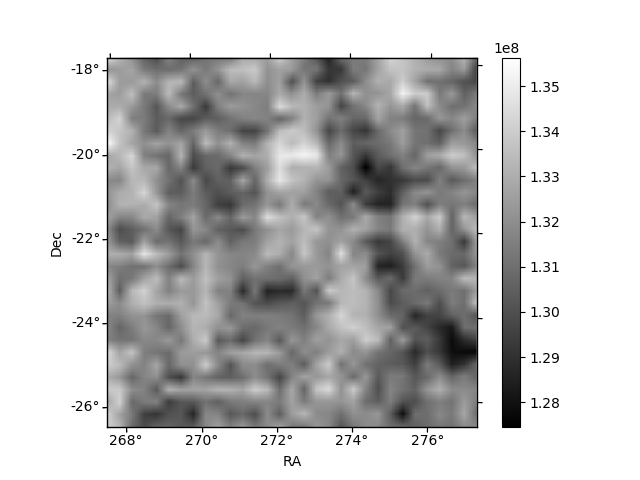
Quadrant B |
|---|---|---|---|
| Quadrant D |  |
 |
Quadrant C |
| Plot type | Count rate plots | Images |
|---|---|---|
| Comparison with Poisson distribution Blue bars denote a histogram of data divided into 1 sec bins. Red curve is a Poisson curve with rate = median count rate of data. |
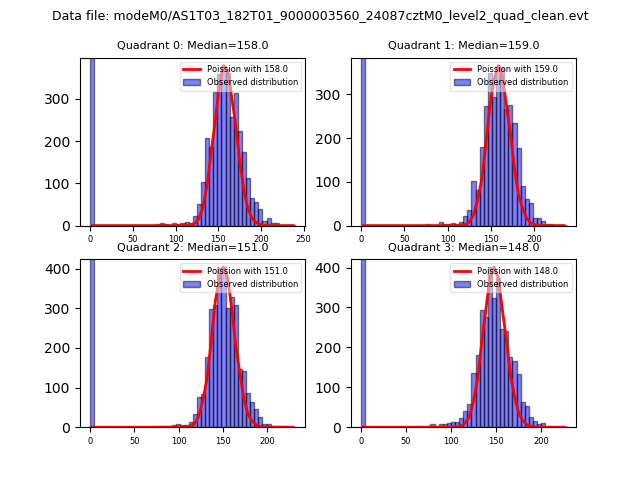 |
 |
| Quadrant-wise count rates Data is divided into 100 sec bins |
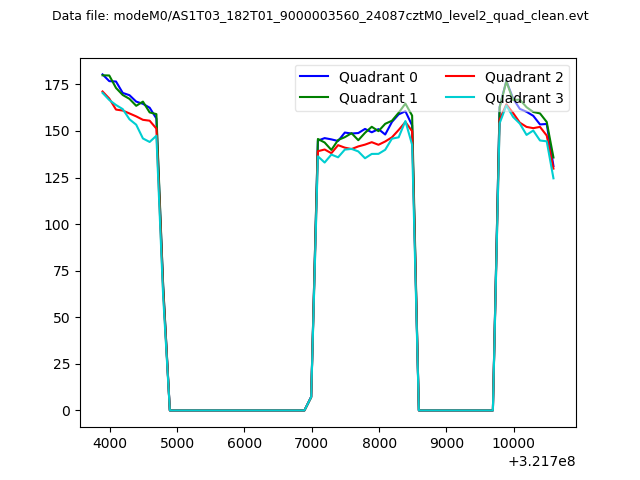 |
|
| Module-wise count rates for Quadrant A Data is divided into 100 sec bins |
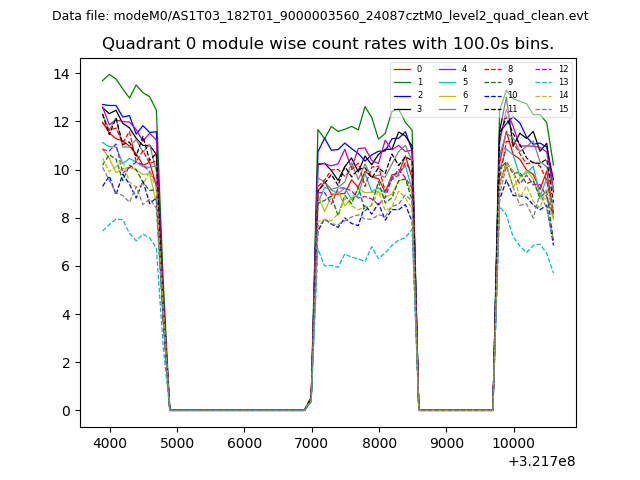 |
 |
| Module-wise count rates for Quadrant B Data is divided into 100 sec bins |
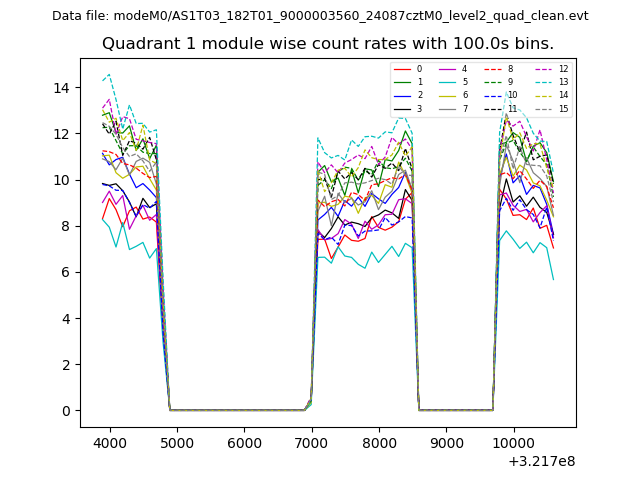 |
 |
| Module-wise count rates for Quadrant C Data is divided into 100 sec bins |
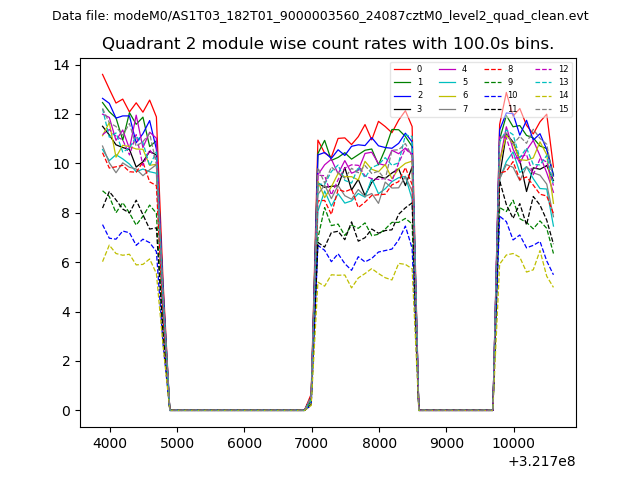 |
 |
| Module-wise count rates for Quadrant D Data is divided into 100 sec bins |
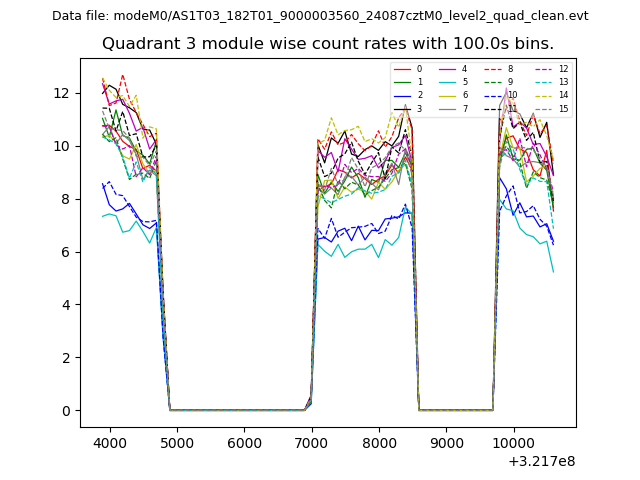 |
 |
| Parameter | Plot |
|---|---|
| CZT HV Monitor | 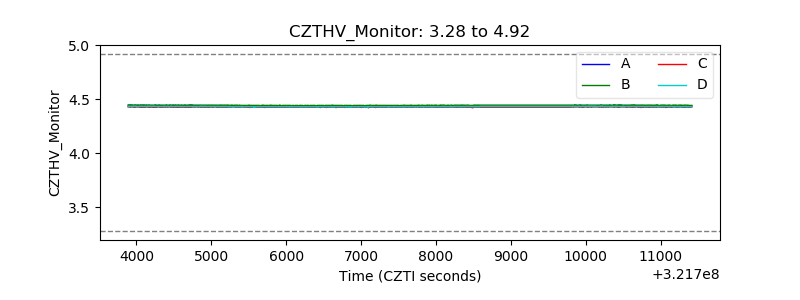 |
| D_VDD | 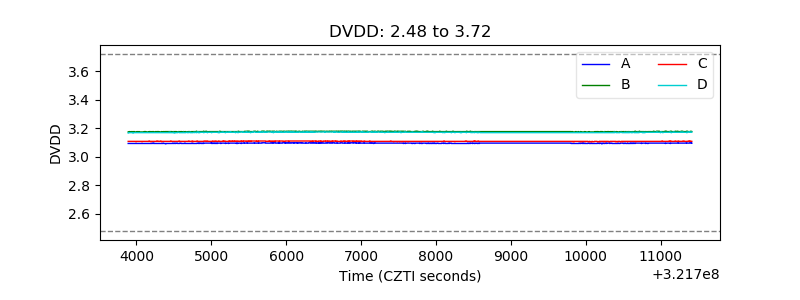 |
| Temperature 1 |  |
| Veto HV Monitor | 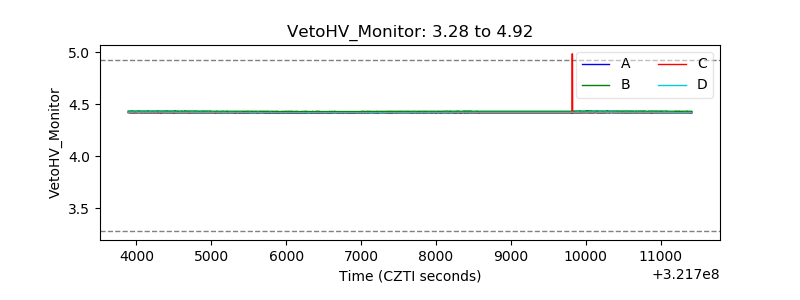 |
| Veto LLD | 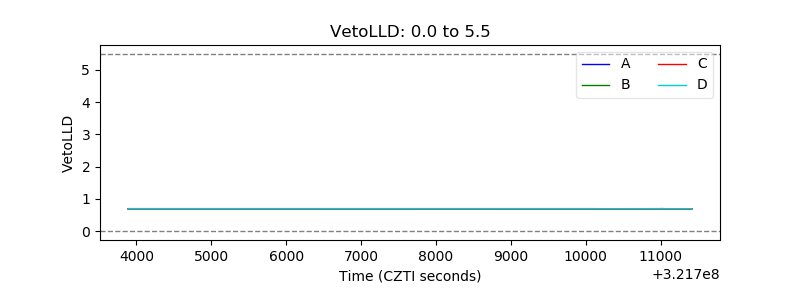 |
| Alpha Counter | 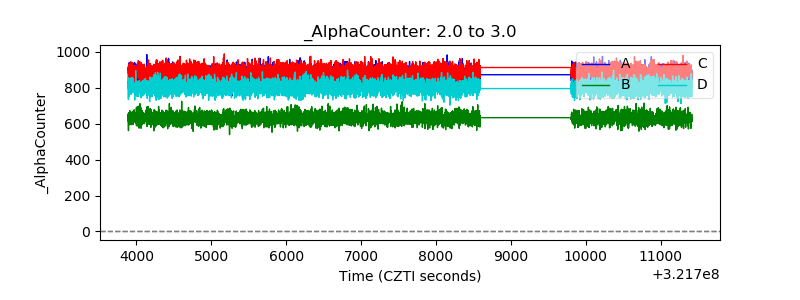 |
| _CPM_Rate | 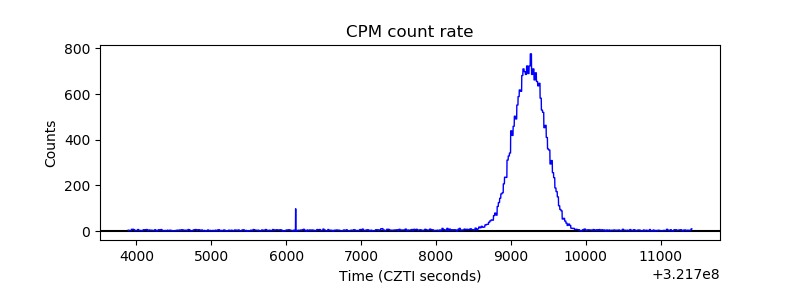 |
| CZT Counter | 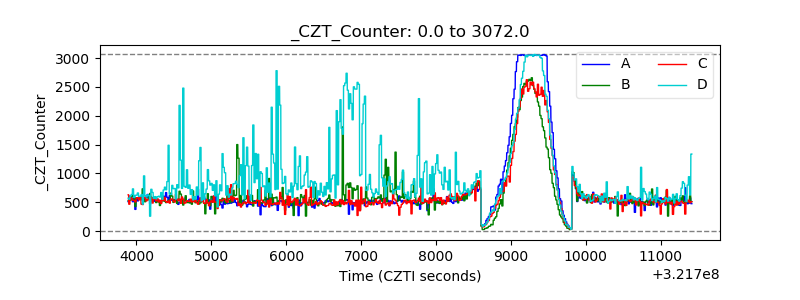 |
| +2.5 Volts monitor | 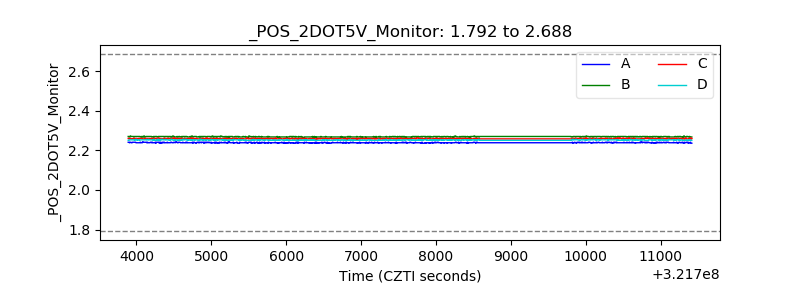 |
| +5 Volts monitor |  |
| _ROLL_ROT | 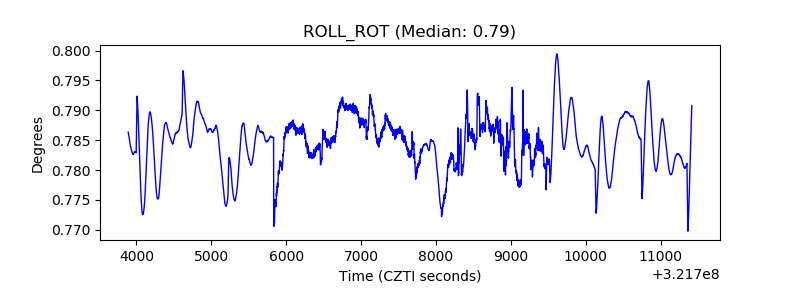 |
| _Roll_DEC | 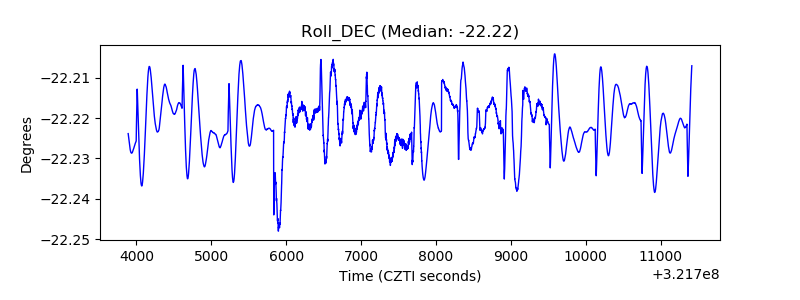 |
| _Roll_RA | 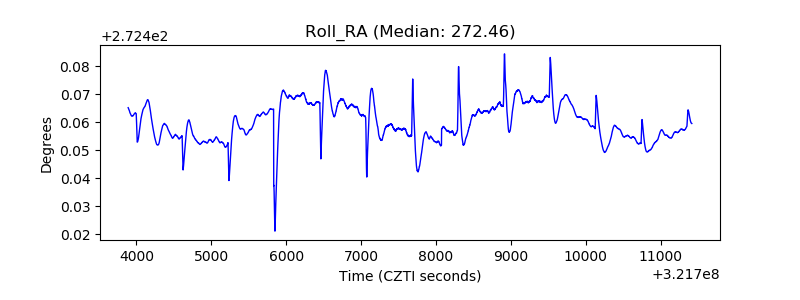 |
| Veto Counter | 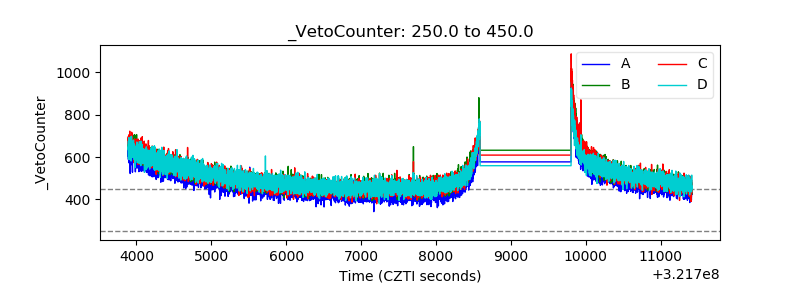 |