| Param | Original file | Final file |
|---|---|---|
| Filename | modeM0/AS1T03_182T01_9000003560_24088cztM0_level2.evt | modeM0/AS1T03_182T01_9000003560_24088cztM0_level2_quad_clean.evt |
| Size (bytes) | 525,323,520 | 71,789,760 |
| Size | 501.0 MB | 68.5 MB |
| Events in quadrant A | 3,317,027 | 439,476 |
| Events in quadrant B | 3,733,396 | 444,386 |
| Events in quadrant C | 3,334,474 | 424,842 |
| Events in quadrant D | 5,085,462 | 413,477 |
| Mode SS | |||
|---|---|---|---|
| Quadrant | BADHDUFLAG | Total packets | Discarded packets |
| A | 0 | 132 | 0 |
| B | 0 | 132 | 0 |
| C | 0 | 132 | 0 |
| D | 0 | 132 | 0 |
| Mode M9 | |||
|---|---|---|---|
| Quadrant | BADHDUFLAG | Total packets | Discarded packets |
| A | 0 | 9 | 0 |
| B | 0 | 9 | 0 |
| C | 0 | 9 | 0 |
| D | 0 | 9 | 0 |
| Mode M0 | |||
|---|---|---|---|
| Quadrant | BADHDUFLAG | Total packets | Discarded packets |
| A | 0 | 13450 | 1 |
| B | 0 | 14851 | 2 |
| C | 0 | 13427 | 1 |
| D | 0 | 19485 | 1 |
| Quadrant | Total seconds | Saturated seconds | Saturation percentage |
|---|---|---|---|
| A | 6472 | 143 | 2.209518% |
| B | 6472 | 189 | 2.920272% |
| C | 6472 | 166 | 2.564895% |
| D | 6472 | 325 | 5.021632% |
Noise dominated data is calculated using 1-second bins in cleaned event files. If a bin has >2000 counts, and if more than 50% of those come from <1% of pixels, then it is considered to be noise-dominated and hence unusable.
| Quadrant | # 1 sec bins | Bins with >0 counts | Bins with >2000 counts | High rate bins dominated by noise | Noise dominated (total time) | Noise dominated (detector-on time) | Marked lightcurve |
|---|---|---|---|---|---|---|---|
| A | 7397 | 6472 | 0 | 0 | 0.00% | 0.00% | 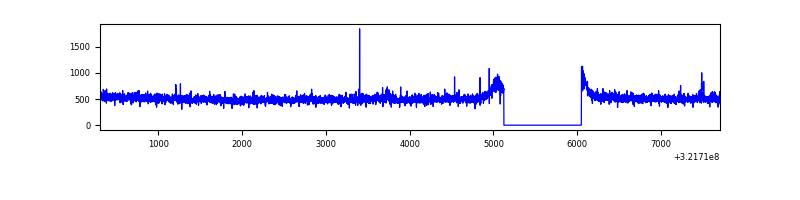 |
| B | 7397 | 6472 | 22 | 22 | 0.30% | 0.34% | 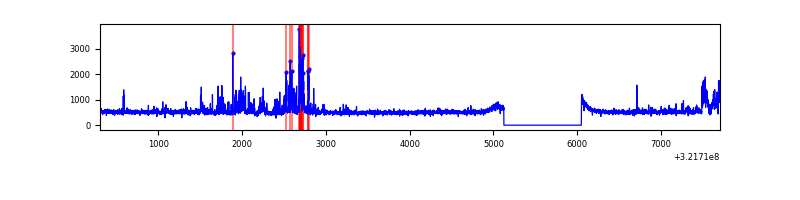 |
| C | 7397 | 6472 | 0 | 0 | 0.00% | 0.00% | 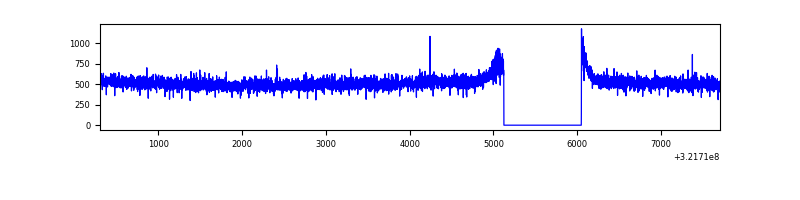 |
| D | 7397 | 6472 | 170 | 170 | 2.30% | 2.63% | 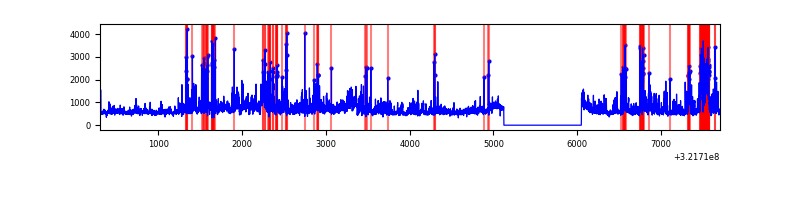 |
Top three noisy pixels from each quadrant. If the there are fewer than three noisy pixels in the level2.evt file, extra rows are filled as -1
| Pixel properties | Quadrant properties | ||||||
|---|---|---|---|---|---|---|---|
| Quadrant | DetID | PixID | Counts | Sigma | Mean | Median | Sigma |
| A | 2 | 250 | 38268 | 217.75 | 849 | 832 | 171.9 |
| A | 13 | 254 | 10684 | 57.3 | 849 | 832 | 171.9 |
| A | 0 | 226 | 7475 | 38.64 | 849 | 832 | 171.9 |
| B | 0 | 189 | 279273 | 1752.99 | 833 | 811 | 158.9 |
| B | 0 | 229 | 64015 | 397.88 | 833 | 811 | 158.9 |
| B | 15 | 33 | 52667 | 326.45 | 833 | 811 | 158.9 |
| C | 14 | 238 | 127917 | 671.98 | 806 | 810 | 189.2 |
| C | 7 | 247 | 65173 | 340.27 | 806 | 810 | 189.2 |
| C | 13 | 61 | 5534 | 24.97 | 806 | 810 | 189.2 |
| D | 1 | 52 | 858013 | 4302.98 | 817 | 792 | 199.2 |
| D | 8 | 195 | 573700 | 2875.82 | 817 | 792 | 199.2 |
| D | 12 | 218 | 270228 | 1352.49 | 817 | 792 | 199.2 |
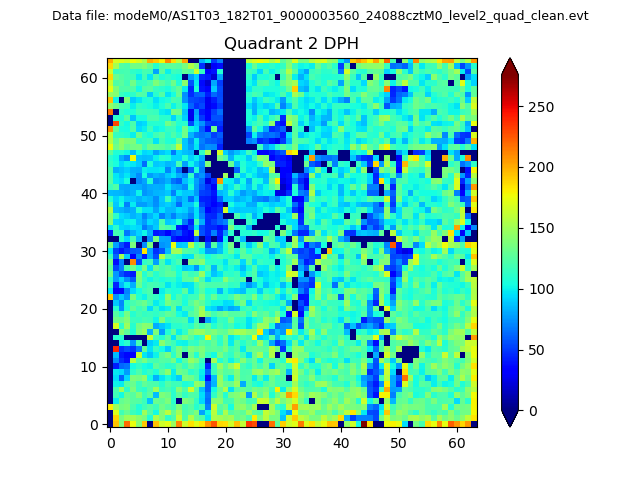
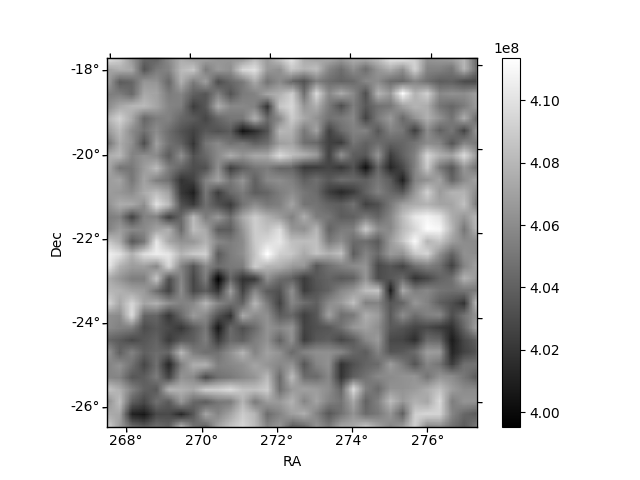
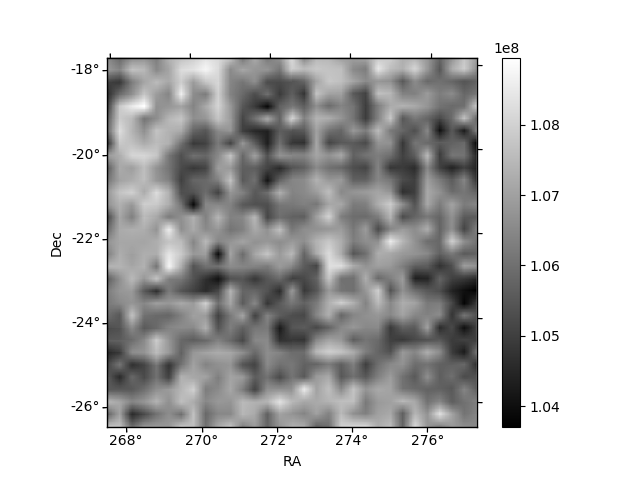
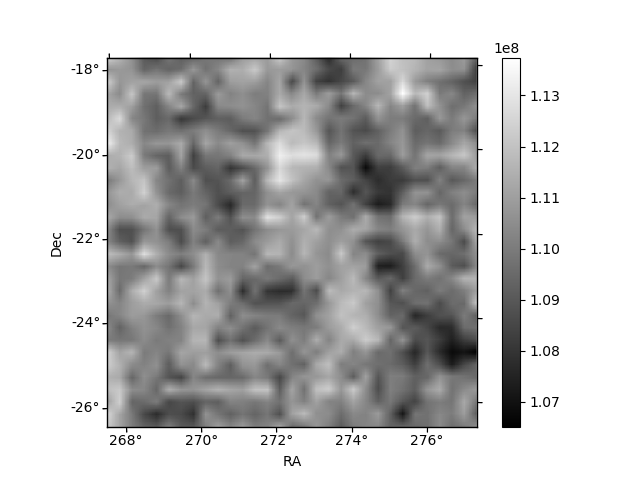
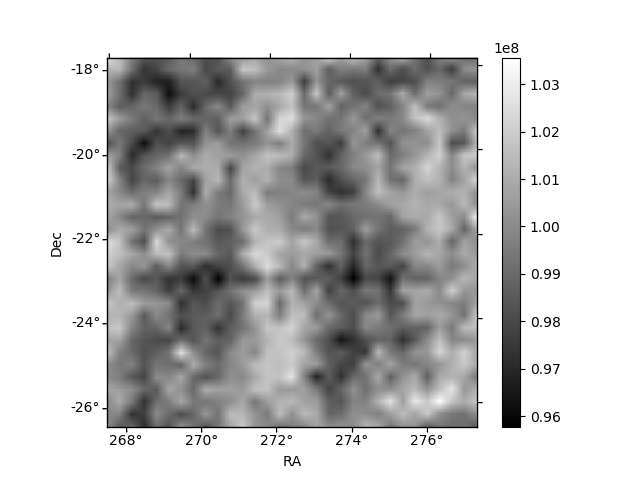
Histogram calculated using DETX and DETY for each event in the final _common_clean file
| Quadrant A | 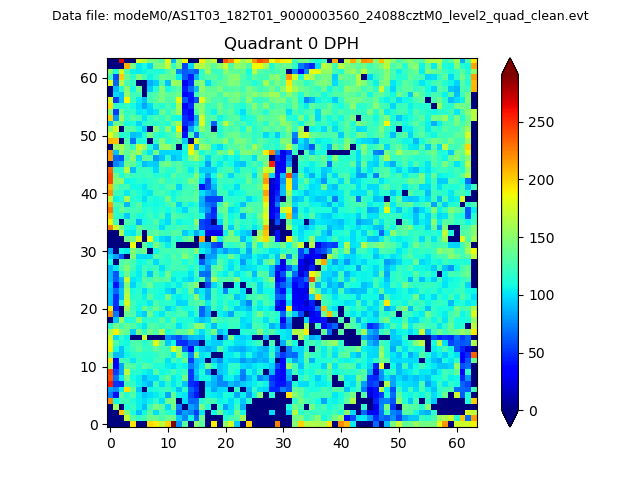 |
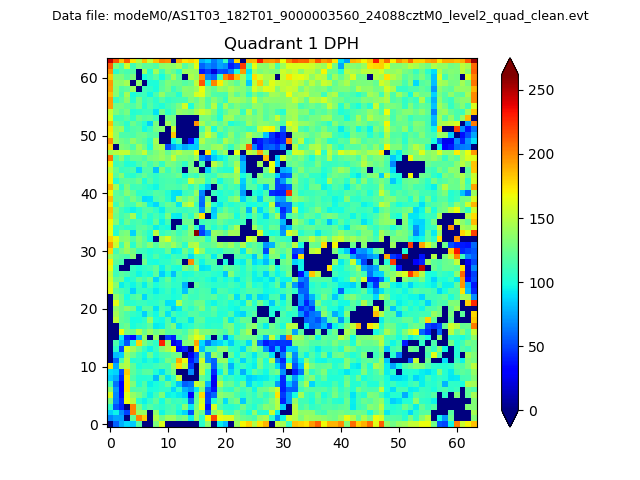 |
Quadrant B |
|---|---|---|---|
| Quadrant D | 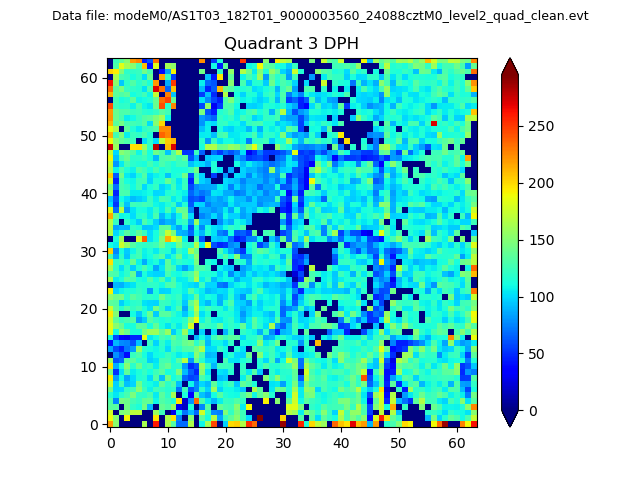 |
 |
Quadrant C |
| Plot type | Count rate plots | Images |
|---|---|---|
| Comparison with Poisson distribution Blue bars denote a histogram of data divided into 1 sec bins. Red curve is a Poisson curve with rate = median count rate of data. |
 |
 |
| Quadrant-wise count rates Data is divided into 100 sec bins |
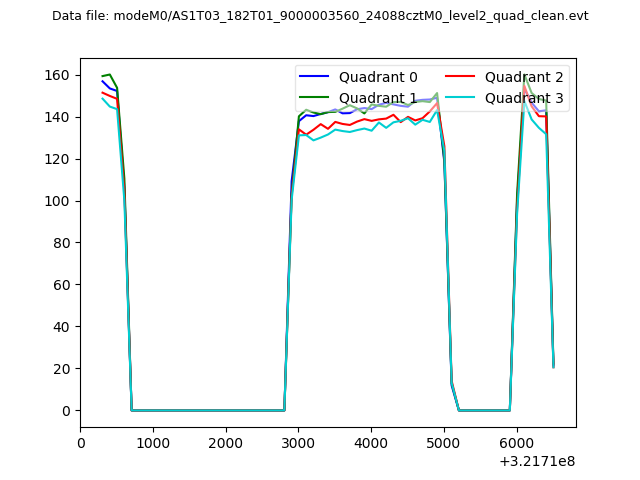 |
|
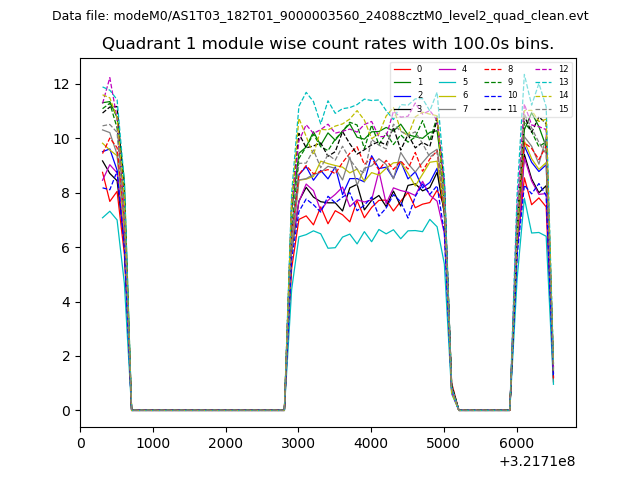
| Module-wise count rates for Quadrant A Data is divided into 100 sec bins |
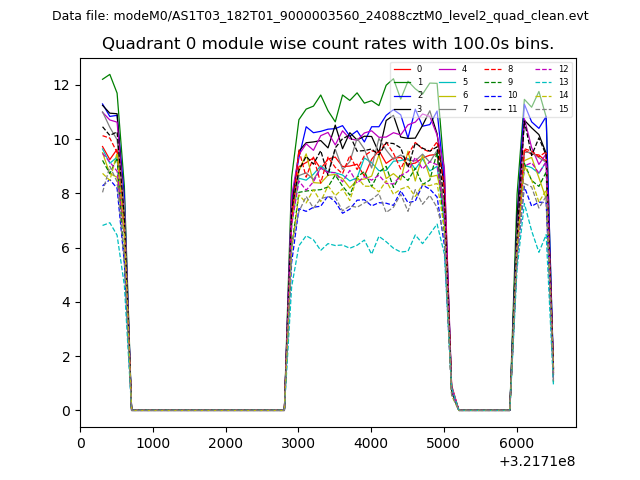 |
 |
| Module-wise count rates for Quadrant B Data is divided into 100 sec bins |
 |
 |
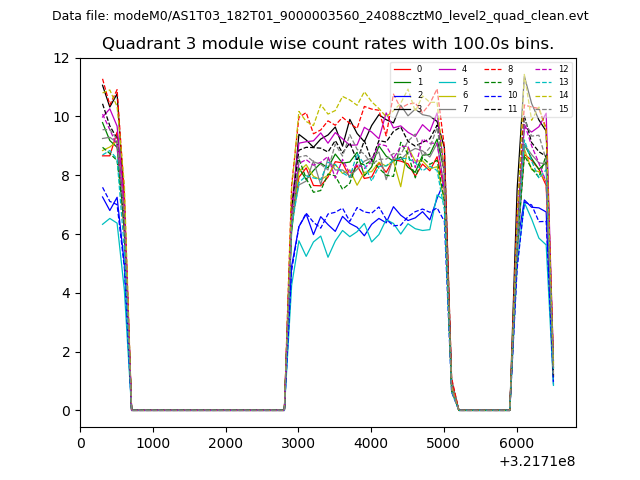
| Module-wise count rates for Quadrant C Data is divided into 100 sec bins |
 |
 |
| Module-wise count rates for Quadrant D Data is divided into 100 sec bins |
 |
 |
| Parameter | Plot |
|---|---|
| CZT HV Monitor |  |
| D_VDD | 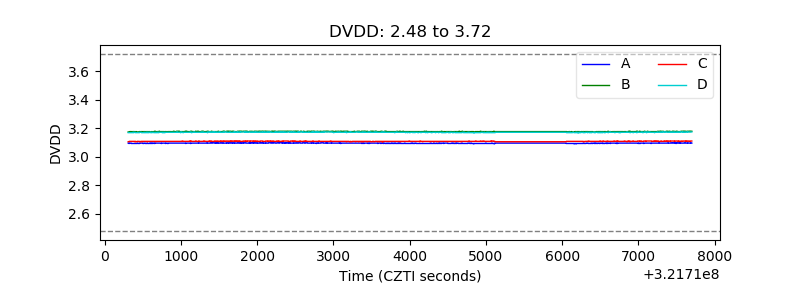 |
| Temperature 1 | 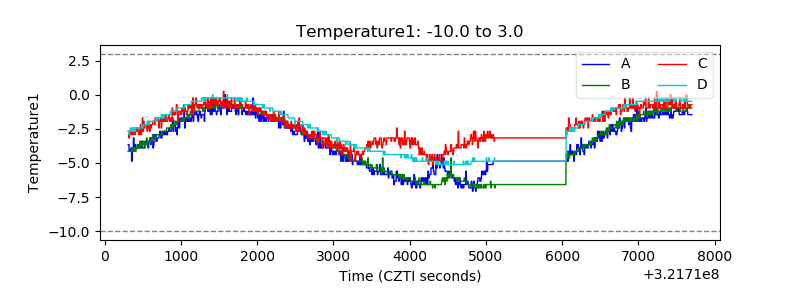 |
| Veto HV Monitor | 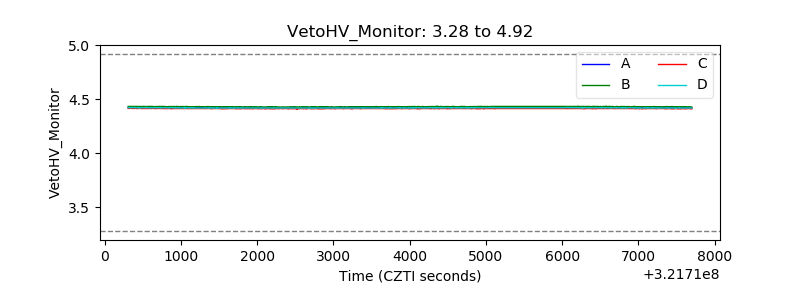 |
| Veto LLD | 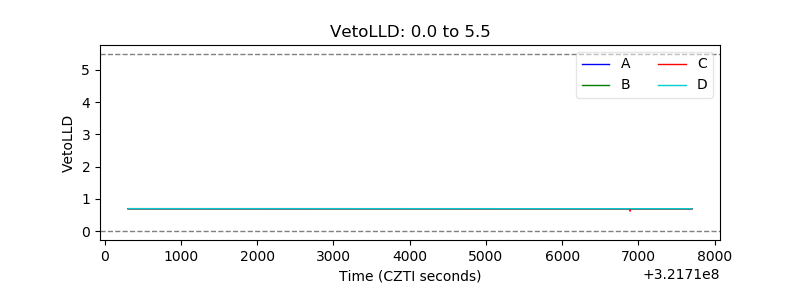 |
| Alpha Counter | 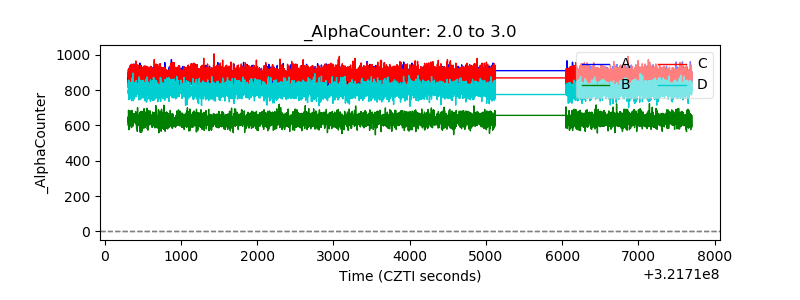 |
| _CPM_Rate | 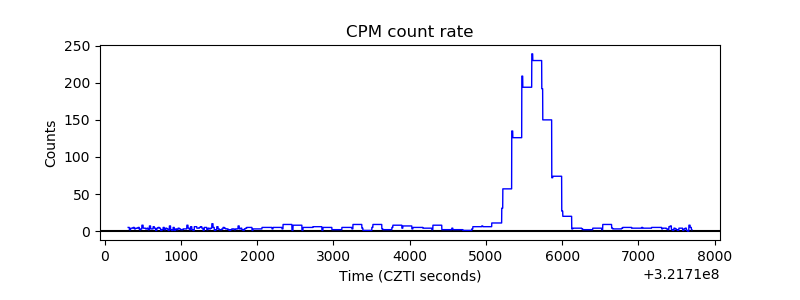 |
| CZT Counter | 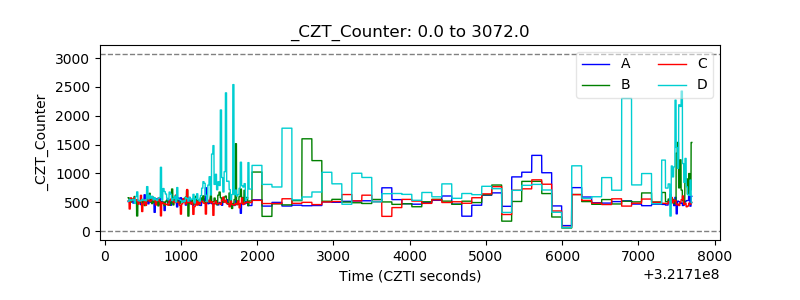 |
| +2.5 Volts monitor |  |
| +5 Volts monitor |  |
| _ROLL_ROT | 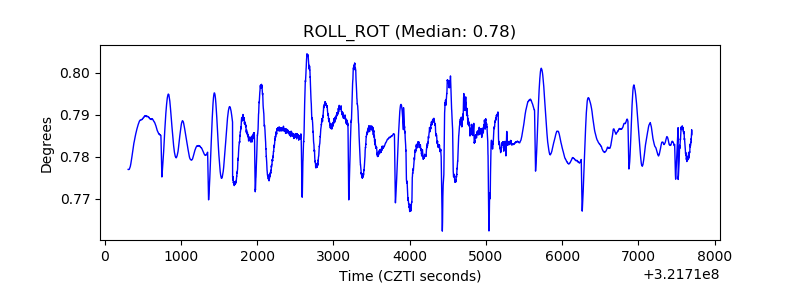 |
| _Roll_DEC | 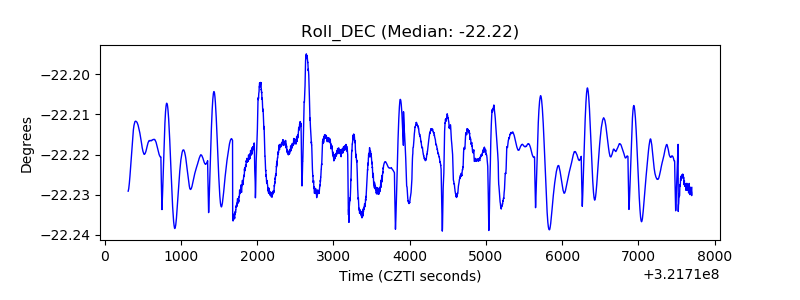 |
| _Roll_RA | 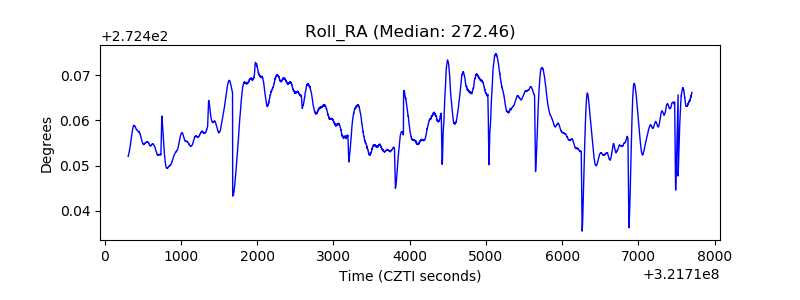 |
| Veto Counter |  |