| Param | Original file | Final file |
|---|---|---|
| Filename | modeM0/AS1T03_182T01_9000003560_24089cztM0_level2.evt | modeM0/AS1T03_182T01_9000003560_24089cztM0_level2_quad_clean.evt |
| Size (bytes) | 586,558,080 | 77,768,640 |
| Size | 559.4 MB | 74.2 MB |
| Events in quadrant A | 3,609,404 | 474,712 |
| Events in quadrant B | 3,949,057 | 477,196 |
| Events in quadrant C | 3,652,957 | 457,249 |
| Events in quadrant D | 6,065,918 | 445,521 |
| Mode SS | |||
|---|---|---|---|
| Quadrant | BADHDUFLAG | Total packets | Discarded packets |
| A | 0 | 146 | 0 |
| B | 0 | 146 | 0 |
| C | 0 | 146 | 0 |
| D | 0 | 146 | 0 |
| Mode M9 | |||
|---|---|---|---|
| Quadrant | BADHDUFLAG | Total packets | Discarded packets |
| A | 0 | 5 | 0 |
| B | 0 | 5 | 0 |
| C | 0 | 5 | 0 |
| D | 0 | 5 | 0 |
| Mode M0 | |||
|---|---|---|---|
| Quadrant | BADHDUFLAG | Total packets | Discarded packets |
| A | 0 | 14984 | 1 |
| B | 0 | 15977 | 1 |
| C | 0 | 14994 | 1 |
| D | 0 | 22963 | 5 |
| Quadrant | Total seconds | Saturated seconds | Saturation percentage |
|---|---|---|---|
| A | 7178 | 140 | 1.950404% |
| B | 7179 | 168 | 2.340159% |
| C | 7179 | 170 | 2.368018% |
| D | 7178 | 495 | 6.896071% |
Noise dominated data is calculated using 1-second bins in cleaned event files. If a bin has >2000 counts, and if more than 50% of those come from <1% of pixels, then it is considered to be noise-dominated and hence unusable.
| Quadrant | # 1 sec bins | Bins with >0 counts | Bins with >2000 counts | High rate bins dominated by noise | Noise dominated (total time) | Noise dominated (detector-on time) | Marked lightcurve |
|---|---|---|---|---|---|---|---|
| A | 7738 | 7178 | 0 | 0 | 0.00% | 0.00% | 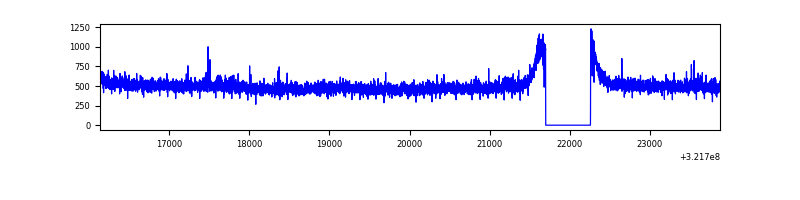 |
| B | 7739 | 7179 | 7 | 7 | 0.09% | 0.10% | 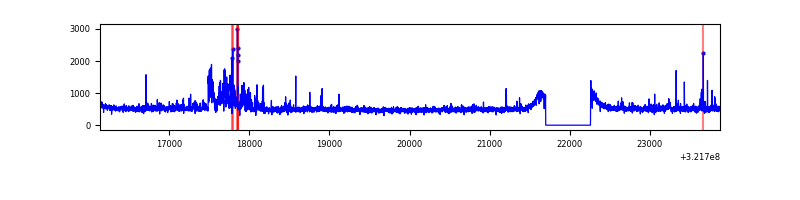 |
| C | 7739 | 7179 | 2 | 2 | 0.03% | 0.03% | 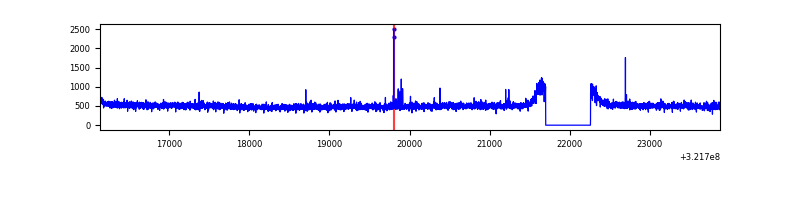 |
| D | 7737 | 7177 | 328 | 328 | 4.24% | 4.57% | 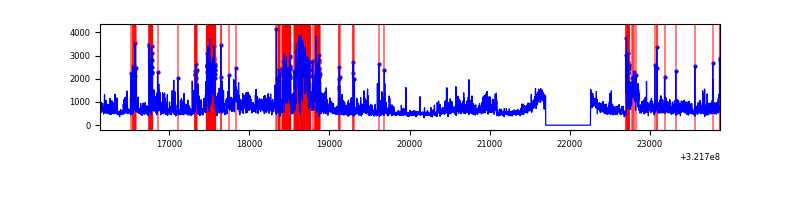 |
Top three noisy pixels from each quadrant. If the there are fewer than three noisy pixels in the level2.evt file, extra rows are filled as -1
| Pixel properties | Quadrant properties | ||||||
|---|---|---|---|---|---|---|---|
| Quadrant | DetID | PixID | Counts | Sigma | Mean | Median | Sigma |
| A | 2 | 250 | 32897 | 170.48 | 925 | 904 | 187.7 |
| A | 13 | 254 | 11574 | 56.86 | 925 | 904 | 187.7 |
| A | 3 | 1 | 9420 | 45.38 | 925 | 904 | 187.7 |
| B | 0 | 197 | 129461 | 732.26 | 911 | 888 | 175.6 |
| B | 0 | 189 | 84776 | 477.77 | 911 | 888 | 175.6 |
| B | 0 | 229 | 81489 | 459.05 | 911 | 888 | 175.6 |
| C | 14 | 238 | 137831 | 656.66 | 881 | 888 | 208.5 |
| C | 7 | 247 | 60640 | 286.52 | 881 | 888 | 208.5 |
| C | 0 | 239 | 20908 | 96.0 | 881 | 888 | 208.5 |
| D | 1 | 52 | 900545 | 4169.61 | 884 | 858 | 215.8 |
| D | 12 | 218 | 578430 | 2676.76 | 884 | 858 | 215.8 |
| D | 8 | 195 | 574699 | 2659.47 | 884 | 858 | 215.8 |
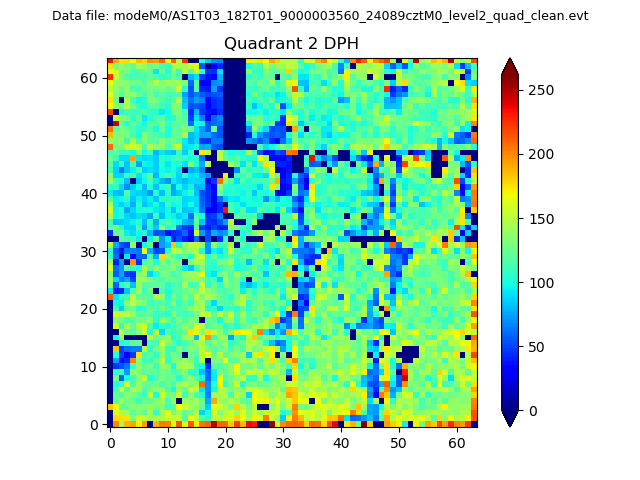
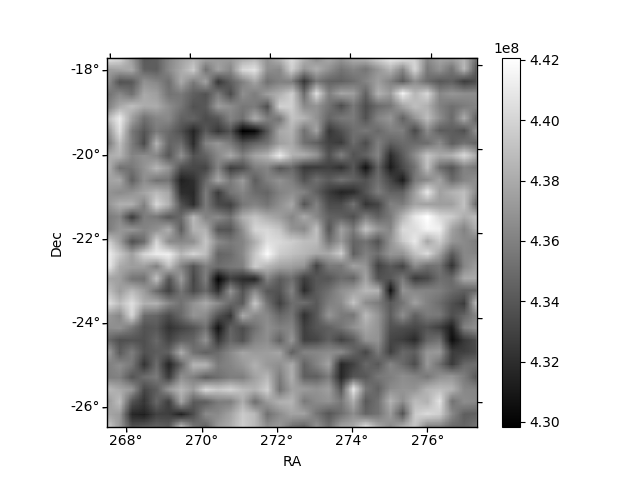
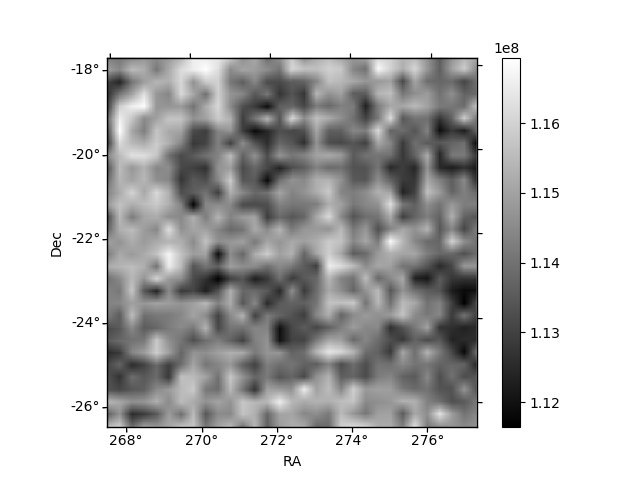
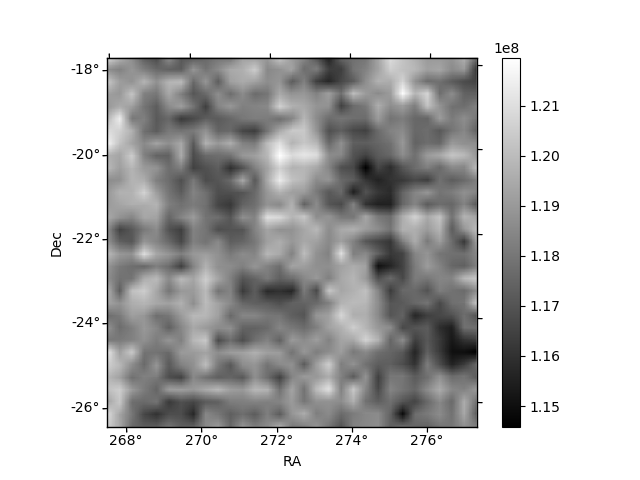
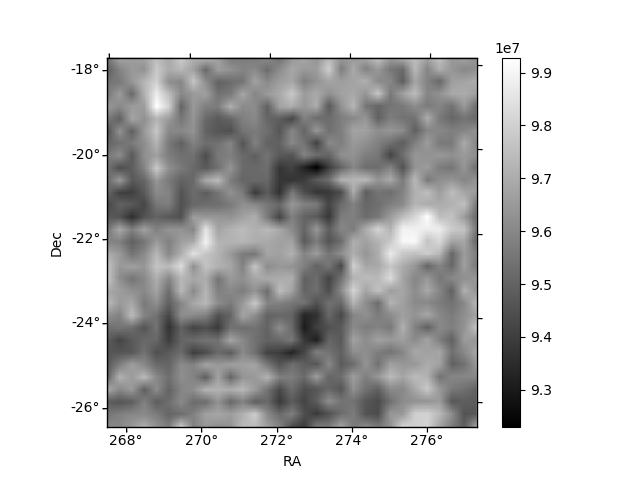
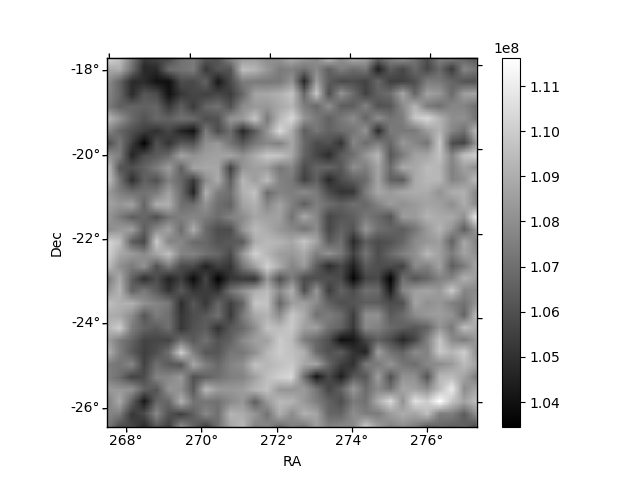
Histogram calculated using DETX and DETY for each event in the final _common_clean file
| Quadrant A | 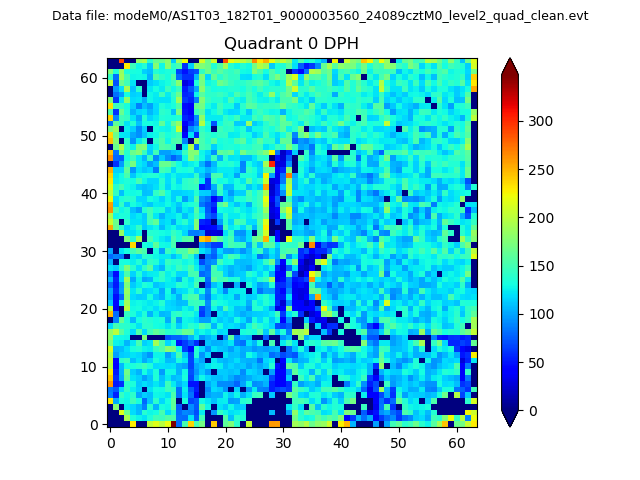 |
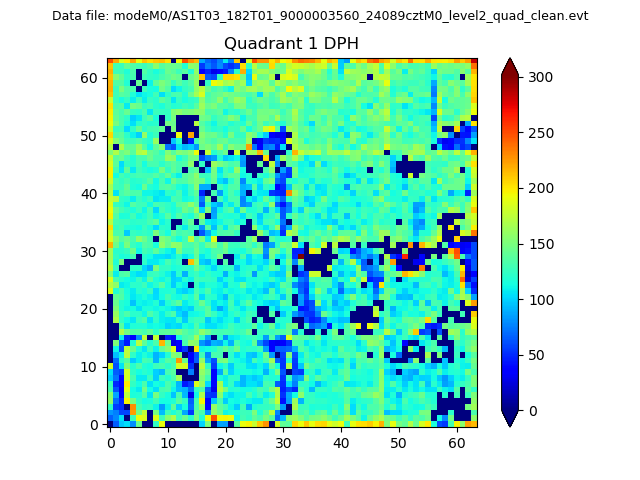 |
Quadrant B |
|---|---|---|---|
| Quadrant D | 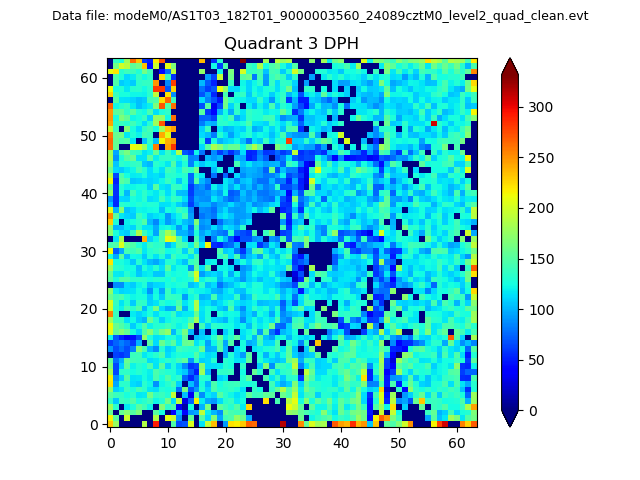 |
 |
Quadrant C |
| Plot type | Count rate plots | Images |
|---|---|---|
| Comparison with Poisson distribution Blue bars denote a histogram of data divided into 1 sec bins. Red curve is a Poisson curve with rate = median count rate of data. |
 |
 |
| Quadrant-wise count rates Data is divided into 100 sec bins |
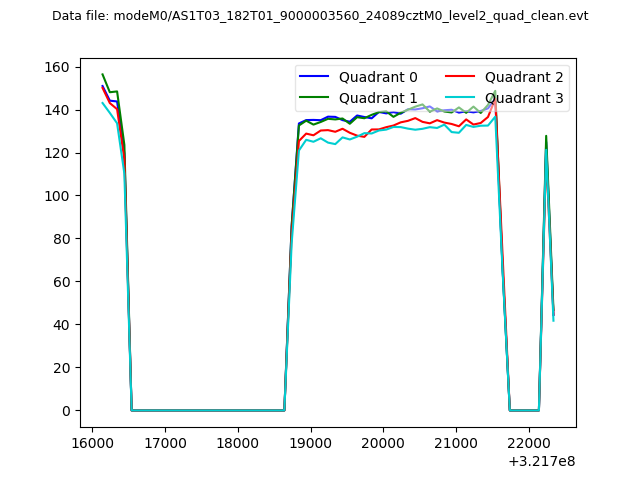 |
|
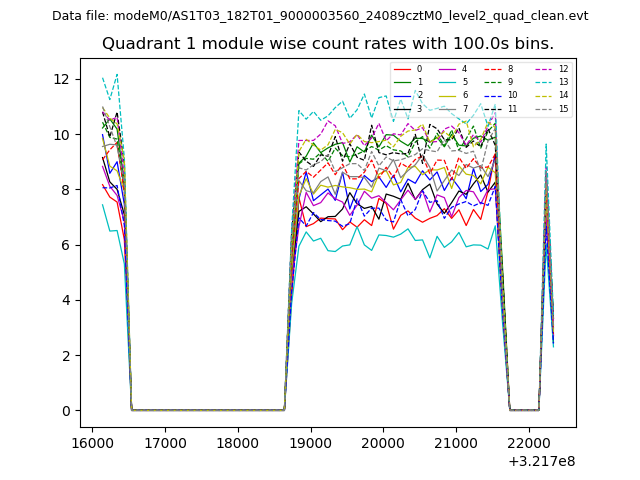
| Module-wise count rates for Quadrant A Data is divided into 100 sec bins |
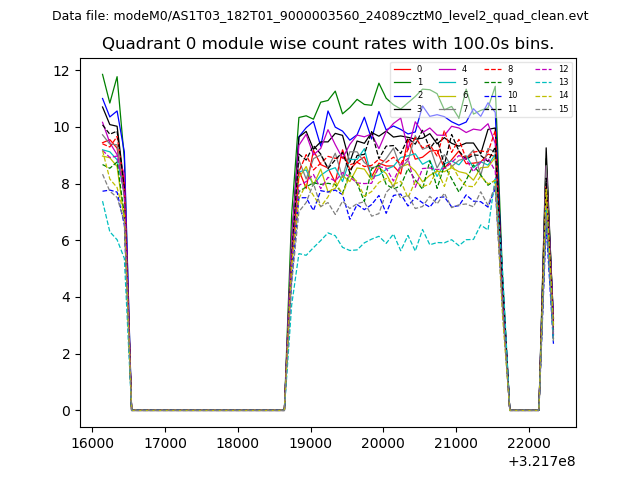 |
 |
| Module-wise count rates for Quadrant B Data is divided into 100 sec bins |
 |
 |
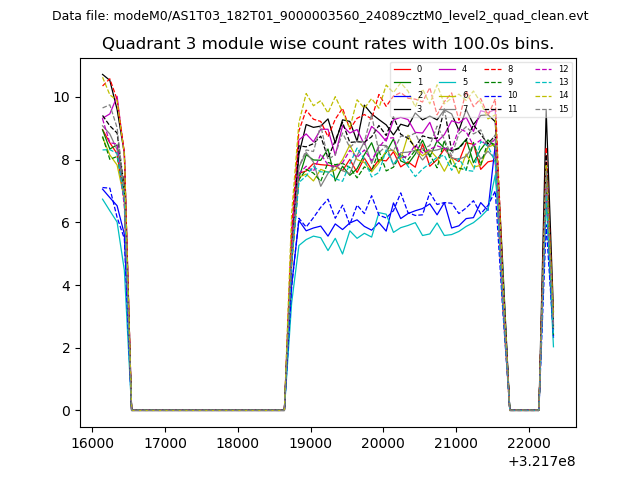
| Module-wise count rates for Quadrant C Data is divided into 100 sec bins |
 |
 |
| Module-wise count rates for Quadrant D Data is divided into 100 sec bins |
 |
 |
| Parameter | Plot |
|---|---|
| CZT HV Monitor | 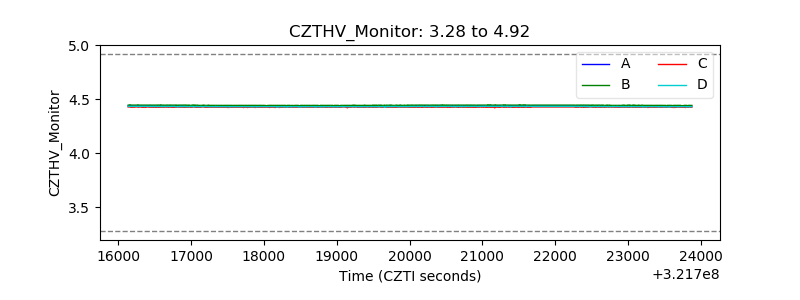 |
| D_VDD | 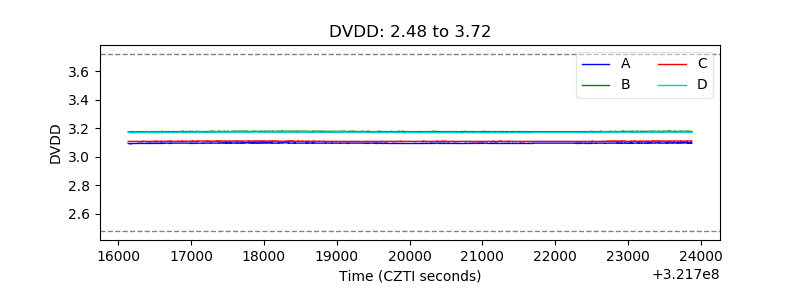 |
| Temperature 1 | 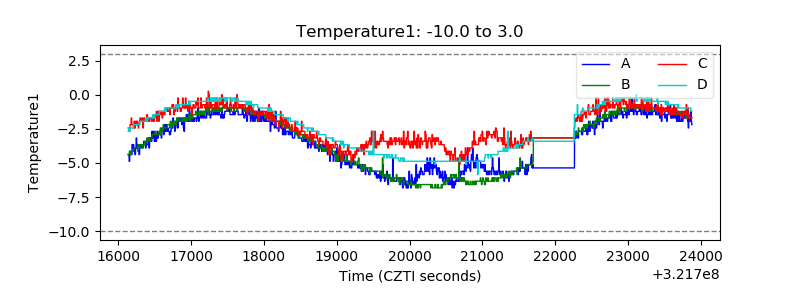 |
| Veto HV Monitor |  |
| Veto LLD | 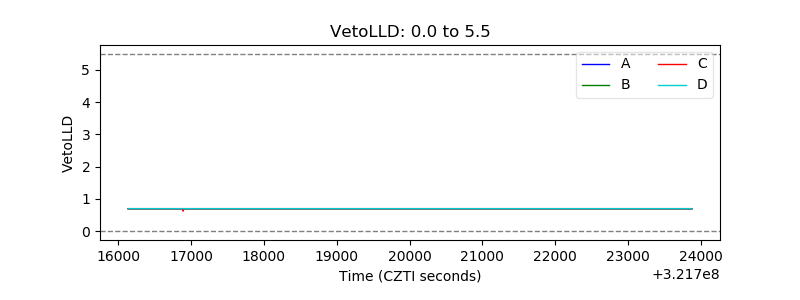 |
| Alpha Counter | 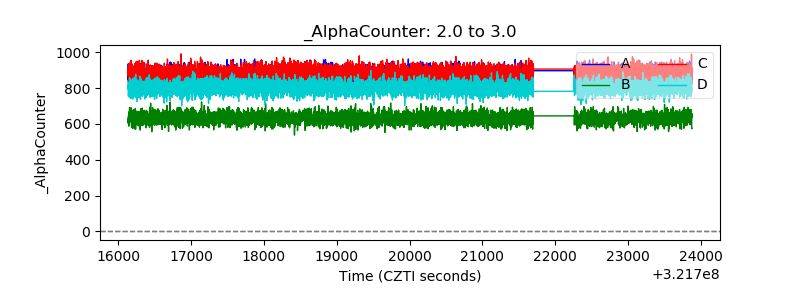 |
| _CPM_Rate | 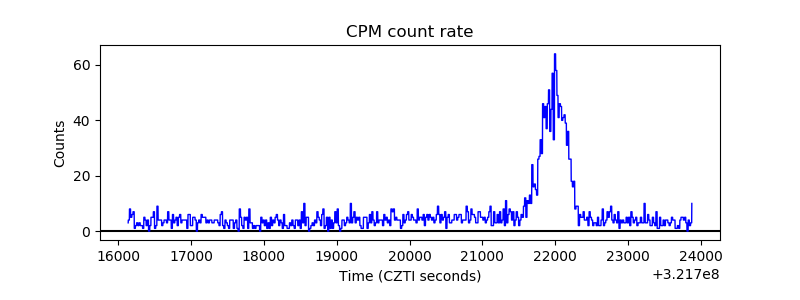 |
| CZT Counter | 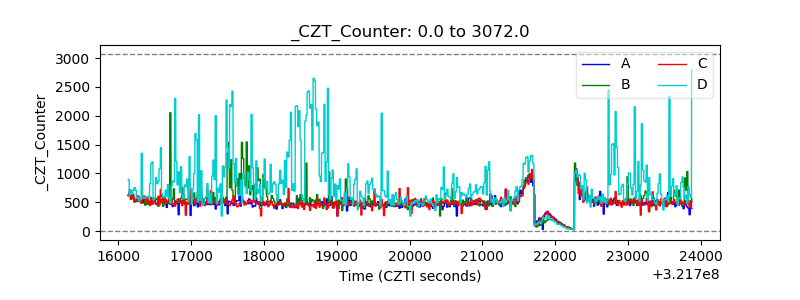 |
| +2.5 Volts monitor |  |
| +5 Volts monitor |  |
| _ROLL_ROT | 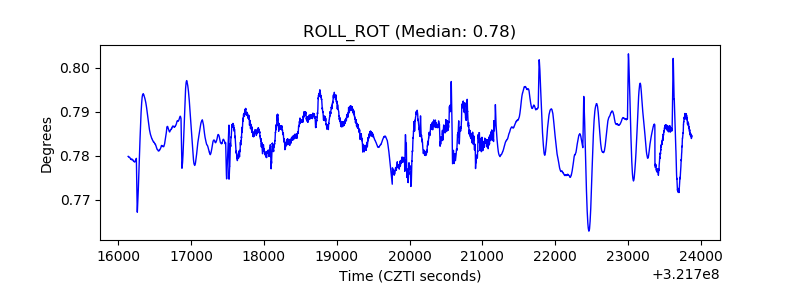 |
| _Roll_DEC | 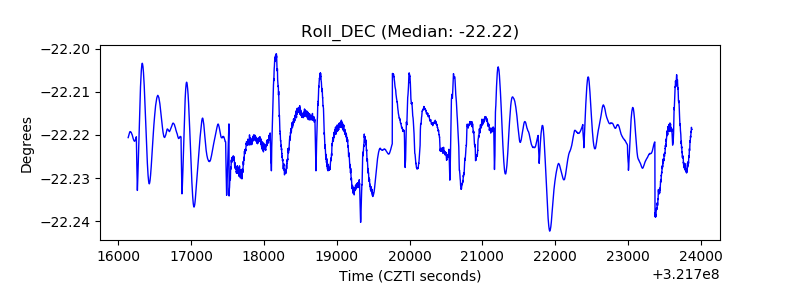 |
| _Roll_RA | 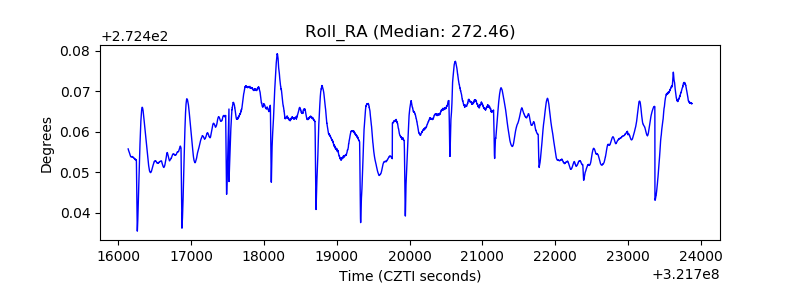 |
| Veto Counter |  |