| Param | Original file | Final file |
|---|---|---|
| Filename | modeM0/AS1T03_182T01_9000003560_24090cztM0_level2.evt | modeM0/AS1T03_182T01_9000003560_24090cztM0_level2_quad_clean.evt |
| Size (bytes) | 622,224,000 | 81,771,840 |
| Size | 593.4 MB | 78.0 MB |
| Events in quadrant A | 3,810,508 | 495,075 |
| Events in quadrant B | 4,048,994 | 500,082 |
| Events in quadrant C | 3,901,165 | 480,876 |
| Events in quadrant D | 6,566,288 | 468,968 |
| Mode SS | |||
|---|---|---|---|
| Quadrant | BADHDUFLAG | Total packets | Discarded packets |
| A | 0 | 156 | 0 |
| B | 0 | 156 | 0 |
| C | 0 | 156 | 0 |
| D | 0 | 156 | 0 |
| Mode M9 | |||
|---|---|---|---|
| Quadrant | BADHDUFLAG | Total packets | Discarded packets |
| A | 0 | 7 | 0 |
| B | 0 | 8 | 0 |
| C | 0 | 8 | 0 |
| D | 0 | 8 | 0 |
| Mode M0 | |||
|---|---|---|---|
| Quadrant | BADHDUFLAG | Total packets | Discarded packets |
| A | 0 | 16040 | 2 |
| B | 0 | 16719 | 2 |
| C | 0 | 16087 | 2 |
| D | 0 | 24745 | 4 |
| Quadrant | Total seconds | Saturated seconds | Saturation percentage |
|---|---|---|---|
| A | 7637 | 167 | 2.186723% |
| B | 7637 | 226 | 2.959277% |
| C | 7637 | 197 | 2.579547% |
| D | 7636 | 581 | 7.608696% |
Noise dominated data is calculated using 1-second bins in cleaned event files. If a bin has >2000 counts, and if more than 50% of those come from <1% of pixels, then it is considered to be noise-dominated and hence unusable.
| Quadrant | # 1 sec bins | Bins with >0 counts | Bins with >2000 counts | High rate bins dominated by noise | Noise dominated (total time) | Noise dominated (detector-on time) | Marked lightcurve |
|---|---|---|---|---|---|---|---|
| A | 7897 | 7638 | 0 | 0 | 0.00% | 0.00% | 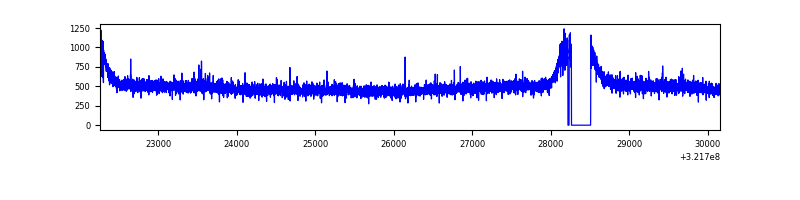 |
| B | 7897 | 7638 | 8 | 8 | 0.10% | 0.10% | 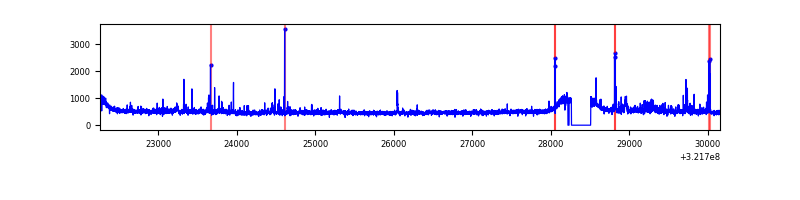 |
| C | 7897 | 7638 | 0 | 0 | 0.00% | 0.00% | 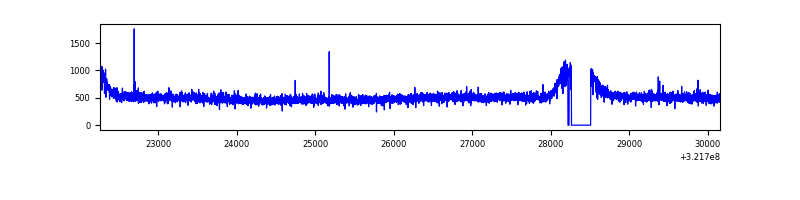 |
| D | 7896 | 7637 | 367 | 367 | 4.65% | 4.81% | 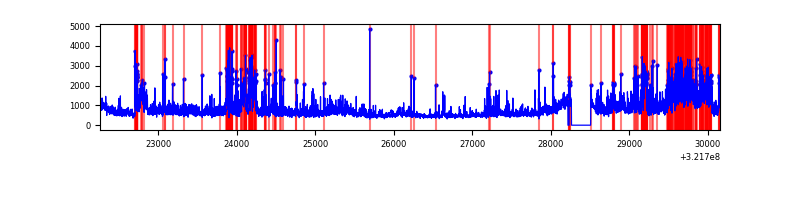 |
Top three noisy pixels from each quadrant. If the there are fewer than three noisy pixels in the level2.evt file, extra rows are filled as -1
| Pixel properties | Quadrant properties | ||||||
|---|---|---|---|---|---|---|---|
| Quadrant | DetID | PixID | Counts | Sigma | Mean | Median | Sigma |
| A | 2 | 250 | 16577 | 78.69 | 981 | 960 | 198.5 |
| A | 13 | 254 | 13309 | 62.23 | 981 | 960 | 198.5 |
| A | 3 | 1 | 10671 | 48.93 | 981 | 960 | 198.5 |
| B | 0 | 229 | 78942 | 415.44 | 970 | 943 | 187.8 |
| B | 0 | 189 | 63996 | 335.83 | 970 | 943 | 187.8 |
| B | 5 | 172 | 26055 | 133.75 | 970 | 943 | 187.8 |
| C | 14 | 238 | 144178 | 645.95 | 935 | 942 | 221.7 |
| C | 7 | 247 | 78237 | 348.58 | 935 | 942 | 221.7 |
| C | 10 | 91 | 18818 | 80.62 | 935 | 942 | 221.7 |
| D | 1 | 52 | 1092581 | 4771.31 | 937 | 911 | 228.8 |
| D | 8 | 195 | 761905 | 3326.04 | 937 | 911 | 228.8 |
| D | 12 | 218 | 711422 | 3105.4 | 937 | 911 | 228.8 |
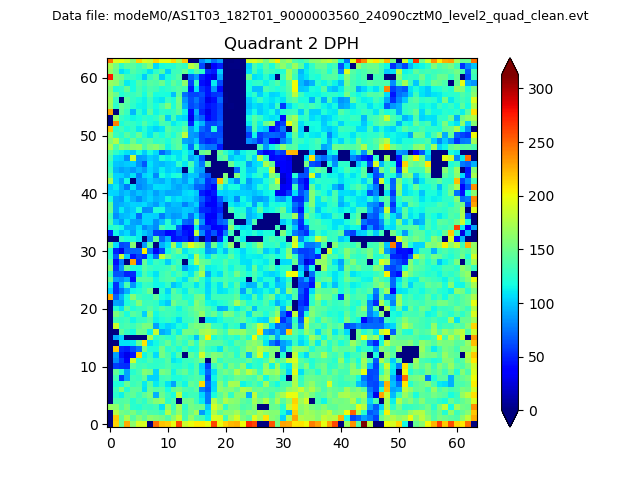
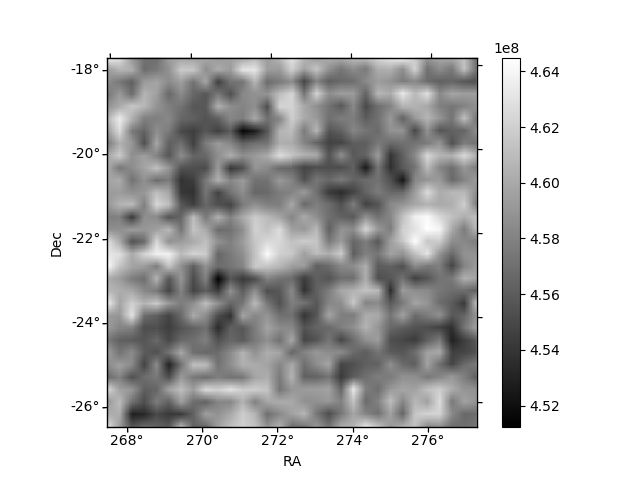
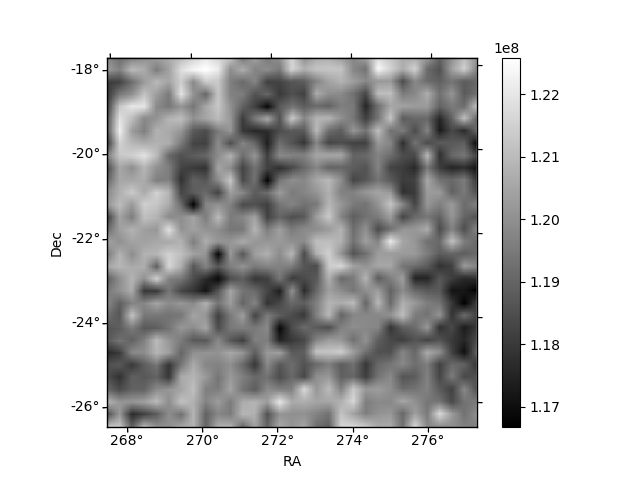
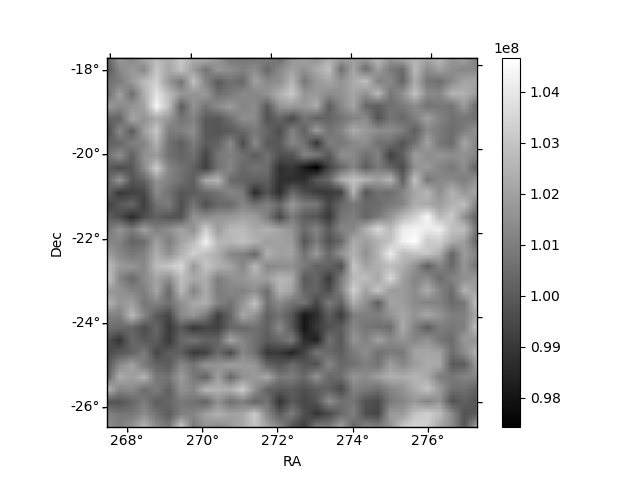
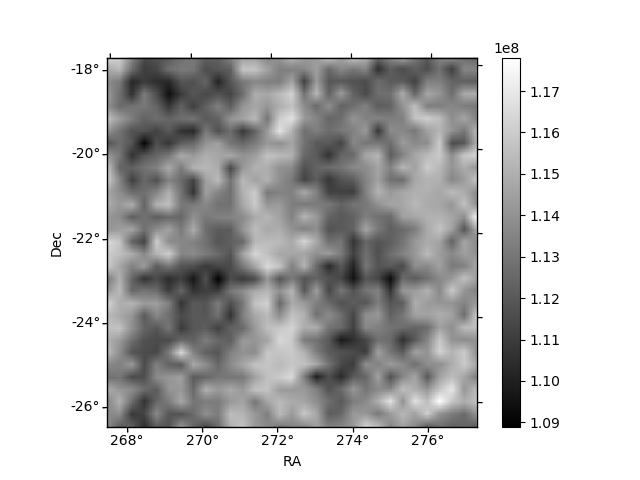
Histogram calculated using DETX and DETY for each event in the final _common_clean file
| Quadrant A | 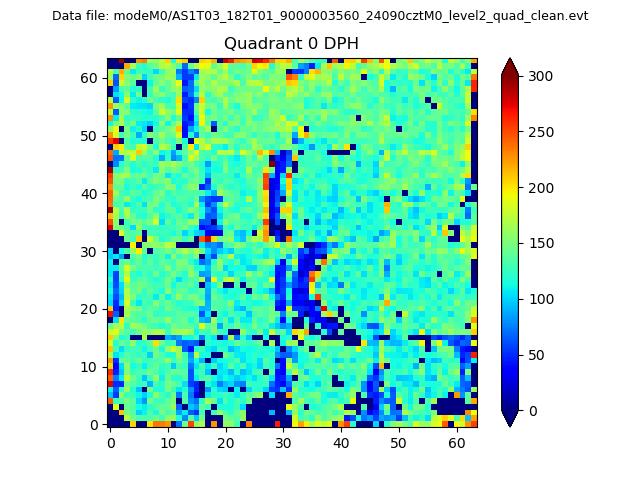 |
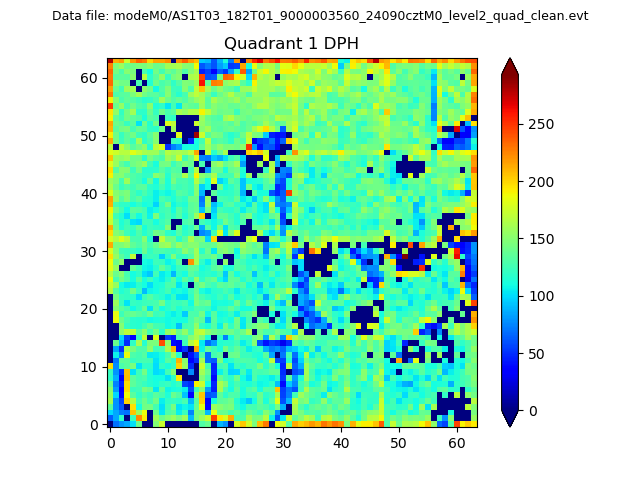 |
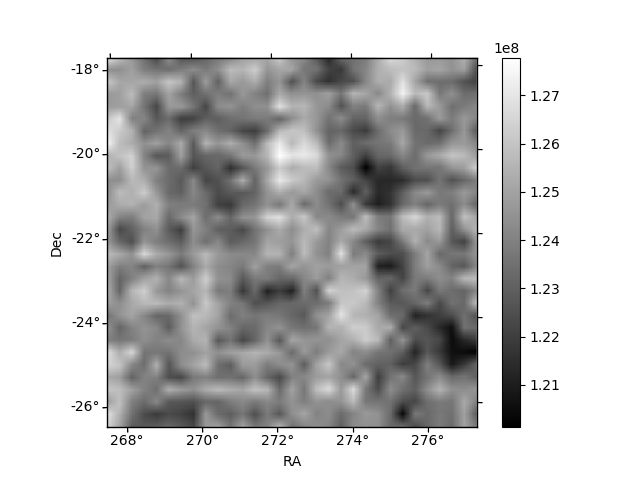
Quadrant B |
|---|---|---|---|
| Quadrant D | 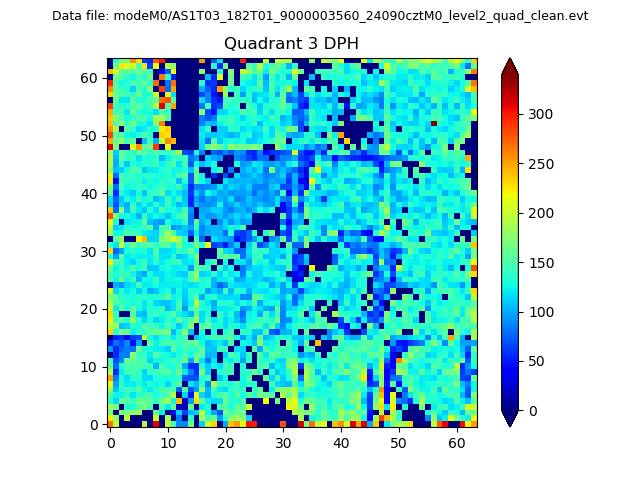 |
 |
Quadrant C |
| Plot type | Count rate plots | Images |
|---|---|---|
| Comparison with Poisson distribution Blue bars denote a histogram of data divided into 1 sec bins. Red curve is a Poisson curve with rate = median count rate of data. |
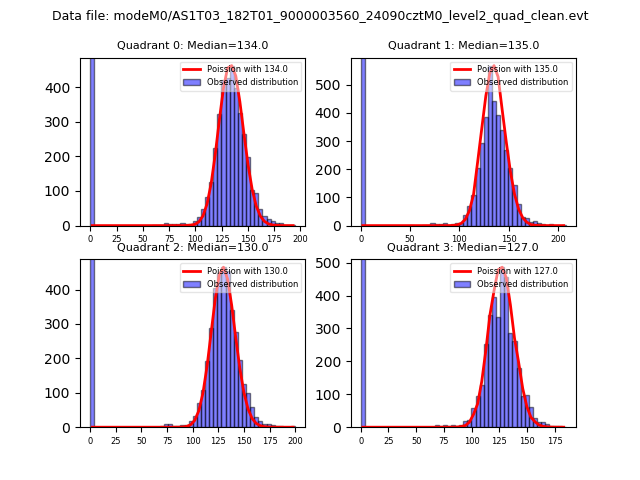 |
 |
| Quadrant-wise count rates Data is divided into 100 sec bins |
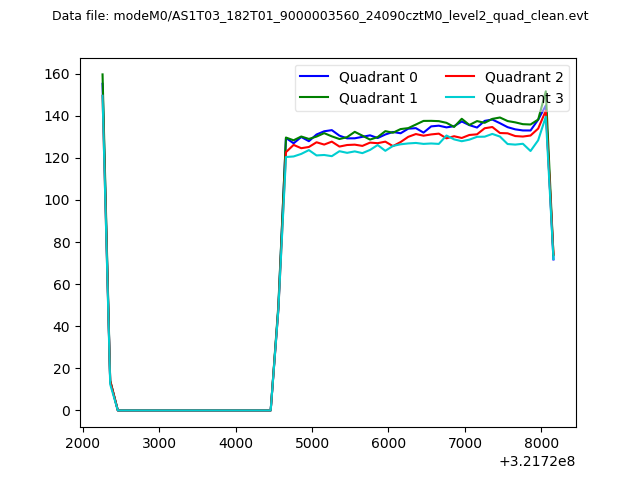 |
|
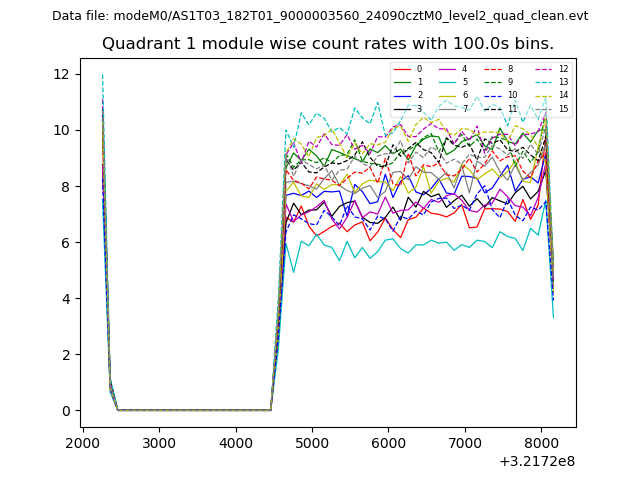
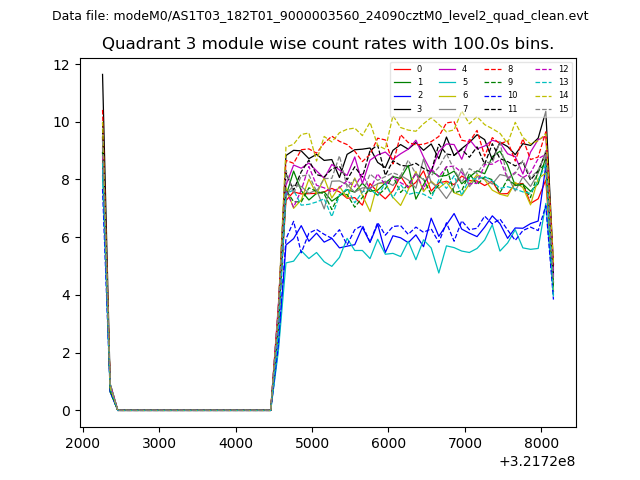
| Module-wise count rates for Quadrant A Data is divided into 100 sec bins |
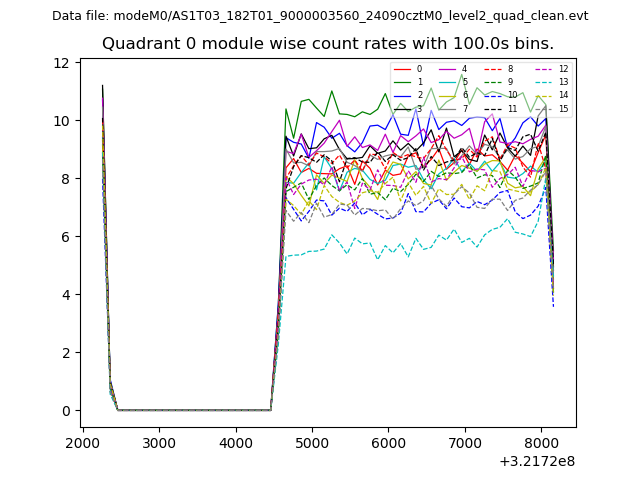 |
 |
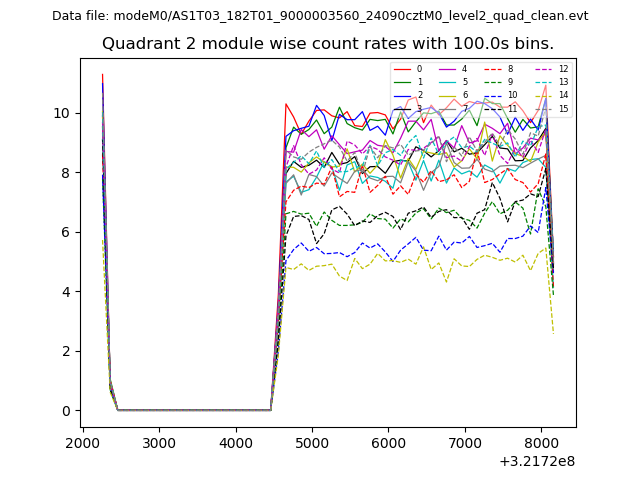
| Module-wise count rates for Quadrant B Data is divided into 100 sec bins |
 |
 |
| Module-wise count rates for Quadrant C Data is divided into 100 sec bins |
 |
 |
| Module-wise count rates for Quadrant D Data is divided into 100 sec bins |
 |
 |
| Parameter | Plot |
|---|---|
| CZT HV Monitor | 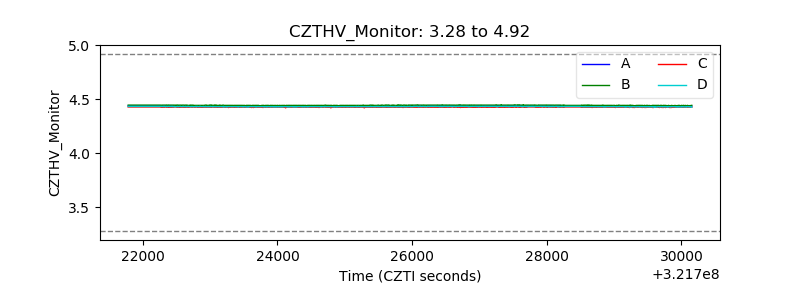 |
| D_VDD | 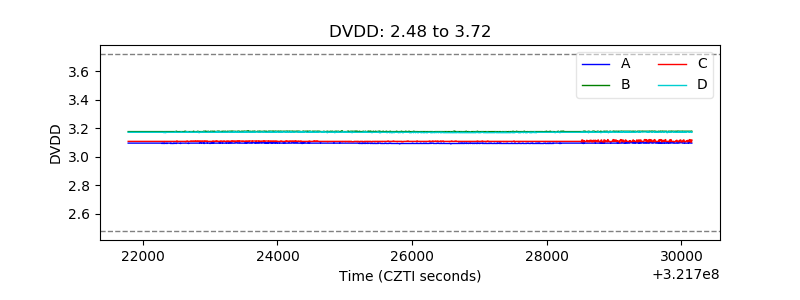 |
| Temperature 1 | 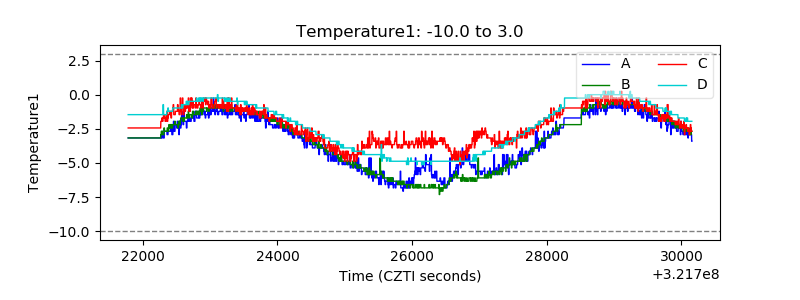 |
| Veto HV Monitor | 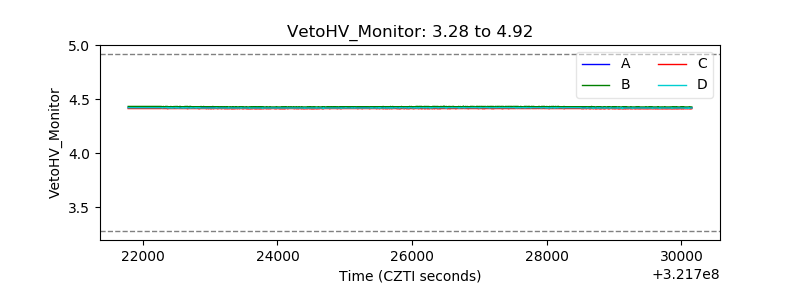 |
| Veto LLD | 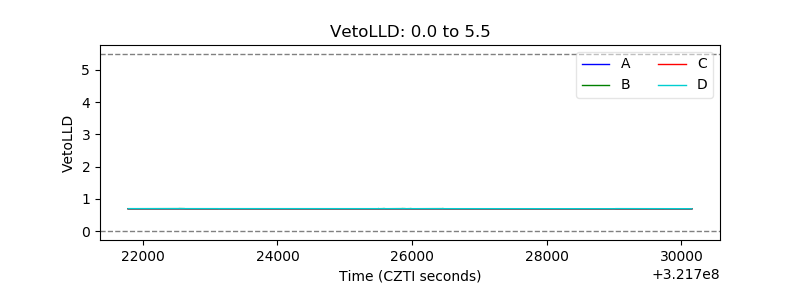 |
| Alpha Counter | 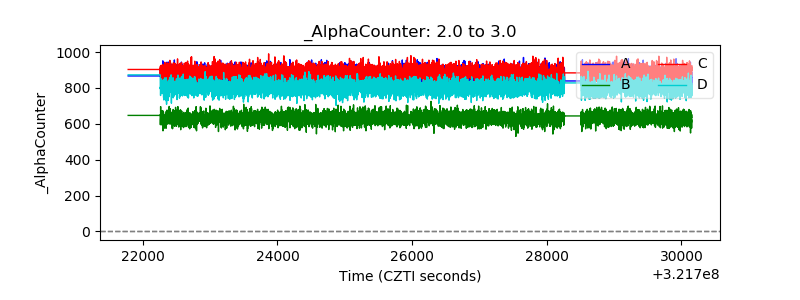 |
| _CPM_Rate | 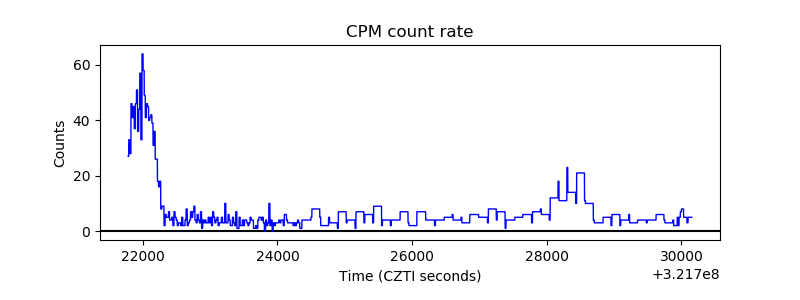 |
| CZT Counter | 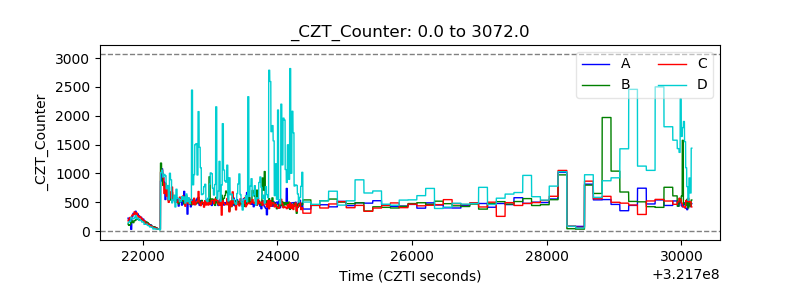 |
| +2.5 Volts monitor |  |
| +5 Volts monitor |  |
| _ROLL_ROT | 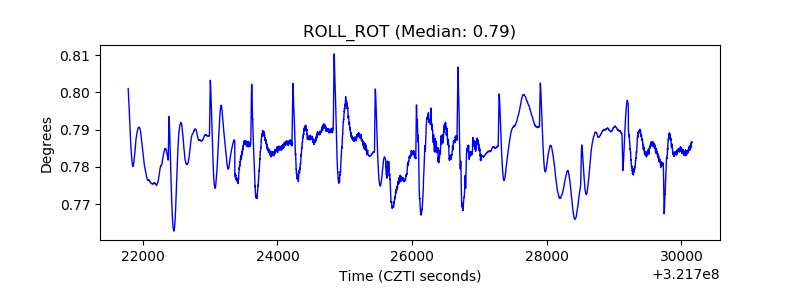 |
| _Roll_DEC | 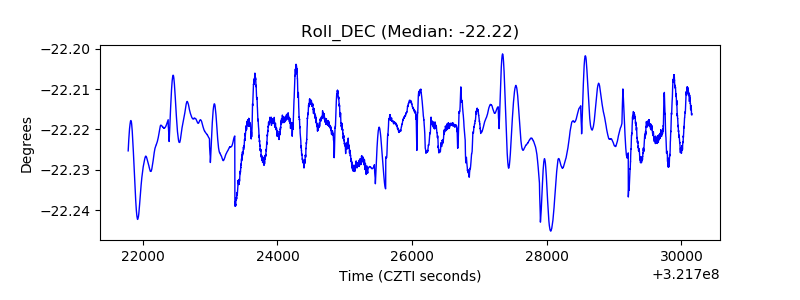 |
| _Roll_RA | 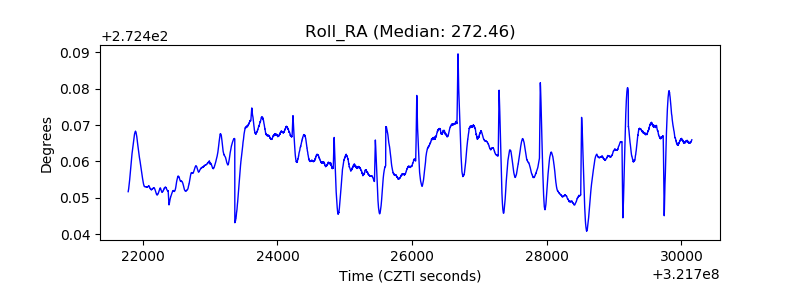 |
| Veto Counter | 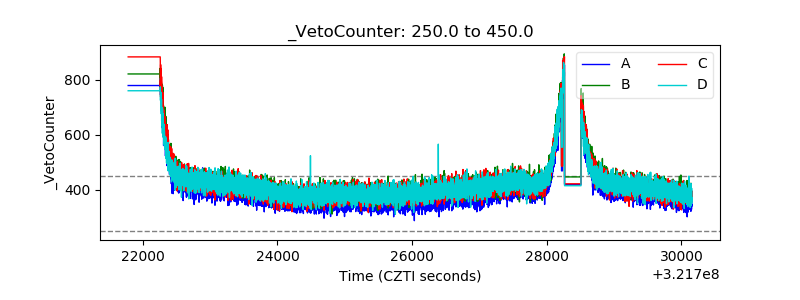 |