| Param | Original file | Final file |
|---|---|---|
| Filename | modeM0/AS1T03_182T01_9000003560_24091cztM0_level2.evt | modeM0/AS1T03_182T01_9000003560_24091cztM0_level2_quad_clean.evt |
| Size (bytes) | 634,806,720 | 77,526,720 |
| Size | 605.4 MB | 73.9 MB |
| Events in quadrant A | 3,617,077 | 470,069 |
| Events in quadrant B | 3,829,568 | 472,586 |
| Events in quadrant C | 3,829,547 | 451,214 |
| Events in quadrant D | 7,447,808 | 438,199 |
| Mode SS | |||
|---|---|---|---|
| Quadrant | BADHDUFLAG | Total packets | Discarded packets |
| A | 0 | 150 | 0 |
| B | 0 | 150 | 0 |
| C | 0 | 150 | 0 |
| D | 0 | 150 | 0 |
| Mode M9 | |||
|---|---|---|---|
| Quadrant | BADHDUFLAG | Total packets | Discarded packets |
| A | 0 | 4 | 0 |
| B | 0 | 4 | 0 |
| C | 0 | 4 | 0 |
| D | 0 | 4 | 0 |
| Mode M0 | |||
|---|---|---|---|
| Quadrant | BADHDUFLAG | Total packets | Discarded packets |
| A | 0 | 15350 | 2 |
| B | 0 | 15983 | 2 |
| C | 0 | 15547 | 2 |
| D | 0 | 27263 | 2 |
| Quadrant | Total seconds | Saturated seconds | Saturation percentage |
|---|---|---|---|
| A | 7403 | 63 | 0.851006% |
| B | 7403 | 108 | 1.458868% |
| C | 7404 | 99 | 1.337115% |
| D | 7404 | 737 | 9.954079% |
Noise dominated data is calculated using 1-second bins in cleaned event files. If a bin has >2000 counts, and if more than 50% of those come from <1% of pixels, then it is considered to be noise-dominated and hence unusable.
| Quadrant | # 1 sec bins | Bins with >0 counts | Bins with >2000 counts | High rate bins dominated by noise | Noise dominated (total time) | Noise dominated (detector-on time) | Marked lightcurve |
|---|---|---|---|---|---|---|---|
| A | 7773 | 7404 | 0 | 0 | 0.00% | 0.00% |  |
| B | 7773 | 7404 | 10 | 10 | 0.13% | 0.14% |  |
| C | 7774 | 7405 | 0 | 0 | 0.00% | 0.00% | 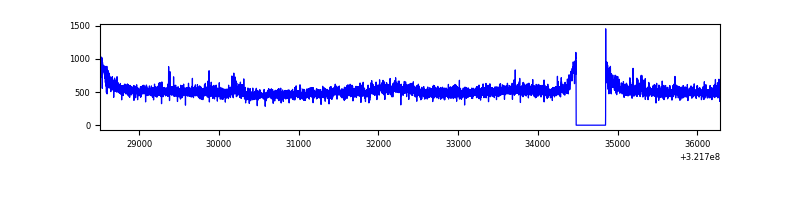 |
| D | 7774 | 7405 | 578 | 578 | 7.44% | 7.81% |  |
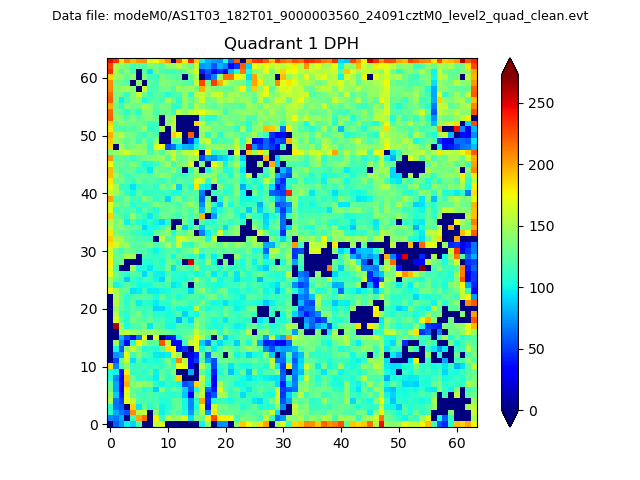
Top three noisy pixels from each quadrant. If the there are fewer than three noisy pixels in the level2.evt file, extra rows are filled as -1
| Pixel properties | Quadrant properties | ||||||
|---|---|---|---|---|---|---|---|
| Quadrant | DetID | PixID | Counts | Sigma | Mean | Median | Sigma |
| A | 2 | 250 | 19376 | 98.16 | 929 | 908 | 188.1 |
| A | 13 | 254 | 13645 | 67.7 | 929 | 908 | 188.1 |
| A | 3 | 137 | 8165 | 38.57 | 929 | 908 | 188.1 |
| B | 0 | 189 | 56167 | 310.8 | 924 | 901 | 177.8 |
| B | 0 | 229 | 48773 | 269.22 | 924 | 901 | 177.8 |
| B | 5 | 172 | 26761 | 145.43 | 924 | 901 | 177.8 |
| C | 14 | 238 | 139081 | 658.47 | 887 | 894 | 209.9 |
| C | 7 | 247 | 99066 | 467.8 | 887 | 894 | 209.9 |
| C | 10 | 91 | 89169 | 420.64 | 887 | 894 | 209.9 |
| D | 1 | 52 | 1397897 | 6438.26 | 882 | 854 | 217.0 |
| D | 8 | 195 | 1393133 | 6416.31 | 882 | 854 | 217.0 |
| D | 12 | 218 | 610401 | 2809.09 | 882 | 854 | 217.0 |
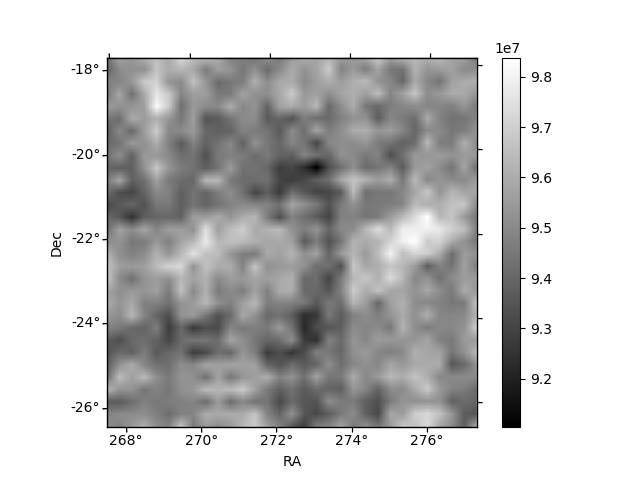
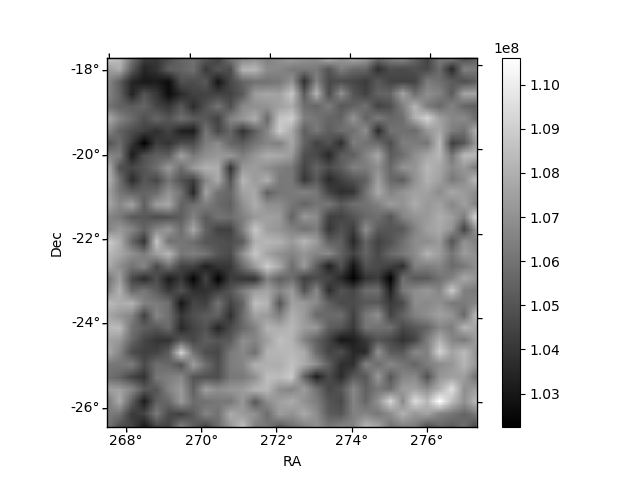
Histogram calculated using DETX and DETY for each event in the final _common_clean file
| Quadrant A | 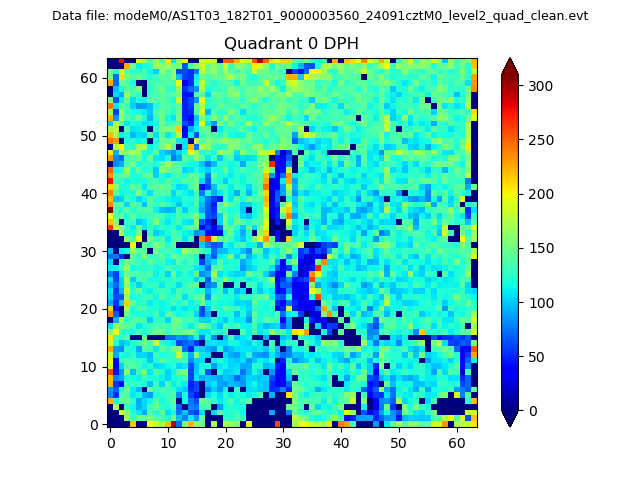 |
 |
Quadrant B |
|---|---|---|---|
| Quadrant D | 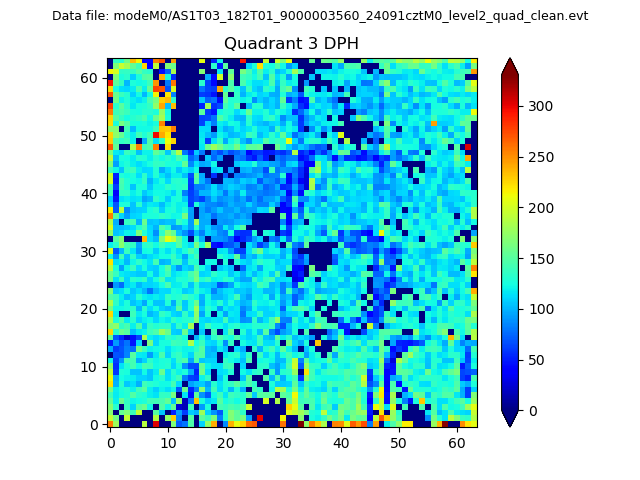 |
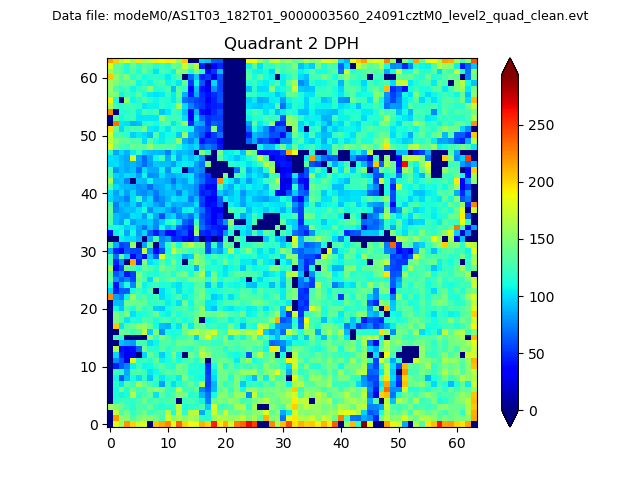 |
Quadrant C |
| Plot type | Count rate plots | Images |
|---|---|---|
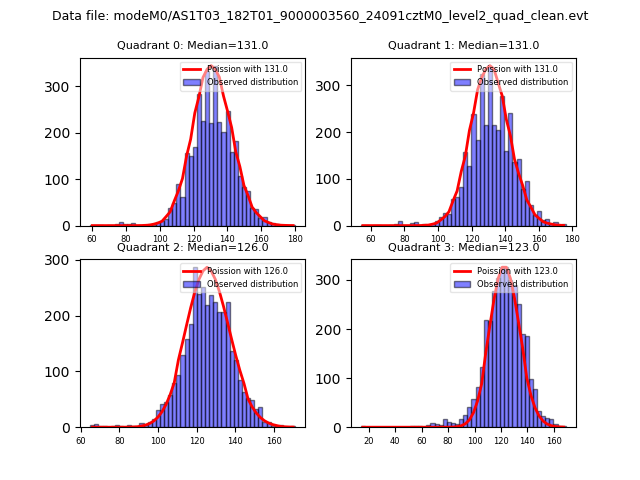
| Comparison with Poisson distribution Blue bars denote a histogram of data divided into 1 sec bins. Red curve is a Poisson curve with rate = median count rate of data. |
 |
 |
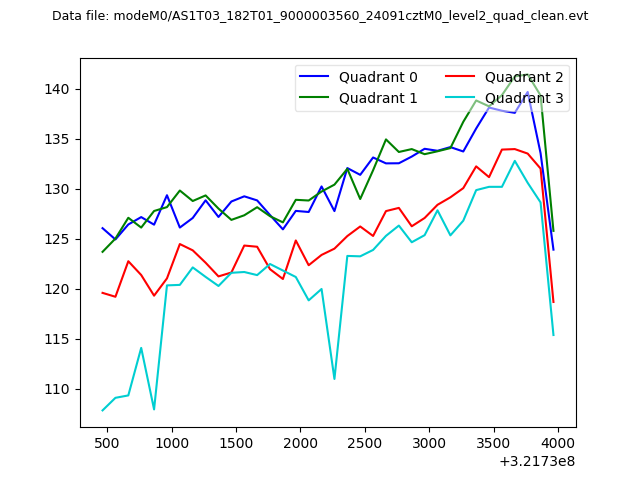
| Quadrant-wise count rates Data is divided into 100 sec bins |
 |
|
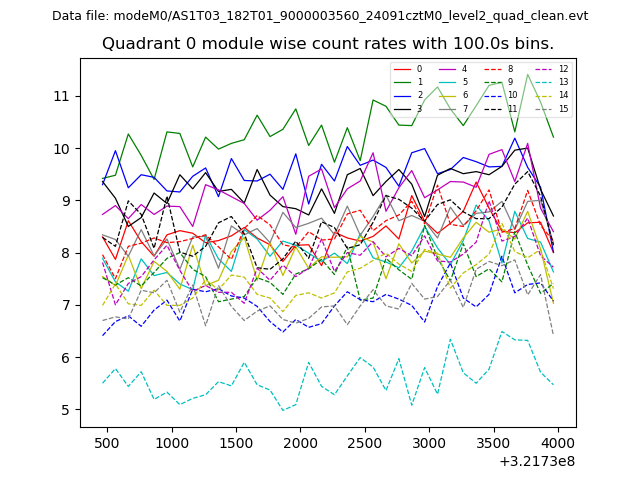
| Module-wise count rates for Quadrant A Data is divided into 100 sec bins |
 |
 |
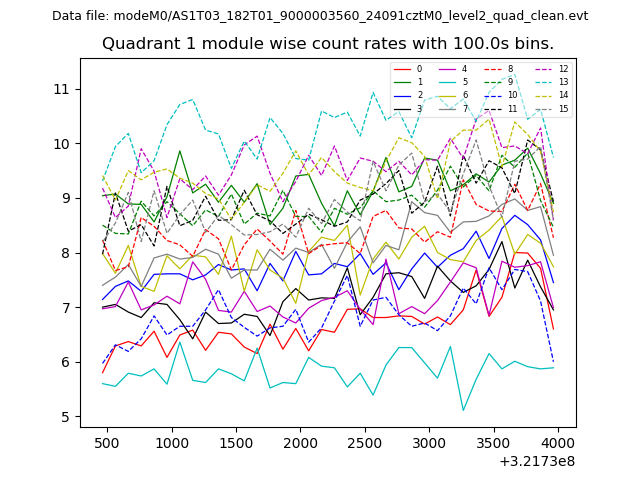
| Module-wise count rates for Quadrant B Data is divided into 100 sec bins |
 |
 |
| Module-wise count rates for Quadrant C Data is divided into 100 sec bins |
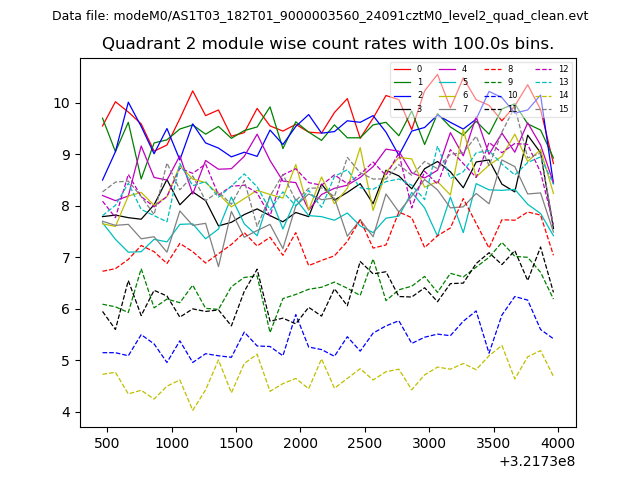 |
 |
| Module-wise count rates for Quadrant D Data is divided into 100 sec bins |
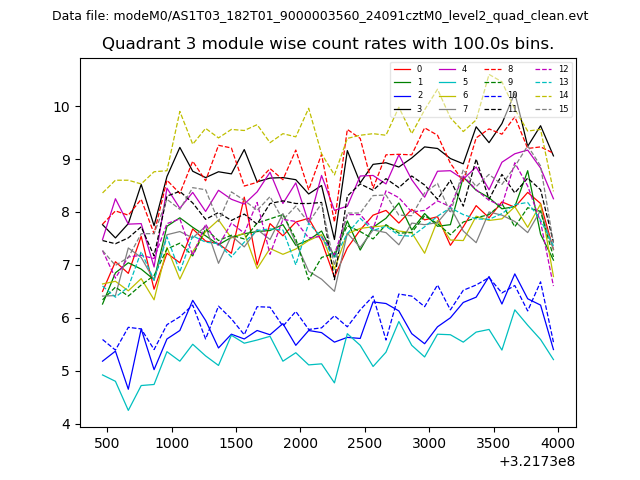 |
 |
| Parameter | Plot |
|---|---|
| CZT HV Monitor | 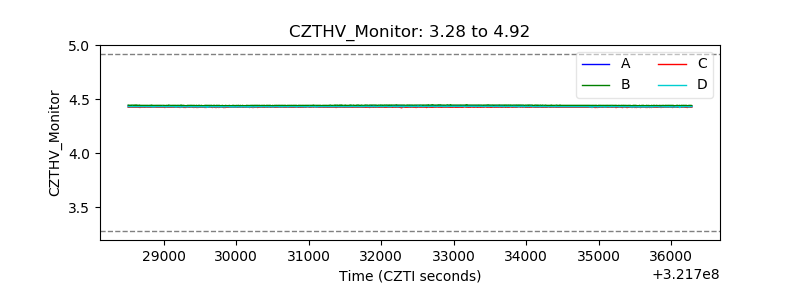 |
| D_VDD | 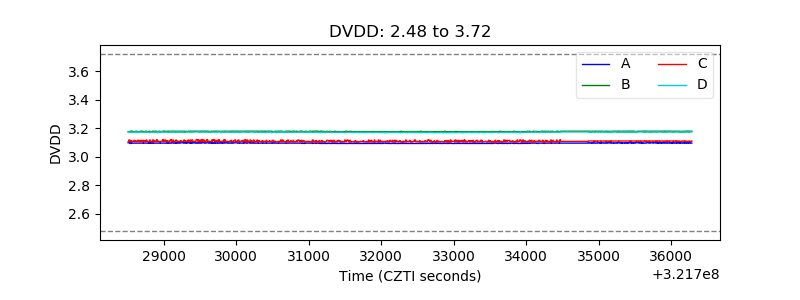 |
| Temperature 1 | 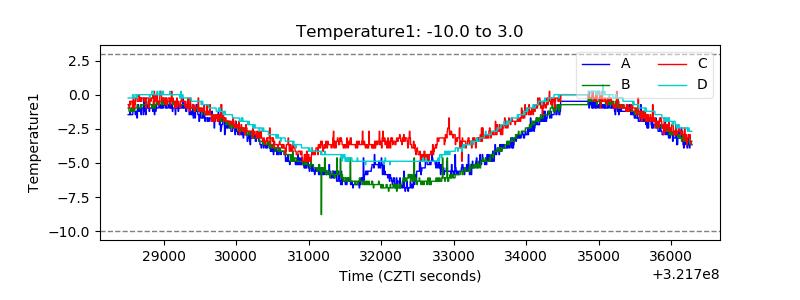 |
| Veto HV Monitor | 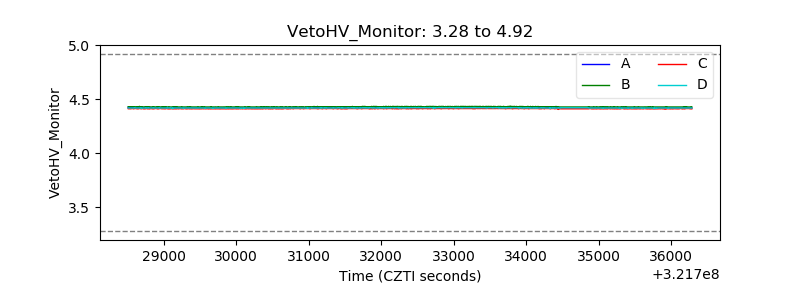 |
| Veto LLD | 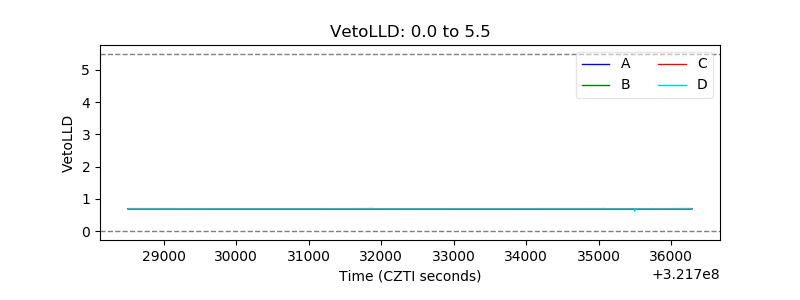 |
| Alpha Counter | 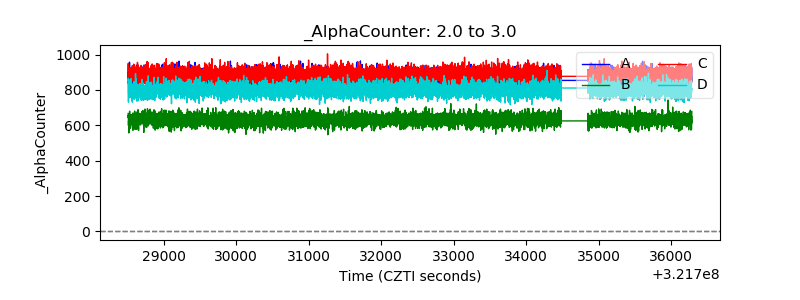 |
| _CPM_Rate | 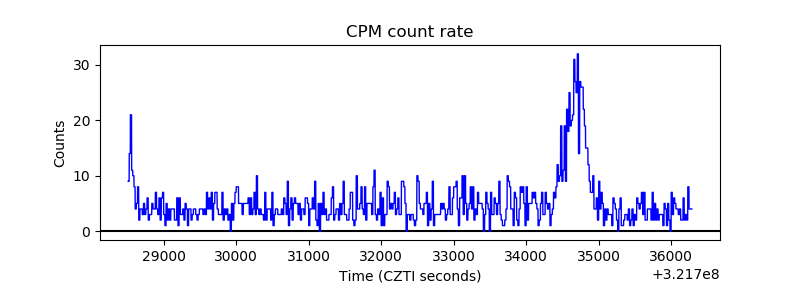 |
| CZT Counter | 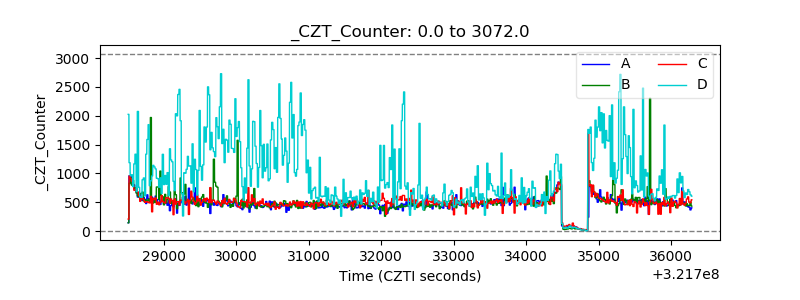 |
| +2.5 Volts monitor |  |
| +5 Volts monitor | 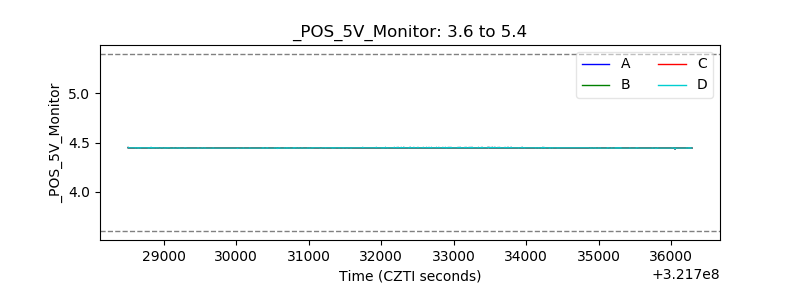 |
| _ROLL_ROT | 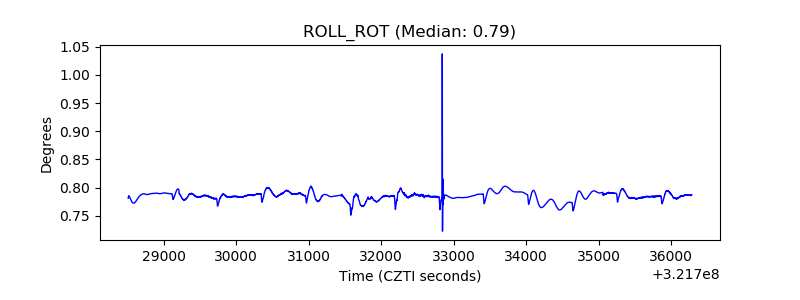 |
| _Roll_DEC | 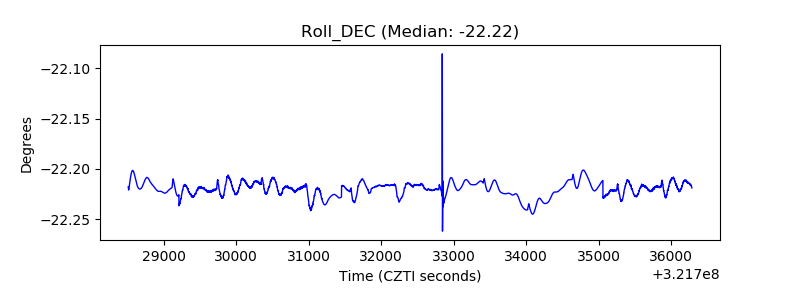 |
| _Roll_RA | 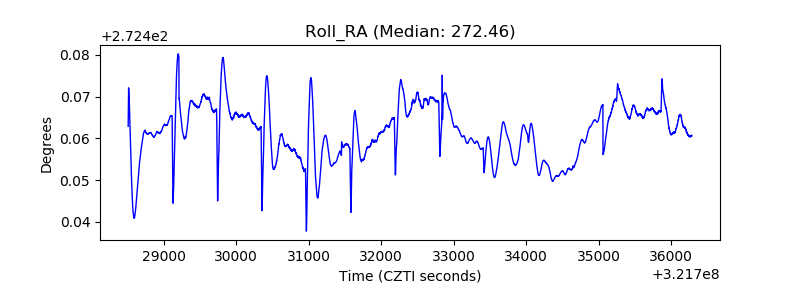 |
| Veto Counter | 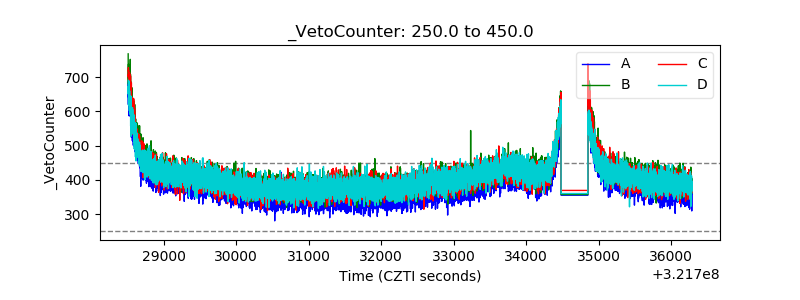 |