| Param | Original file | Final file |
|---|---|---|
| Filename | modeM0/AS1T03_182T01_9000003560_24095cztM0_level2.evt | modeM0/AS1T03_182T01_9000003560_24095cztM0_level2_quad_clean.evt |
| Size (bytes) | 925,531,200 | 93,156,480 |
| Size | 882.7 MB | 88.8 MB |
| Events in quadrant A | 5,754,603 | 501,781 |
| Events in quadrant B | 6,182,956 | 508,813 |
| Events in quadrant C | 5,995,697 | 488,266 |
| Events in quadrant D | 9,269,114 | 475,825 |
| Mode SS | |||
|---|---|---|---|
| Quadrant | BADHDUFLAG | Total packets | Discarded packets |
| A | 0 | 350 | 104 |
| B | 0 | 353 | 97 |
| C | 0 | 350 | 104 |
| D | 0 | 347 | 101 |
| Mode M9 | |||
|---|---|---|---|
| Quadrant | BADHDUFLAG | Total packets | Discarded packets |
| A | 0 | 23 | 7 |
| B | 0 | 21 | 5 |
| C | 0 | 21 | 4 |
| D | 0 | 23 | 7 |
| Mode M0 | |||
|---|---|---|---|
| Quadrant | BADHDUFLAG | Total packets | Discarded packets |
| A | 0 | 35277 | 10362 |
| B | 0 | 36501 | 10406 |
| C | 0 | 35612 | 10412 |
| D | 0 | 49610 | 13726 |
| Quadrant | Total seconds | Saturated seconds | Saturation percentage |
|---|---|---|---|
| A | 12209 | 25 | 0.204767% |
| B | 12270 | 136 | 1.108394% |
| C | 12230 | 101 | 0.825838% |
| D | 12159 | 726 | 5.970886% |
Noise dominated data is calculated using 1-second bins in cleaned event files. If a bin has >2000 counts, and if more than 50% of those come from <1% of pixels, then it is considered to be noise-dominated and hence unusable.
| Quadrant | # 1 sec bins | Bins with >0 counts | Bins with >2000 counts | High rate bins dominated by noise | Noise dominated (total time) | Noise dominated (detector-on time) | Marked lightcurve |
|---|---|---|---|---|---|---|---|
| A | 20137 | 12775 | 0 | 0 | 0.00% | 0.00% | 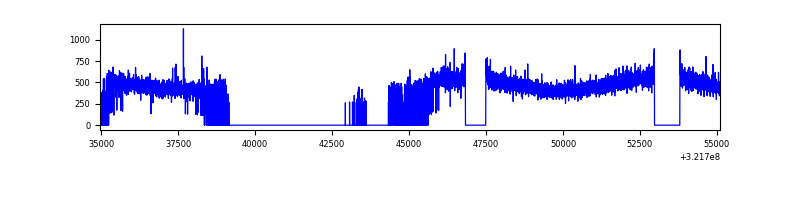 |
| B | 20140 | 12869 | 56 | 56 | 0.28% | 0.44% | 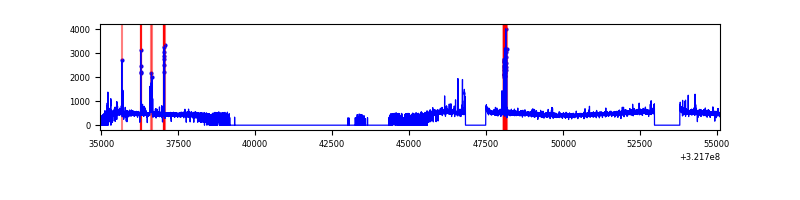 |
| C | 20115 | 12795 | 1 | 1 | 0.00% | 0.01% | 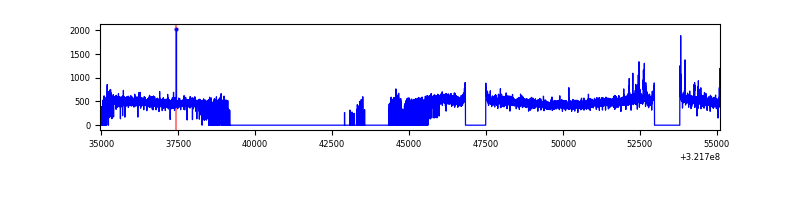 |
| D | 20030 | 12720 | 554 | 554 | 2.77% | 4.36% | 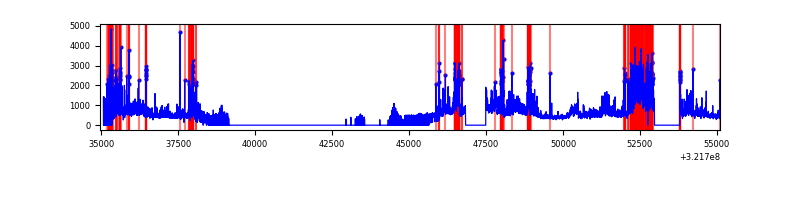 |
Top three noisy pixels from each quadrant. If the there are fewer than three noisy pixels in the level2.evt file, extra rows are filled as -1
| Pixel properties | Quadrant properties | ||||||
|---|---|---|---|---|---|---|---|
| Quadrant | DetID | PixID | Counts | Sigma | Mean | Median | Sigma |
| A | 13 | 254 | 22610 | 70.79 | 1485 | 1454 | 298.9 |
| A | 2 | 250 | 19982 | 62.0 | 1485 | 1454 | 298.9 |
| A | 3 | 137 | 12996 | 38.62 | 1485 | 1454 | 298.9 |
| B | 0 | 245 | 161515 | 564.42 | 1488 | 1447 | 283.6 |
| B | 15 | 32 | 67062 | 231.37 | 1488 | 1447 | 283.6 |
| B | 5 | 172 | 44275 | 151.02 | 1488 | 1447 | 283.6 |
| C | 14 | 238 | 224005 | 655.82 | 1435 | 1443 | 339.4 |
| C | 7 | 247 | 88883 | 257.66 | 1435 | 1443 | 339.4 |
| C | 10 | 9 | 44636 | 127.28 | 1435 | 1443 | 339.4 |
| D | 12 | 218 | 1912326 | 5587.33 | 1407 | 1368 | 342.0 |
| D | 8 | 195 | 973971 | 2843.73 | 1407 | 1368 | 342.0 |
| D | 11 | 176 | 512614 | 1494.8 | 1407 | 1368 | 342.0 |
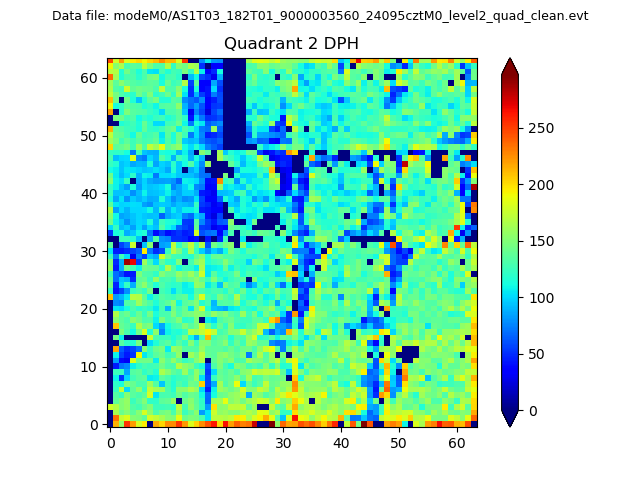
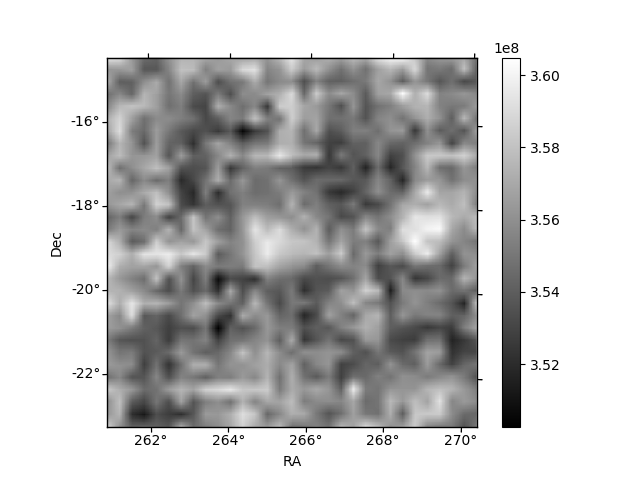
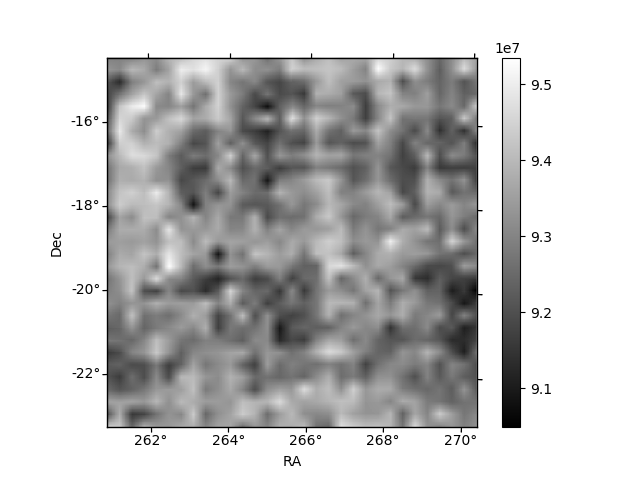
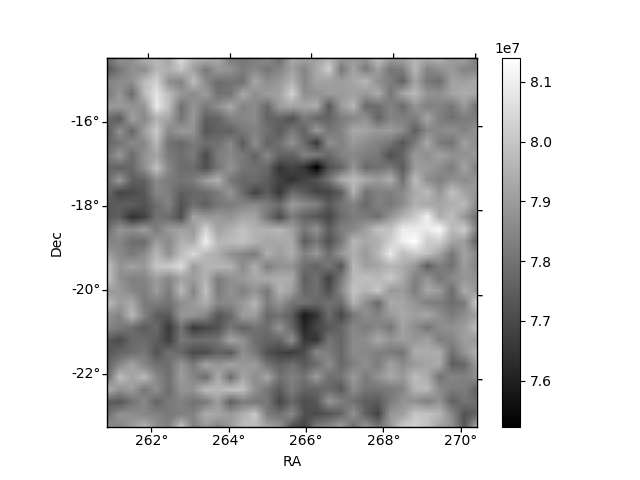
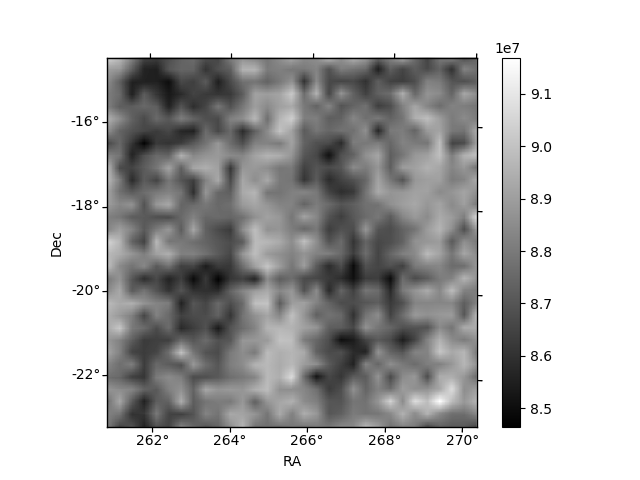
Histogram calculated using DETX and DETY for each event in the final _common_clean file
| Quadrant A | 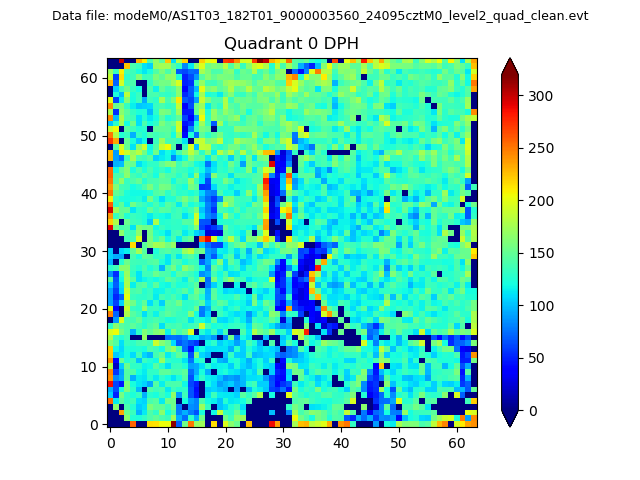 |
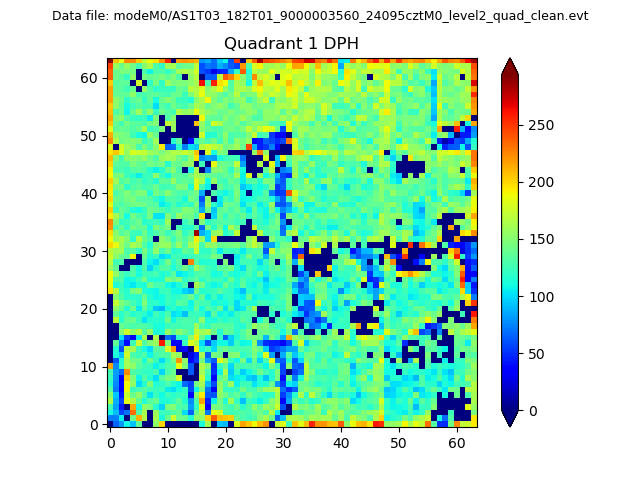 |
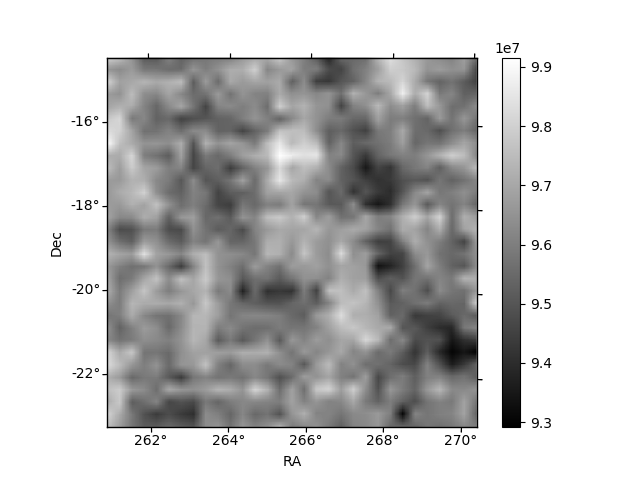
Quadrant B |
|---|---|---|---|
| Quadrant D | 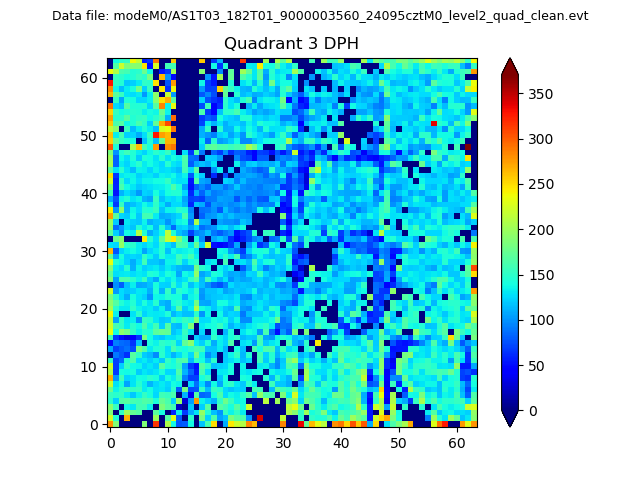 |
 |
Quadrant C |
| Plot type | Count rate plots | Images |
|---|---|---|
| Comparison with Poisson distribution Blue bars denote a histogram of data divided into 1 sec bins. Red curve is a Poisson curve with rate = median count rate of data. |
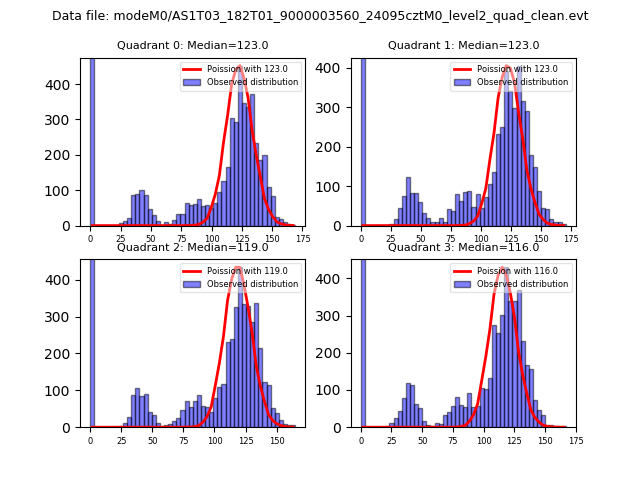 |
 |
| Quadrant-wise count rates Data is divided into 100 sec bins |
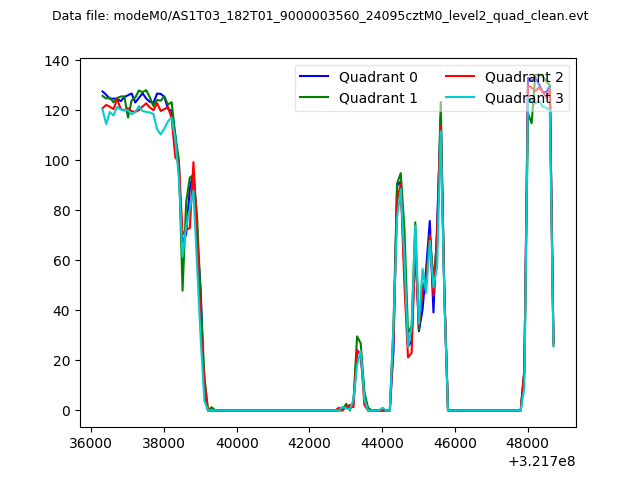 |
|
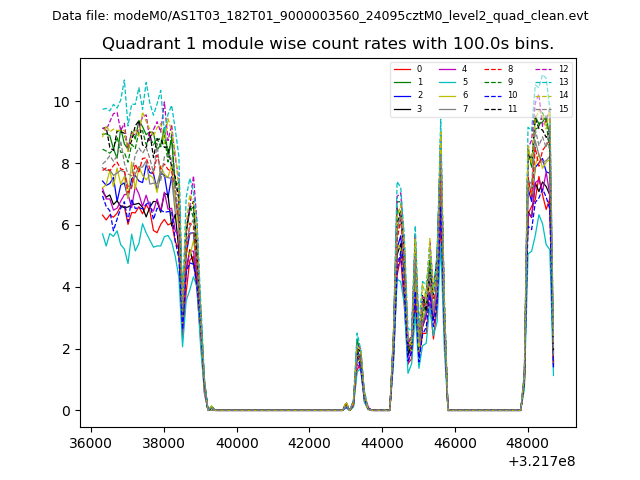
| Module-wise count rates for Quadrant A Data is divided into 100 sec bins |
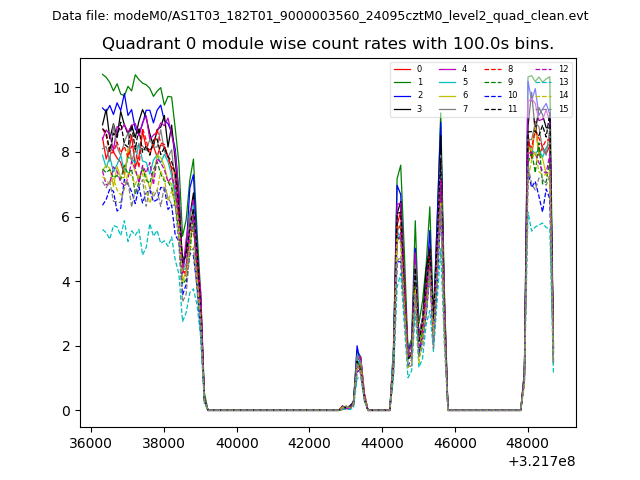 |
 |
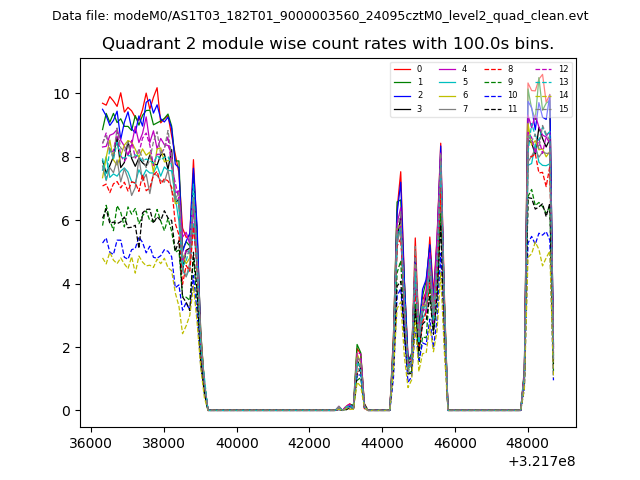
| Module-wise count rates for Quadrant B Data is divided into 100 sec bins |
 |
 |
| Module-wise count rates for Quadrant C Data is divided into 100 sec bins |
 |
 |
| Module-wise count rates for Quadrant D Data is divided into 100 sec bins |
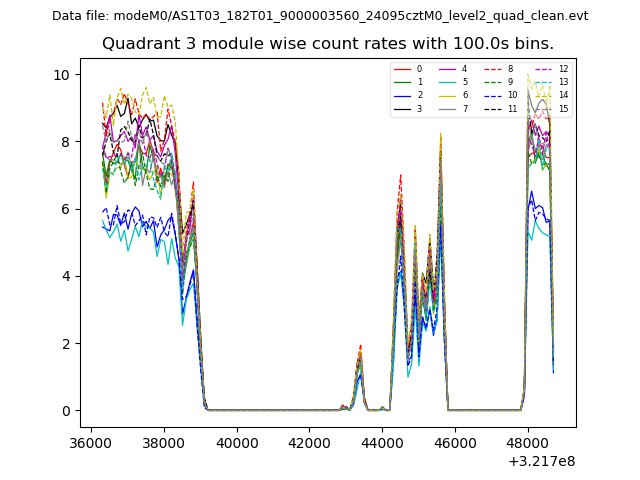 |
 |
| Parameter | Plot |
|---|---|
| CZT HV Monitor | 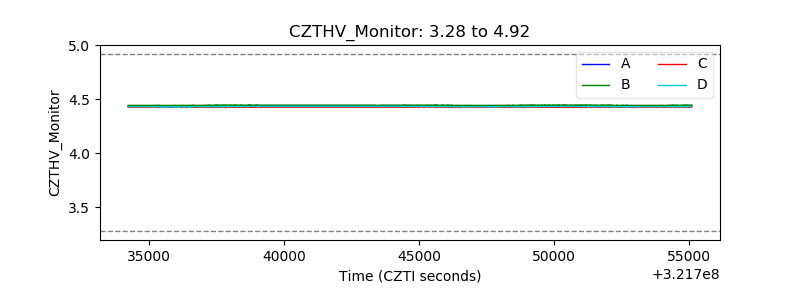 |
| D_VDD | 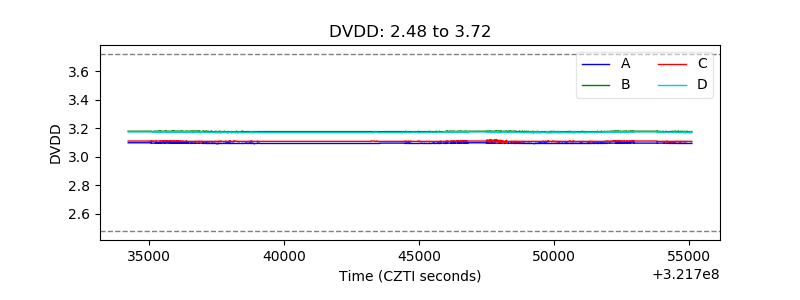 |
| Temperature 1 | 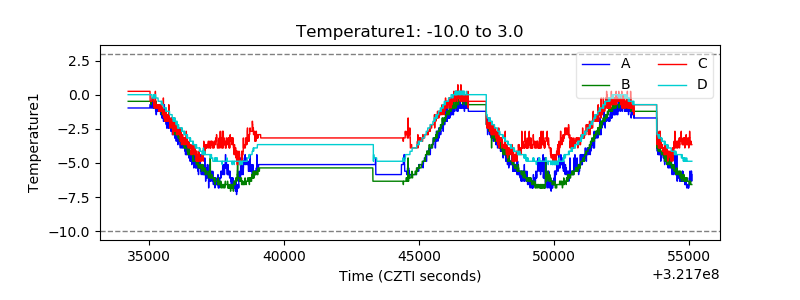 |
| Veto HV Monitor | 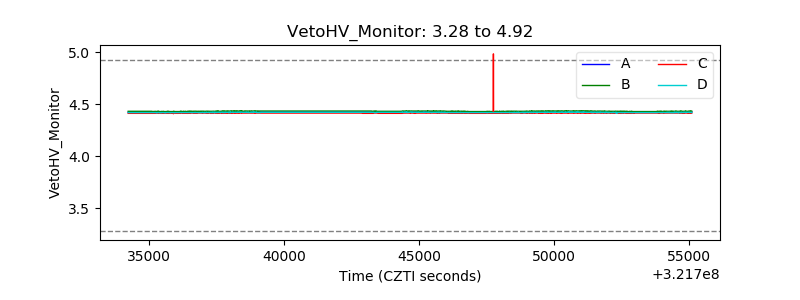 |
| Veto LLD | 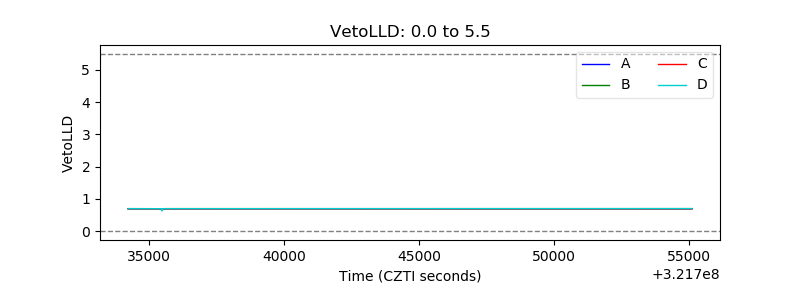 |
| Alpha Counter | 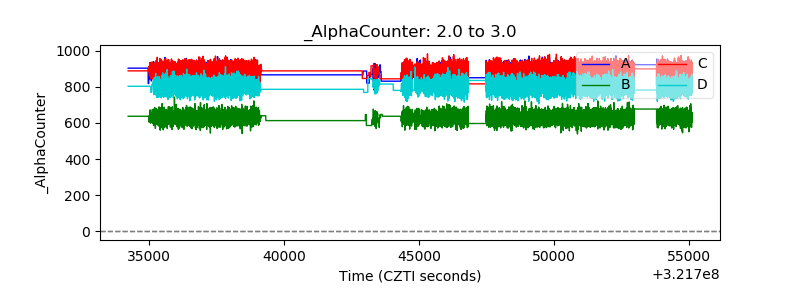 |
| _CPM_Rate | 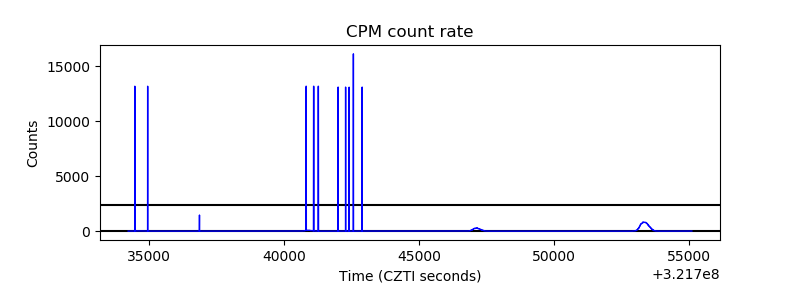 |
| CZT Counter | 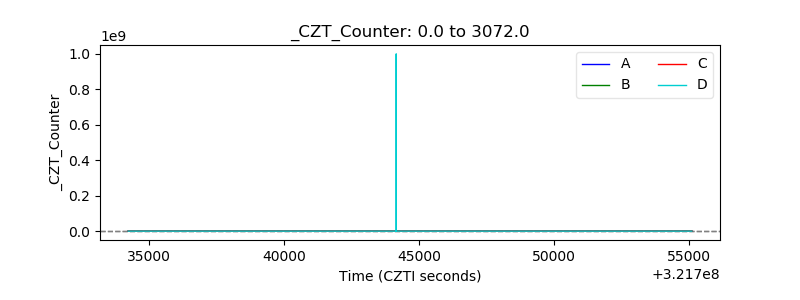 |
| +2.5 Volts monitor |  |
| +5 Volts monitor | 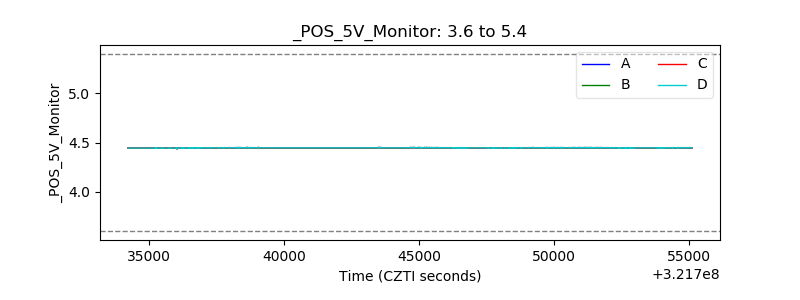 |
| _ROLL_ROT | 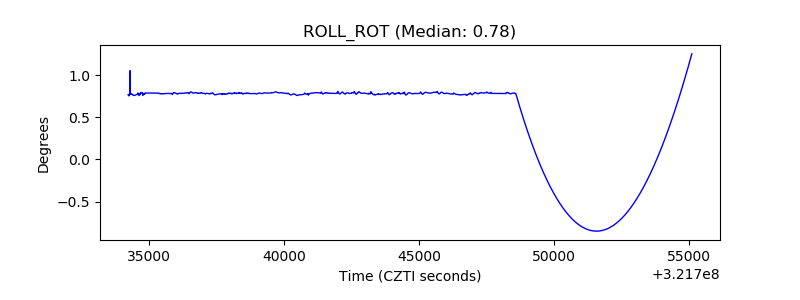 |
| _Roll_DEC | 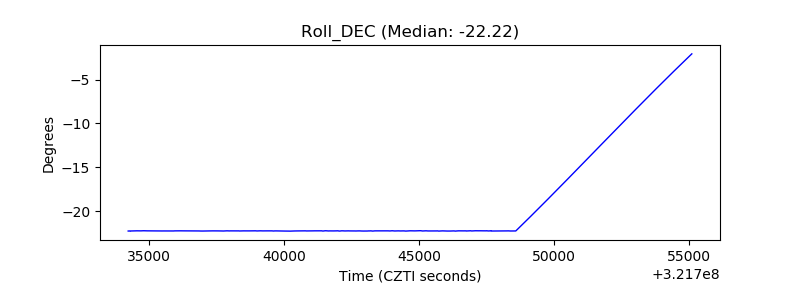 |
| _Roll_RA | 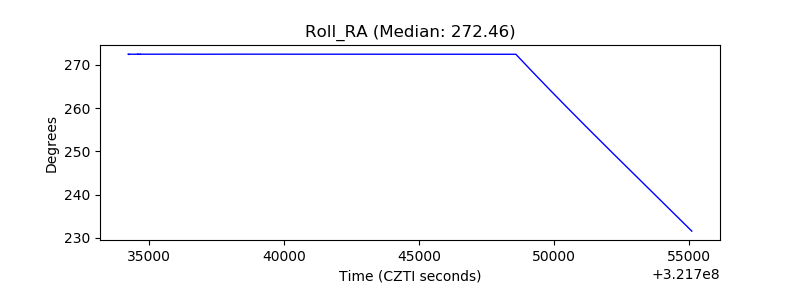 |
| Veto Counter | 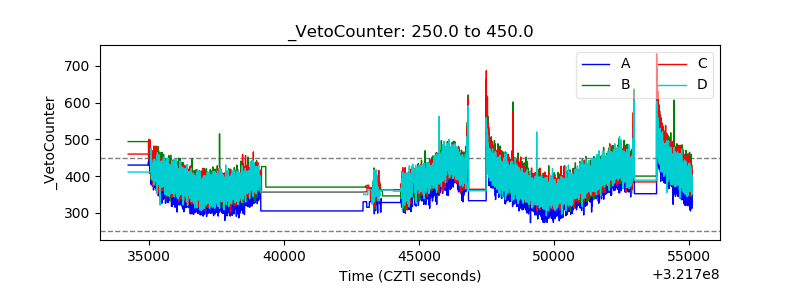 |