| Param | Original file | Final file |
|---|---|---|
| Filename | modeM0/AS1T03_182T01_9000003560_24097cztM0_level2.evt | modeM0/AS1T03_182T01_9000003560_24097cztM0_level2_quad_clean.evt |
| Size (bytes) | 884,278,080 | 155,859,840 |
| Size | 843.3 MB | 148.6 MB |
| Events in quadrant A | 5,712,366 | 989,818 |
| Events in quadrant B | 6,105,688 | 992,363 |
| Events in quadrant C | 6,057,717 | 962,680 |
| Events in quadrant D | 8,089,291 | 942,254 |
| Mode SS | |||
|---|---|---|---|
| Quadrant | BADHDUFLAG | Total packets | Discarded packets |
| A | 0 | 246 | 0 |
| B | 0 | 246 | 0 |
| C | 0 | 246 | 0 |
| D | 0 | 246 | 0 |
| Mode M9 | |||
|---|---|---|---|
| Quadrant | BADHDUFLAG | Total packets | Discarded packets |
| A | 0 | 12 | 0 |
| B | 0 | 12 | 0 |
| C | 0 | 12 | 0 |
| D | 0 | 12 | 0 |
| Mode M0 | |||
|---|---|---|---|
| Quadrant | BADHDUFLAG | Total packets | Discarded packets |
| A | 0 | 24654 | 2 |
| B | 0 | 25727 | 2 |
| C | 0 | 24895 | 3 |
| D | 0 | 32219 | 2 |
| Quadrant | Total seconds | Saturated seconds | Saturation percentage |
|---|---|---|---|
| A | 12050 | 56 | 0.464730% |
| B | 12051 | 166 | 1.377479% |
| C | 12050 | 110 | 0.912863% |
| D | 12050 | 300 | 2.489627% |
Noise dominated data is calculated using 1-second bins in cleaned event files. If a bin has >2000 counts, and if more than 50% of those come from <1% of pixels, then it is considered to be noise-dominated and hence unusable.
| Quadrant | # 1 sec bins | Bins with >0 counts | Bins with >2000 counts | High rate bins dominated by noise | Noise dominated (total time) | Noise dominated (detector-on time) | Marked lightcurve |
|---|---|---|---|---|---|---|---|
| A | 13210 | 12051 | 0 | 0 | 0.00% | 0.00% | 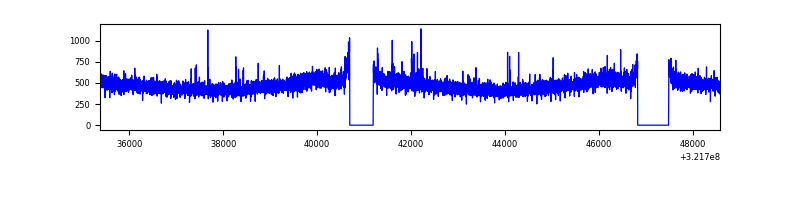 |
| B | 13211 | 12052 | 59 | 59 | 0.45% | 0.49% | 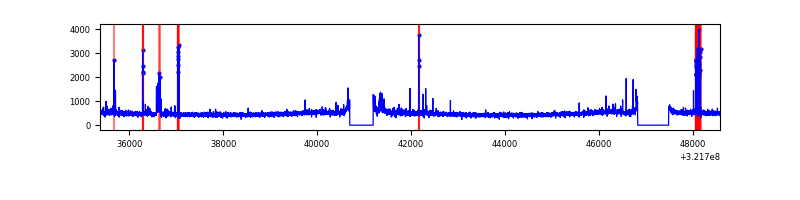 |
| C | 13210 | 12052 | 1 | 1 | 0.01% | 0.01% | 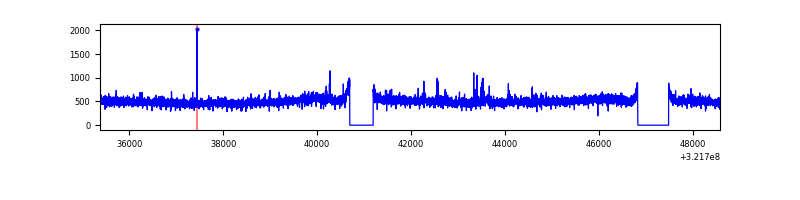 |
| D | 13210 | 12051 | 166 | 166 | 1.26% | 1.38% |  |
Top three noisy pixels from each quadrant. If the there are fewer than three noisy pixels in the level2.evt file, extra rows are filled as -1
| Pixel properties | Quadrant properties | ||||||
|---|---|---|---|---|---|---|---|
| Quadrant | DetID | PixID | Counts | Sigma | Mean | Median | Sigma |
| A | 6 | 16 | 25110 | 79.74 | 1470 | 1438 | 296.9 |
| A | 13 | 254 | 21803 | 68.6 | 1470 | 1438 | 296.9 |
| A | 2 | 250 | 17233 | 53.21 | 1470 | 1438 | 296.9 |
| B | 0 | 245 | 154443 | 548.75 | 1459 | 1417 | 278.9 |
| B | 15 | 32 | 77116 | 271.46 | 1459 | 1417 | 278.9 |
| B | 5 | 172 | 53029 | 185.08 | 1459 | 1417 | 278.9 |
| C | 14 | 238 | 221503 | 662.22 | 1411 | 1420 | 332.3 |
| C | 7 | 247 | 220571 | 659.41 | 1411 | 1420 | 332.3 |
| C | 0 | 239 | 78242 | 231.15 | 1411 | 1420 | 332.3 |
| D | 12 | 218 | 956150 | 2760.04 | 1424 | 1382 | 345.9 |
| D | 8 | 195 | 651727 | 1880.01 | 1424 | 1382 | 345.9 |
| D | 11 | 176 | 576915 | 1663.75 | 1424 | 1382 | 345.9 |
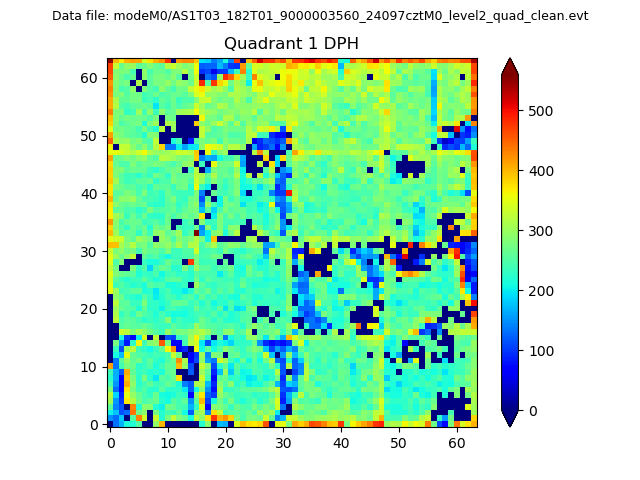
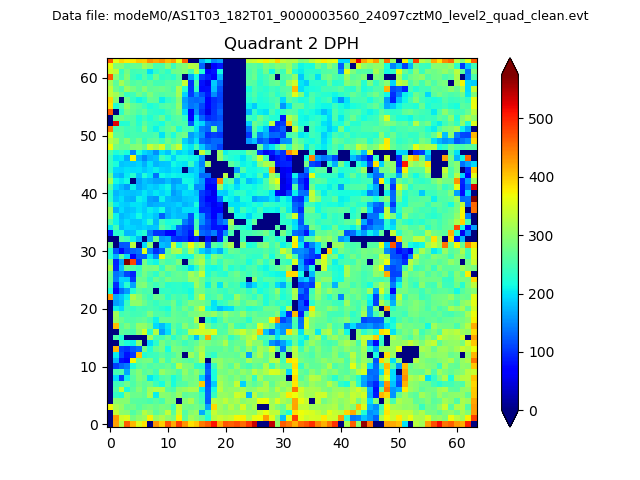
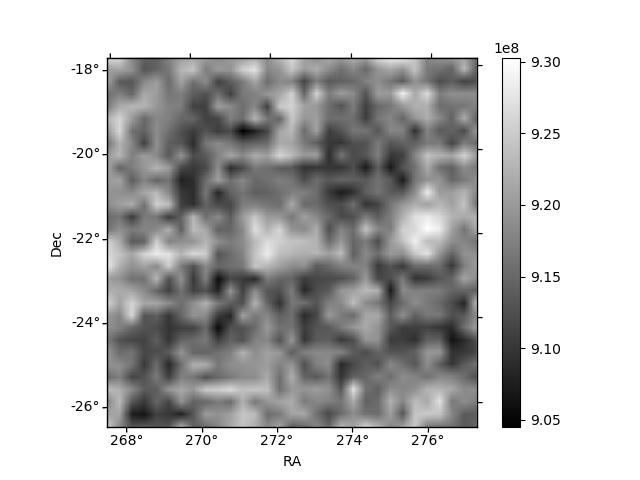
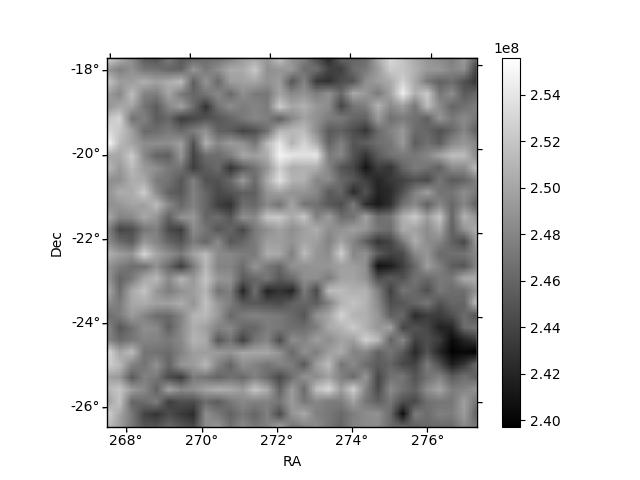
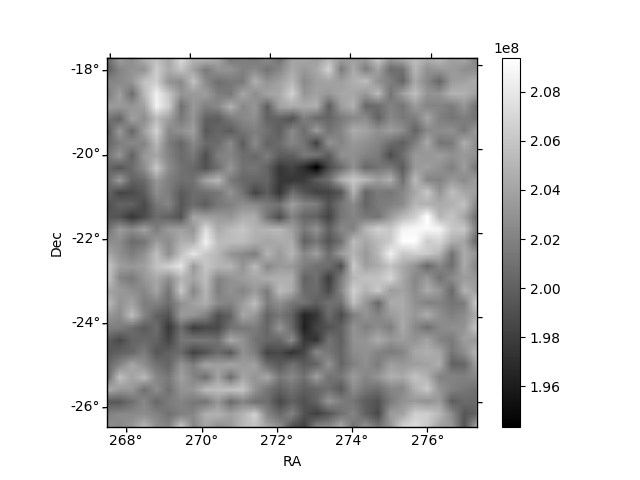
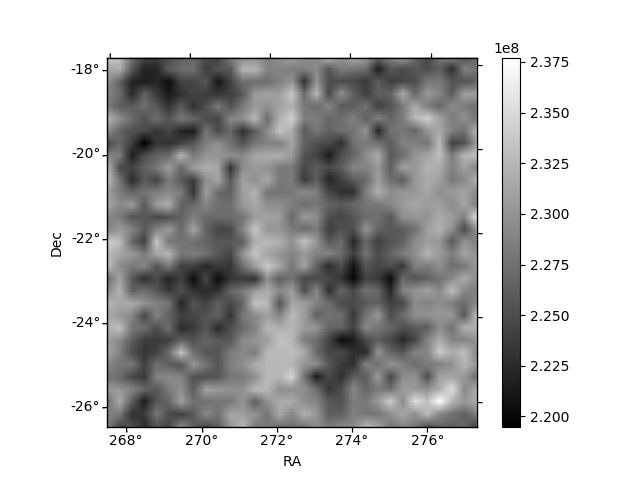
Histogram calculated using DETX and DETY for each event in the final _common_clean file
| Quadrant A | 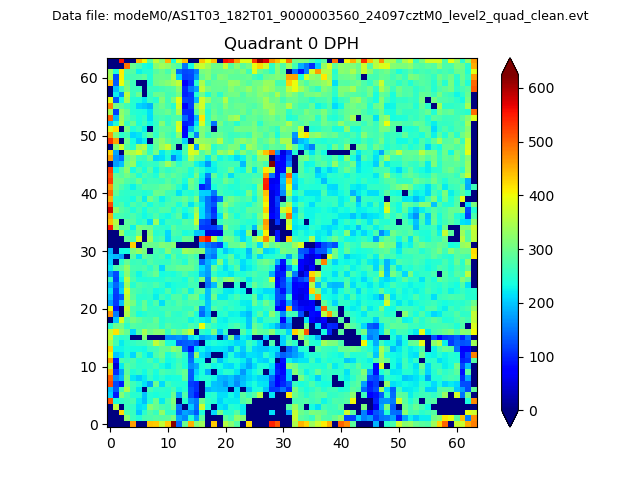 |
 |
Quadrant B |
|---|---|---|---|
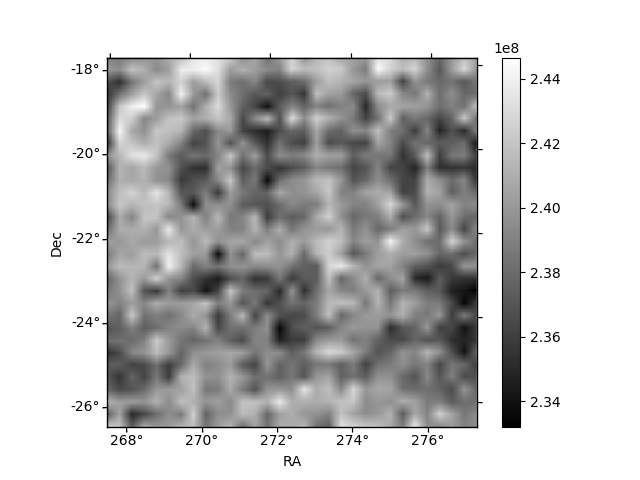
| Quadrant D | 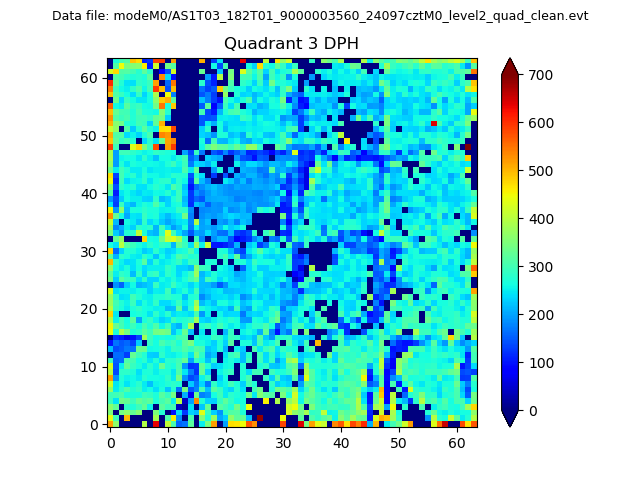 |
 |
Quadrant C |
| Plot type | Count rate plots | Images |
|---|---|---|
| Comparison with Poisson distribution Blue bars denote a histogram of data divided into 1 sec bins. Red curve is a Poisson curve with rate = median count rate of data. |
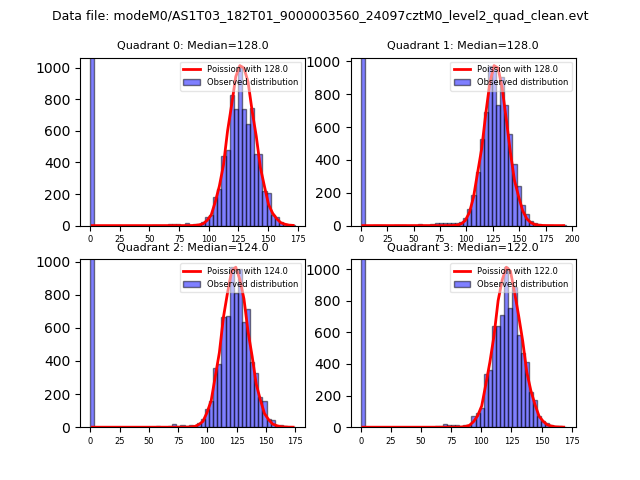 |
 |
| Quadrant-wise count rates Data is divided into 100 sec bins |
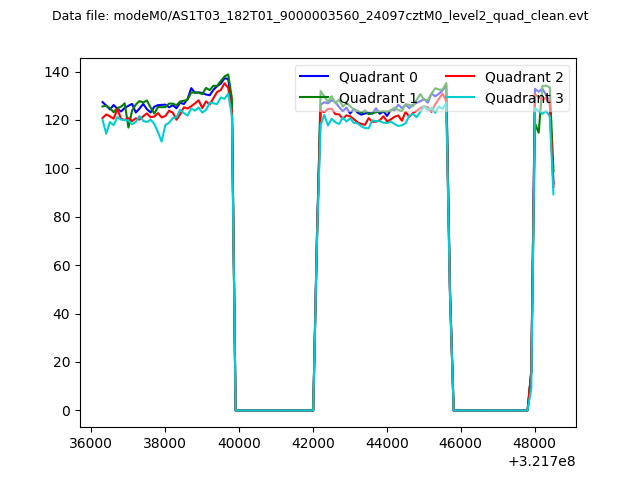 |
|
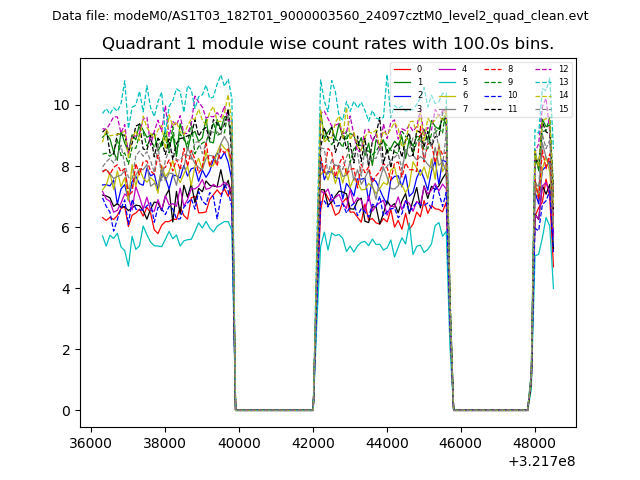
| Module-wise count rates for Quadrant A Data is divided into 100 sec bins |
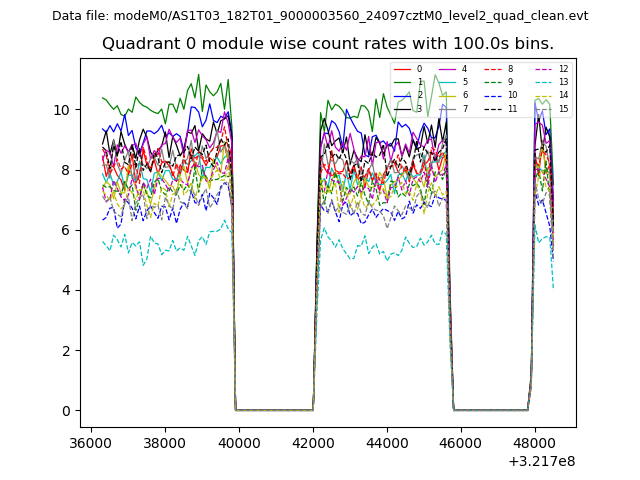 |
 |
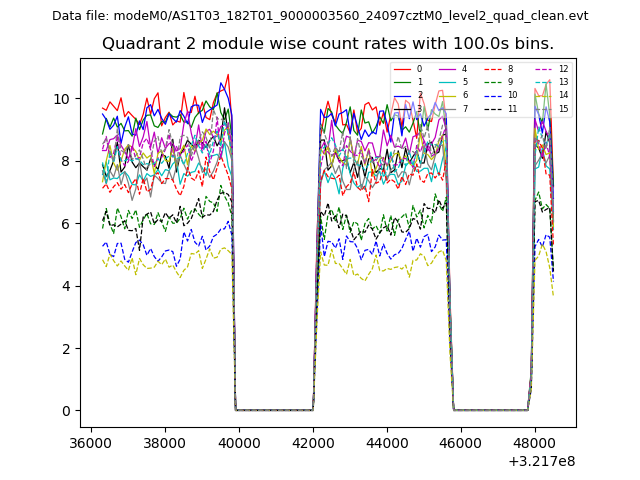
| Module-wise count rates for Quadrant B Data is divided into 100 sec bins |
 |
 |
| Module-wise count rates for Quadrant C Data is divided into 100 sec bins |
 |
 |
| Module-wise count rates for Quadrant D Data is divided into 100 sec bins |
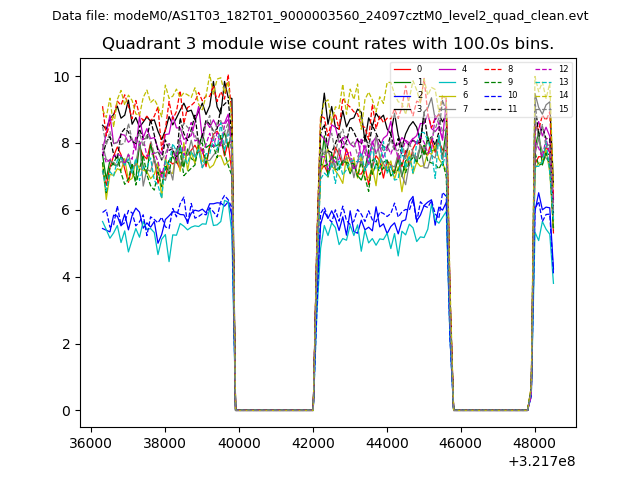 |
 |
| Parameter | Plot |
|---|---|
| CZT HV Monitor | 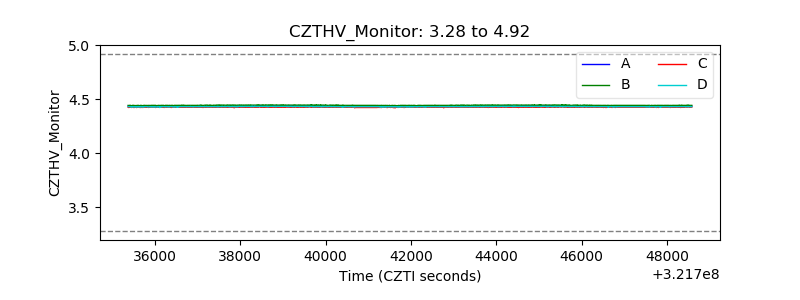 |
| D_VDD | 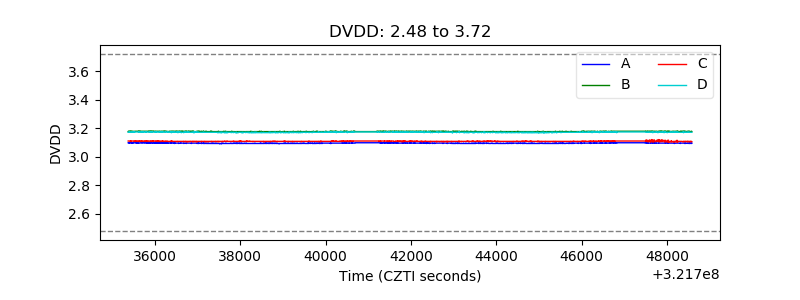 |
| Temperature 1 | 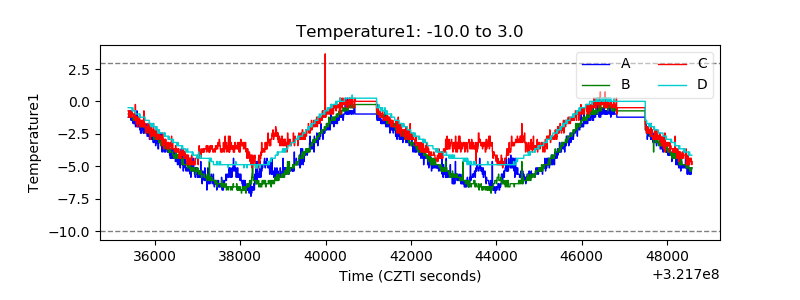 |
| Veto HV Monitor | 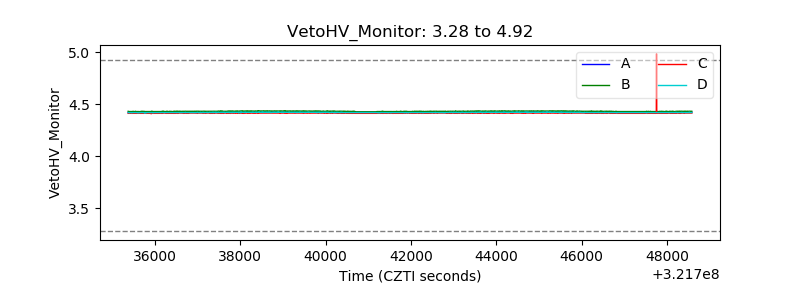 |
| Veto LLD | 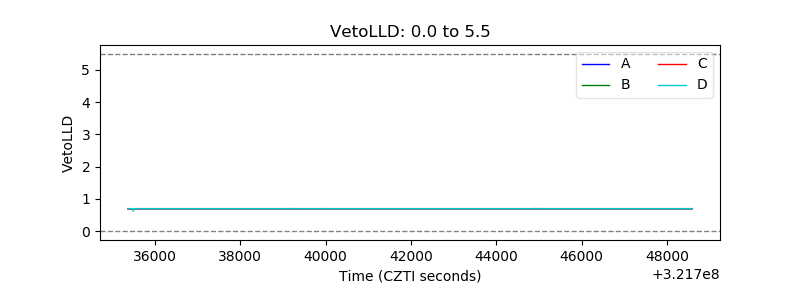 |
| Alpha Counter | 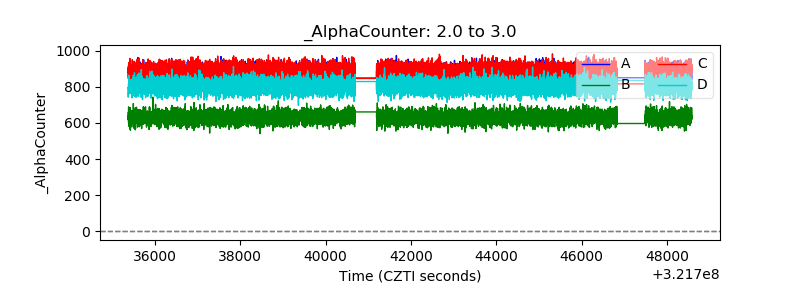 |
| _CPM_Rate | 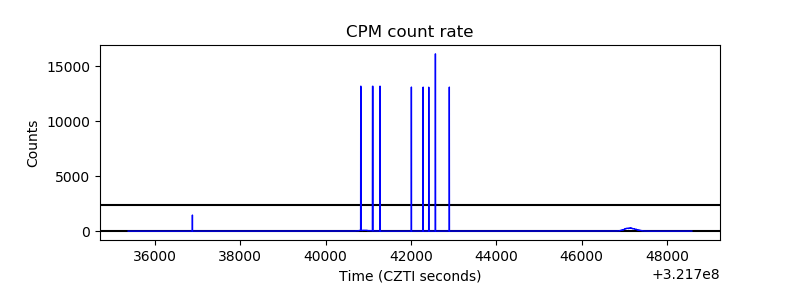 |
| CZT Counter | 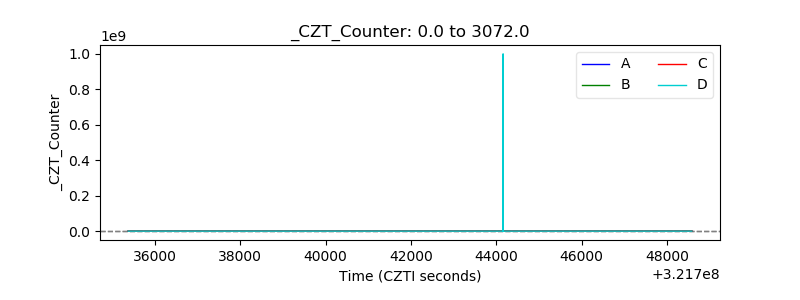 |
| +2.5 Volts monitor |  |
| +5 Volts monitor | 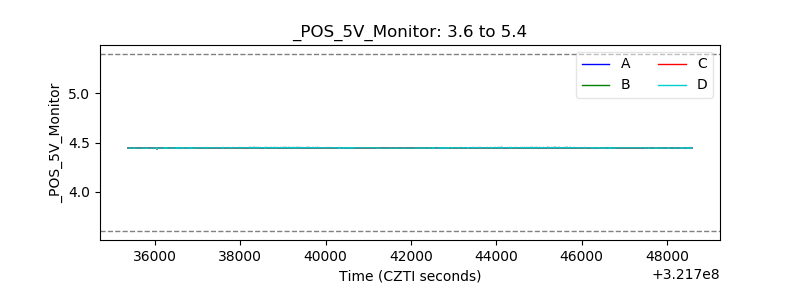 |
| _ROLL_ROT | 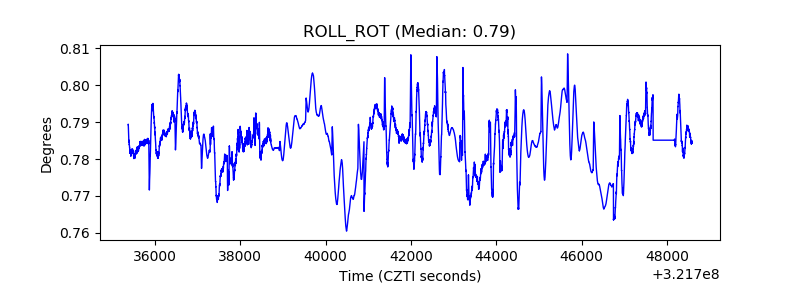 |
| _Roll_DEC | 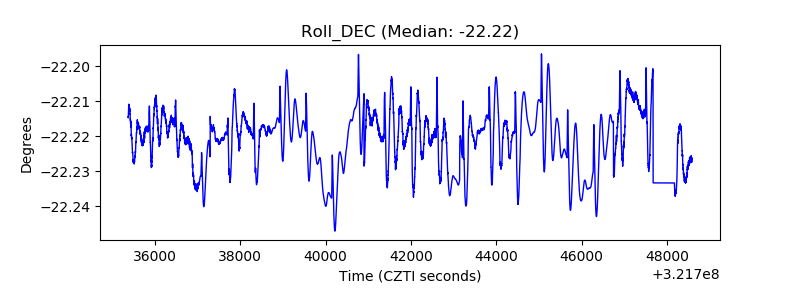 |
| _Roll_RA | 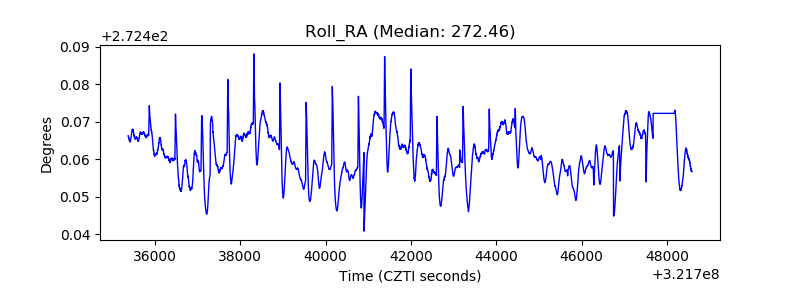 |
| Veto Counter | 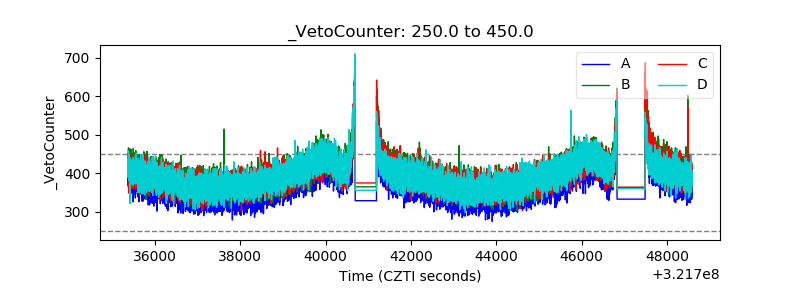 |