| Param | Original file | Final file |
|---|---|---|
| Filename | modeM0/AS1T03_182T01_9000003560_24098cztM0_level2.evt | modeM0/AS1T03_182T01_9000003560_24098cztM0_level2_quad_clean.evt |
| Size (bytes) | 1,317,009,600 | 239,685,120 |
| Size | 1.2 GB | 228.6 MB |
| Events in quadrant A | 8,382,596 | 1,536,140 |
| Events in quadrant B | 8,852,246 | 1,542,541 |
| Events in quadrant C | 8,823,935 | 1,498,143 |
| Events in quadrant D | 12,628,893 | 1,460,405 |
| Mode SS | |||
|---|---|---|---|
| Quadrant | BADHDUFLAG | Total packets | Discarded packets |
| A | 0 | 360 | 0 |
| B | 0 | 360 | 0 |
| C | 0 | 360 | 0 |
| D | 0 | 360 | 0 |
| Mode M9 | |||
|---|---|---|---|
| Quadrant | BADHDUFLAG | Total packets | Discarded packets |
| A | 0 | 21 | 0 |
| B | 0 | 21 | 0 |
| C | 0 | 21 | 0 |
| D | 0 | 21 | 0 |
| Mode M0 | |||
|---|---|---|---|
| Quadrant | BADHDUFLAG | Total packets | Discarded packets |
| A | 0 | 36282 | 3 |
| B | 0 | 37517 | 3 |
| C | 0 | 36692 | 3 |
| D | 0 | 49623 | 3 |
| Quadrant | Total seconds | Saturated seconds | Saturation percentage |
|---|---|---|---|
| A | 17740 | 68 | 0.383315% |
| B | 17741 | 190 | 1.070966% |
| C | 17741 | 159 | 0.896229% |
| D | 17741 | 789 | 4.447325% |
Noise dominated data is calculated using 1-second bins in cleaned event files. If a bin has >2000 counts, and if more than 50% of those come from <1% of pixels, then it is considered to be noise-dominated and hence unusable.
| Quadrant | # 1 sec bins | Bins with >0 counts | Bins with >2000 counts | High rate bins dominated by noise | Noise dominated (total time) | Noise dominated (detector-on time) | Marked lightcurve |
|---|---|---|---|---|---|---|---|
| A | 19725 | 17742 | 0 | 0 | 0.00% | 0.00% | 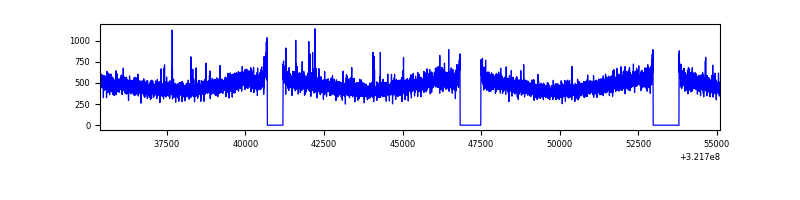 |
| B | 19726 | 17743 | 59 | 59 | 0.30% | 0.33% | 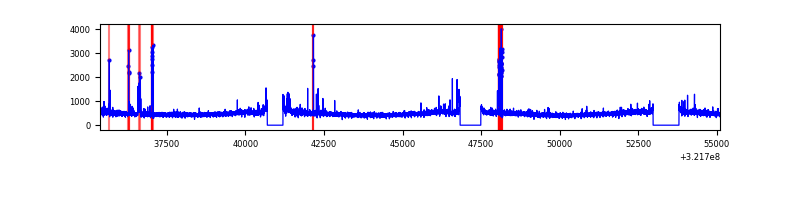 |
| C | 19726 | 17744 | 1 | 1 | 0.01% | 0.01% | 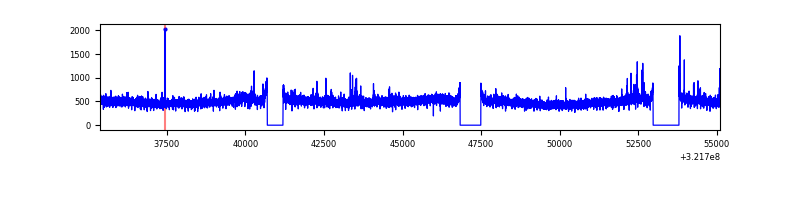 |
| D | 19726 | 17743 | 563 | 563 | 2.85% | 3.17% | 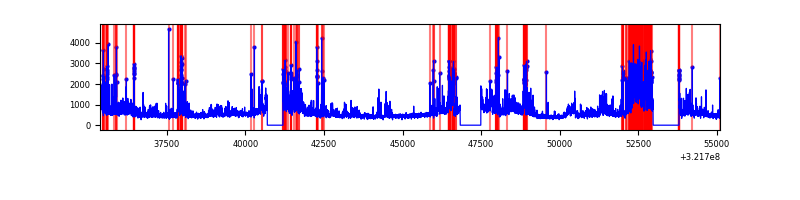 |
Top three noisy pixels from each quadrant. If the there are fewer than three noisy pixels in the level2.evt file, extra rows are filled as -1
| Pixel properties | Quadrant properties | ||||||
|---|---|---|---|---|---|---|---|
| Quadrant | DetID | PixID | Counts | Sigma | Mean | Median | Sigma |
| A | 13 | 254 | 32054 | 68.72 | 2159 | 2111 | 435.7 |
| A | 2 | 250 | 30348 | 64.81 | 2159 | 2111 | 435.7 |
| A | 6 | 16 | 27949 | 59.3 | 2159 | 2111 | 435.7 |
| B | 0 | 245 | 167156 | 404.19 | 2148 | 2090 | 408.4 |
| B | 15 | 32 | 78445 | 186.97 | 2148 | 2090 | 408.4 |
| B | 5 | 172 | 55513 | 130.81 | 2148 | 2090 | 408.4 |
| C | 14 | 238 | 324792 | 656.92 | 2081 | 2093 | 491.2 |
| C | 7 | 247 | 229042 | 462.0 | 2081 | 2093 | 491.2 |
| C | 0 | 239 | 85348 | 169.48 | 2081 | 2093 | 491.2 |
| D | 12 | 218 | 2248161 | 4461.13 | 2070 | 2012 | 503.5 |
| D | 8 | 195 | 1205369 | 2390.01 | 2070 | 2012 | 503.5 |
| D | 11 | 176 | 676094 | 1338.81 | 2070 | 2012 | 503.5 |
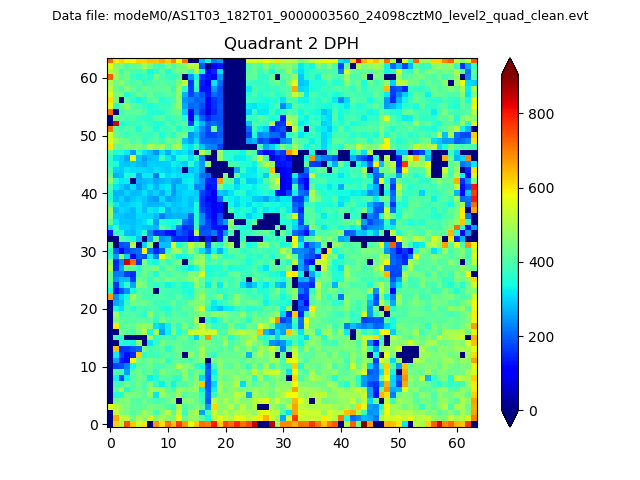
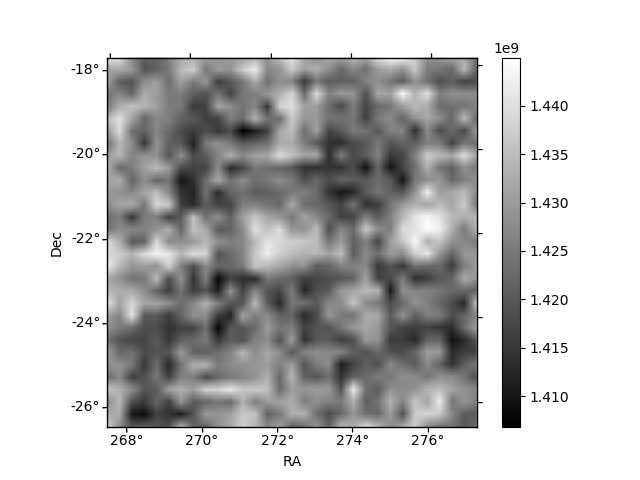
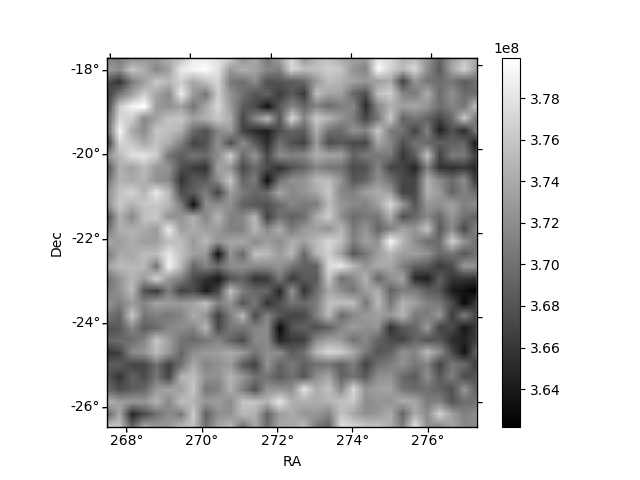
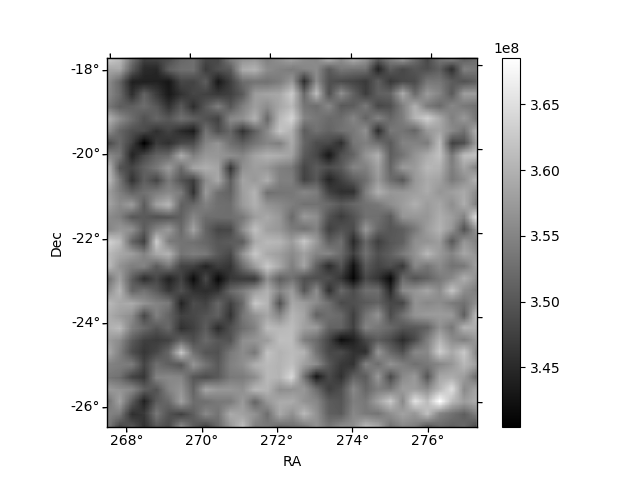
Histogram calculated using DETX and DETY for each event in the final _common_clean file
| Quadrant A | 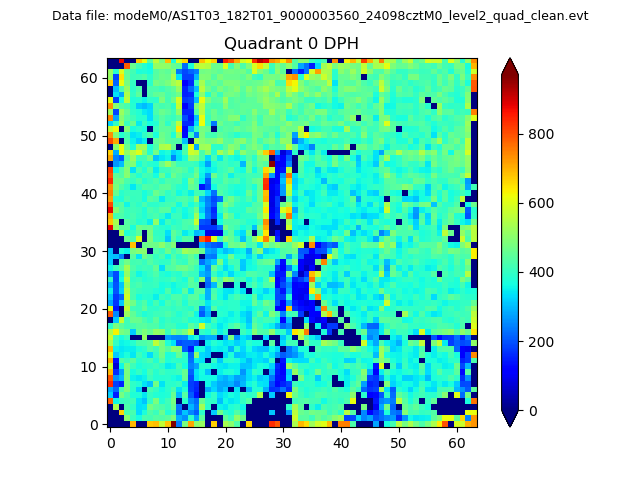 |
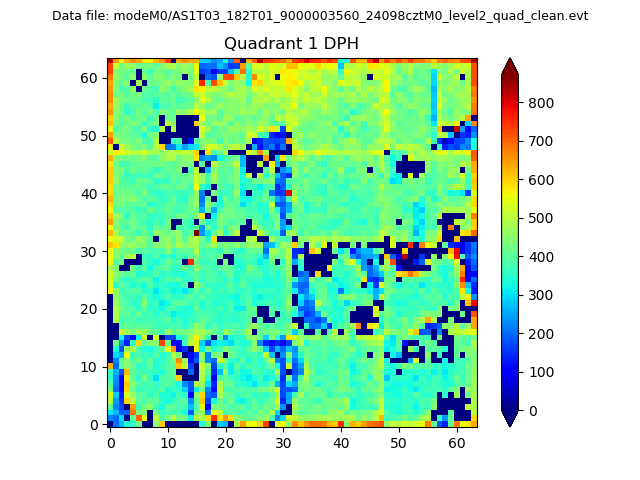 |
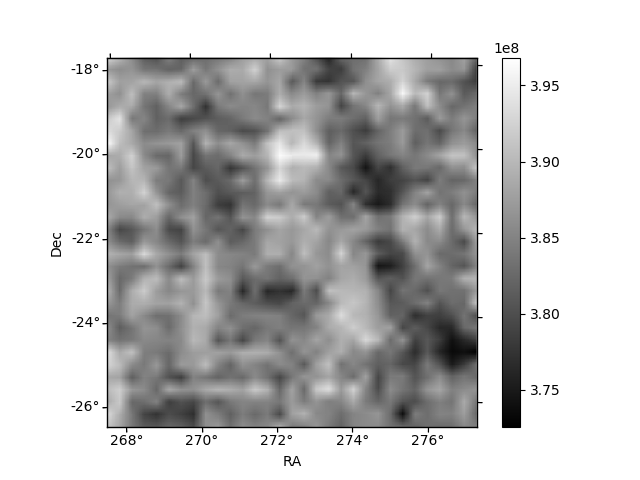
Quadrant B |
|---|---|---|---|
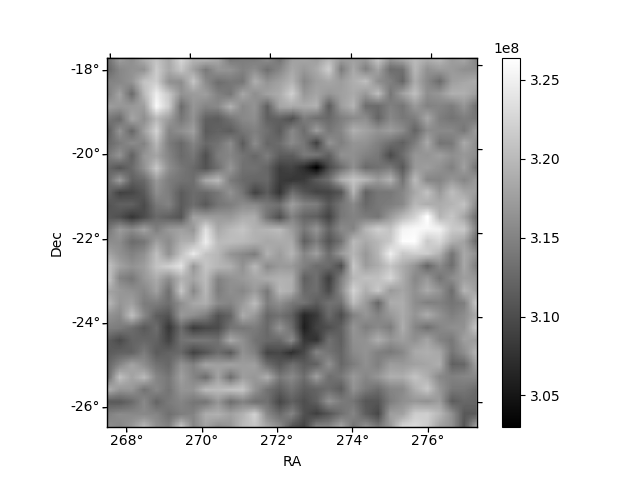
| Quadrant D | 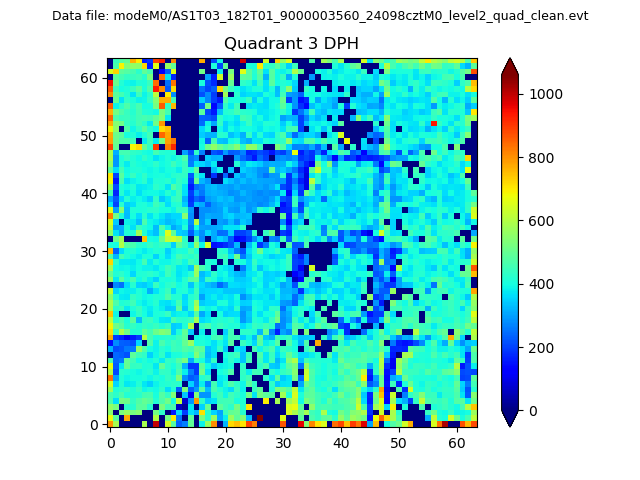 |
 |
Quadrant C |
| Plot type | Count rate plots | Images |
|---|---|---|
| Comparison with Poisson distribution Blue bars denote a histogram of data divided into 1 sec bins. Red curve is a Poisson curve with rate = median count rate of data. |
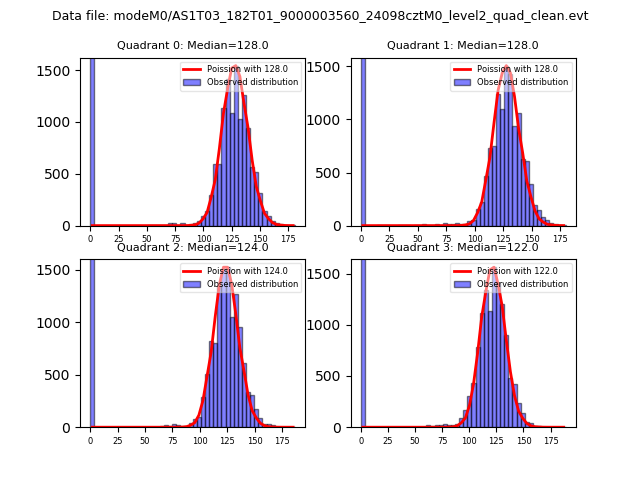 |
 |
| Quadrant-wise count rates Data is divided into 100 sec bins |
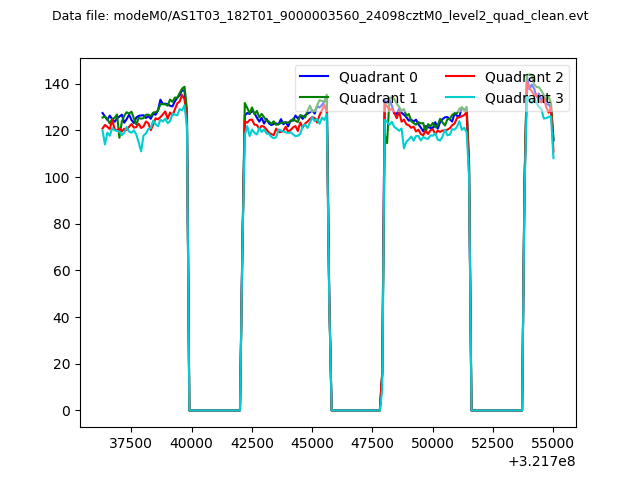 |
|
| Module-wise count rates for Quadrant A Data is divided into 100 sec bins |
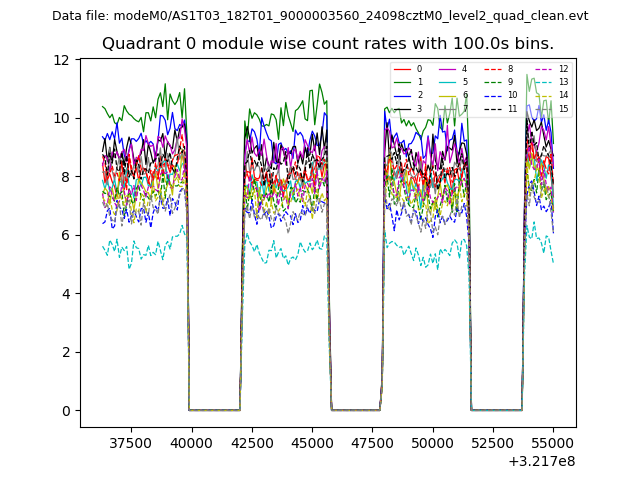 |
 |
| Module-wise count rates for Quadrant B Data is divided into 100 sec bins |
 |
 |
| Module-wise count rates for Quadrant C Data is divided into 100 sec bins |
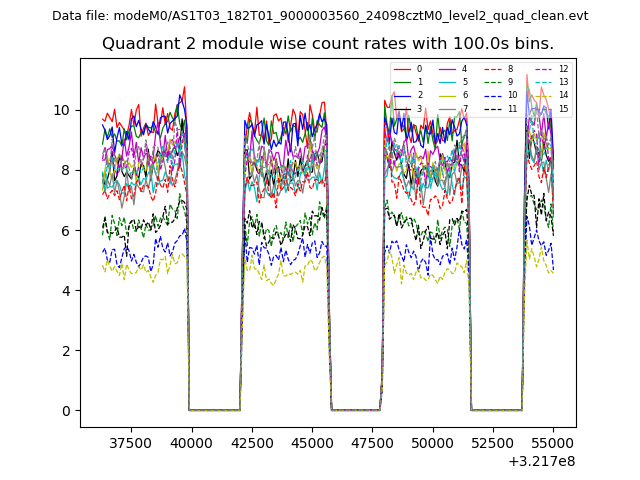 |
 |
| Module-wise count rates for Quadrant D Data is divided into 100 sec bins |
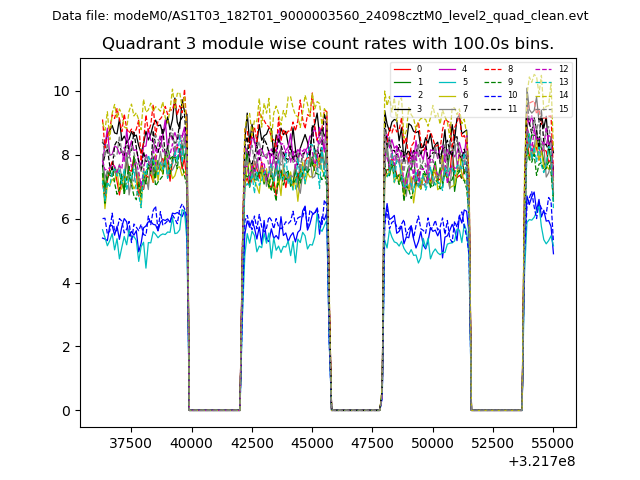 |
 |
| Parameter | Plot |
|---|---|
| CZT HV Monitor | 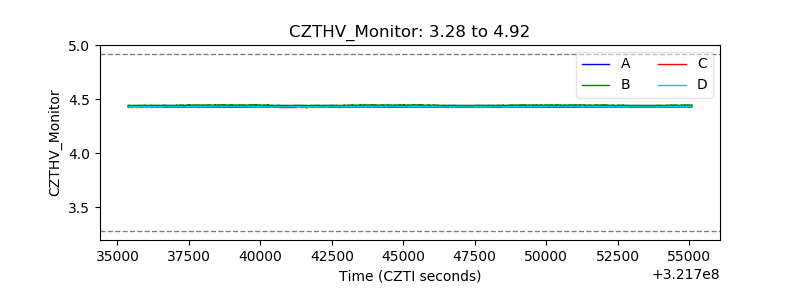 |
| D_VDD | 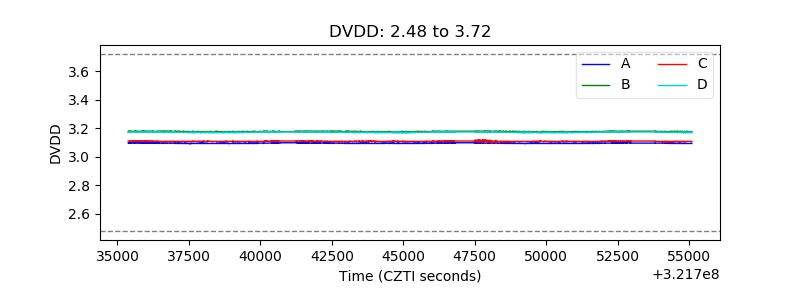 |
| Temperature 1 | 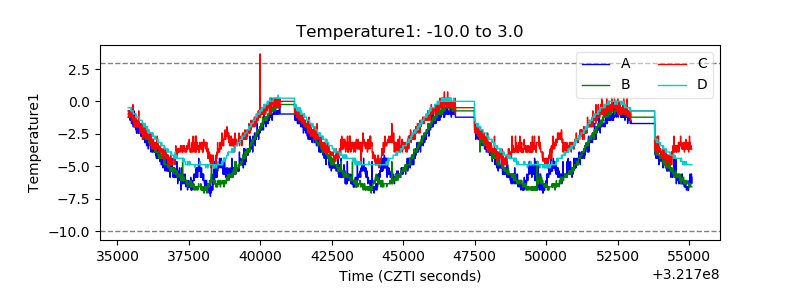 |
| Veto HV Monitor | 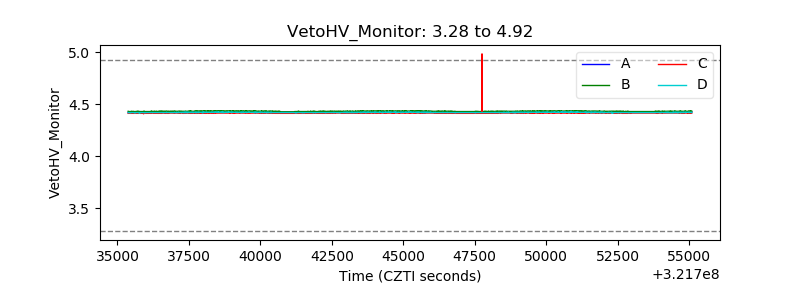 |
| Veto LLD | 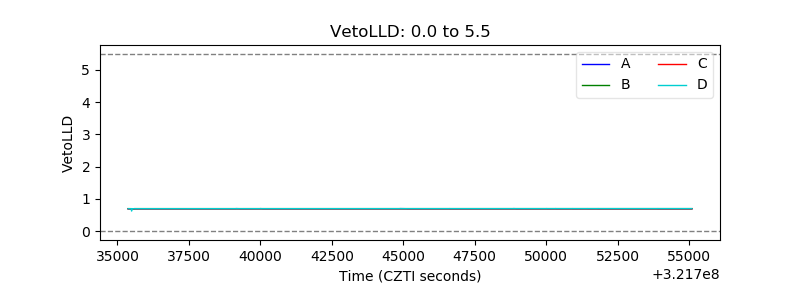 |
| Alpha Counter |  |
| _CPM_Rate | 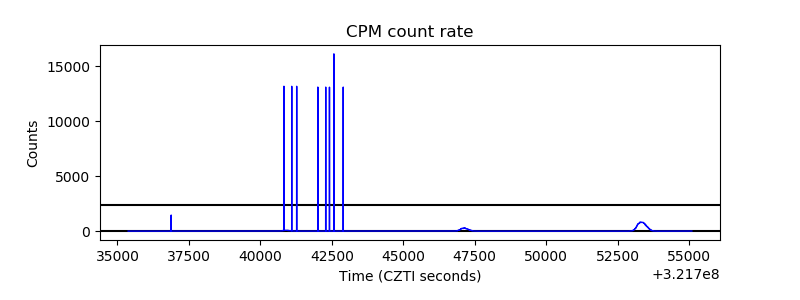 |
| CZT Counter | 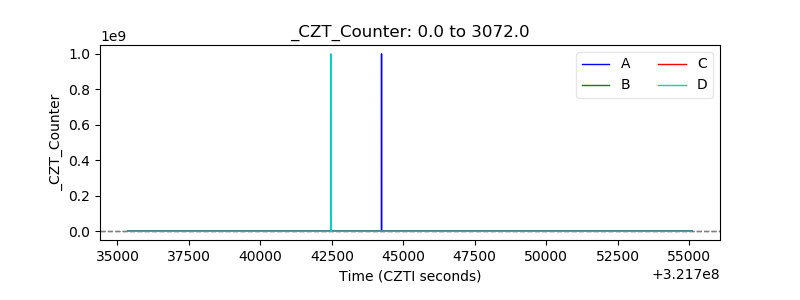 |
| +2.5 Volts monitor | 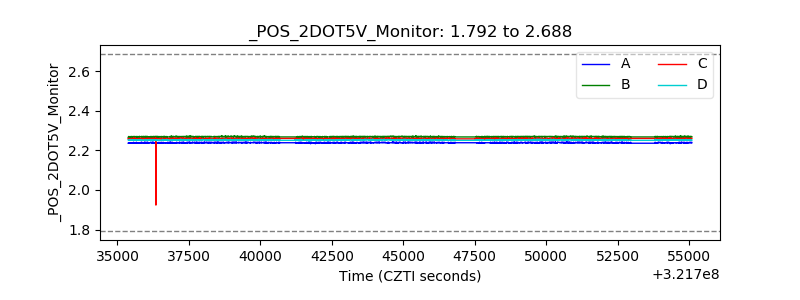 |
| +5 Volts monitor | 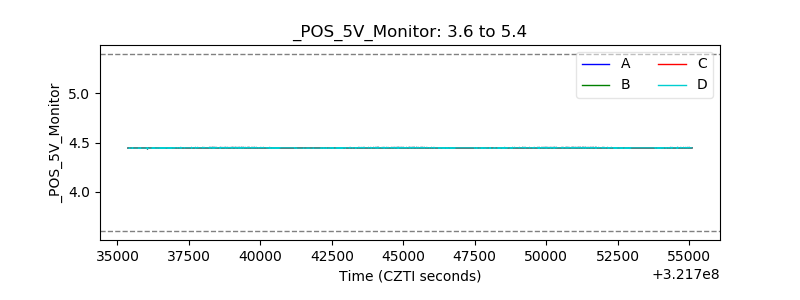 |
| _ROLL_ROT | 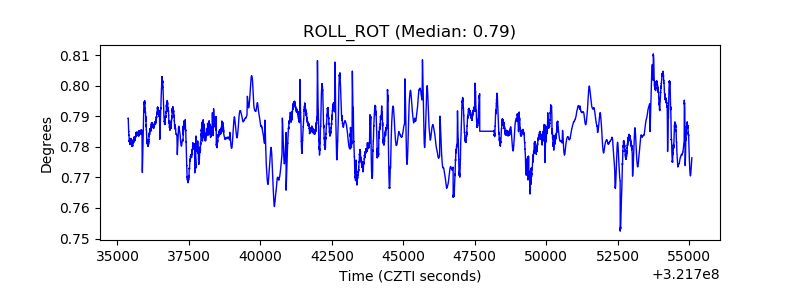 |
| _Roll_DEC | 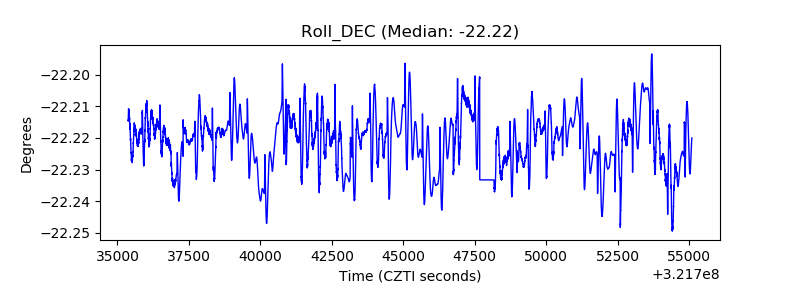 |
| _Roll_RA | 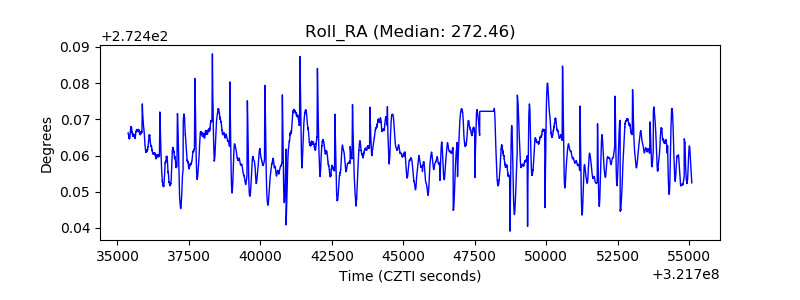 |
| Veto Counter | 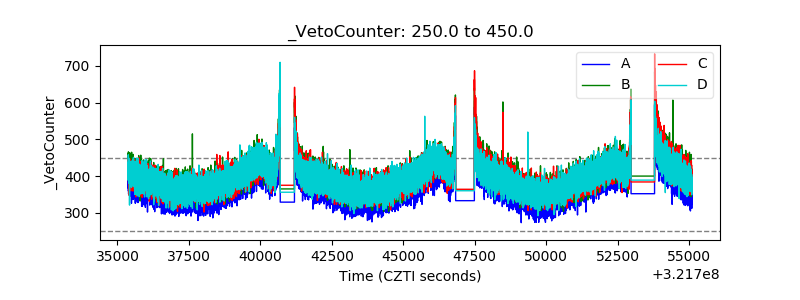 |