| Param | Original file | Final file |
|---|---|---|
| Filename | modeM0/AS1A07_027T15_9000003562_24095cztM0_level2.evt | modeM0/AS1A07_027T15_9000003562_24095cztM0_level2_quad_clean.evt |
| Size (bytes) | 334,751,040 | 15,842,880 |
| Size | 319.2 MB | 15.1 MB |
| Events in quadrant A | 2,394,960 | 36,896 |
| Events in quadrant B | 2,349,468 | 37,323 |
| Events in quadrant C | 2,381,620 | 35,160 |
| Events in quadrant D | 2,687,669 | 35,198 |
| Mode M0 | |||
|---|---|---|---|
| Quadrant | BADHDUFLAG | Total packets | Discarded packets |
| A | 0 | 9986 | 1 |
| B | 0 | 9874 | 1 |
| C | 0 | 9985 | 1 |
| D | 0 | 11121 | 1 |
| Mode SS | |||
|---|---|---|---|
| Quadrant | BADHDUFLAG | Total packets | Discarded packets |
| A | 0 | 98 | 0 |
| B | 0 | 98 | 0 |
| C | 0 | 98 | 0 |
| D | 0 | 98 | 0 |
| Mode M9 | |||
|---|---|---|---|
| Quadrant | BADHDUFLAG | Total packets | Discarded packets |
| A | 0 | 9 | 0 |
| B | 0 | 9 | 0 |
| C | 0 | 9 | 0 |
| D | 0 | 9 | 0 |
| Quadrant | Total seconds | Saturated seconds | Saturation percentage |
|---|---|---|---|
| A | 4753 | 56 | 1.178203% |
| B | 4753 | 44 | 0.925731% |
| C | 4753 | 74 | 1.556911% |
| D | 4753 | 49 | 1.030928% |
Noise dominated data is calculated using 1-second bins in cleaned event files. If a bin has >2000 counts, and if more than 50% of those come from <1% of pixels, then it is considered to be noise-dominated and hence unusable.
| Quadrant | # 1 sec bins | Bins with >0 counts | Bins with >2000 counts | High rate bins dominated by noise | Noise dominated (total time) | Noise dominated (detector-on time) | Marked lightcurve |
|---|---|---|---|---|---|---|---|
| A | 5688 | 4753 | 12 | 12 | 0.21% | 0.25% |  |
| B | 5688 | 4753 | 6 | 6 | 0.11% | 0.13% |  |
| C | 5688 | 4753 | 1 | 1 | 0.02% | 0.02% | 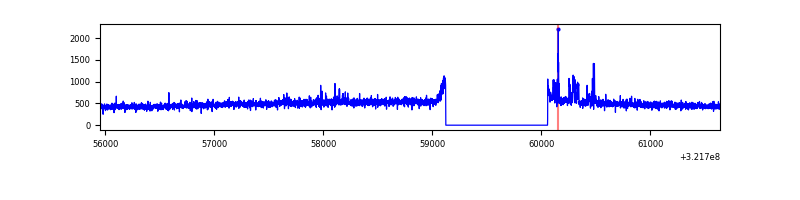 |
| D | 5688 | 4753 | 15 | 15 | 0.26% | 0.32% | 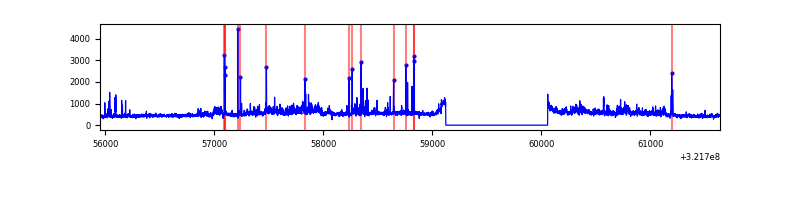 |
Top three noisy pixels from each quadrant. If the there are fewer than three noisy pixels in the level2.evt file, extra rows are filled as -1
| Pixel properties | Quadrant properties | ||||||
|---|---|---|---|---|---|---|---|
| Quadrant | DetID | PixID | Counts | Sigma | Mean | Median | Sigma |
| A | 6 | 16 | 62600 | 508.31 | 599 | 585 | 122.0 |
| A | 2 | 250 | 23118 | 184.69 | 599 | 585 | 122.0 |
| A | 13 | 254 | 8301 | 63.24 | 599 | 585 | 122.0 |
| B | 4 | 216 | 15973 | 132.77 | 594 | 579 | 115.9 |
| B | 12 | 111 | 14012 | 115.85 | 594 | 579 | 115.9 |
| B | 11 | 111 | 12409 | 102.03 | 594 | 579 | 115.9 |
| C | 14 | 238 | 90507 | 668.77 | 569 | 572 | 134.5 |
| C | 0 | 239 | 69197 | 510.3 | 569 | 572 | 134.5 |
| C | 13 | 61 | 3868 | 24.51 | 569 | 572 | 134.5 |
| D | 8 | 195 | 242752 | 1680.03 | 583 | 567 | 144.2 |
| D | 12 | 218 | 155725 | 1076.33 | 583 | 567 | 144.2 |
| D | 11 | 176 | 39102 | 267.32 | 583 | 567 | 144.2 |
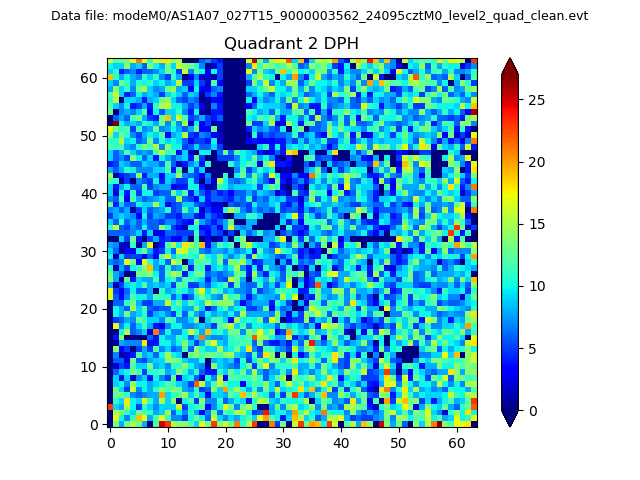
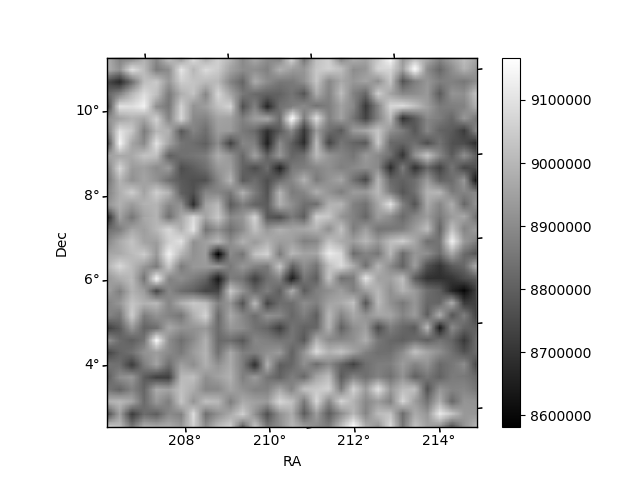
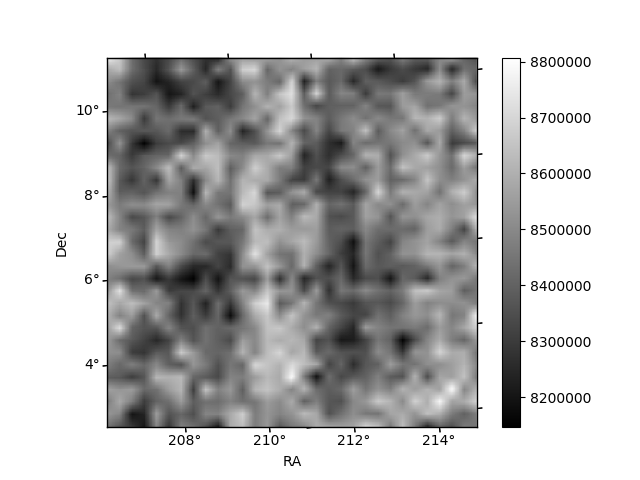
Histogram calculated using DETX and DETY for each event in the final _common_clean file
| Quadrant A | 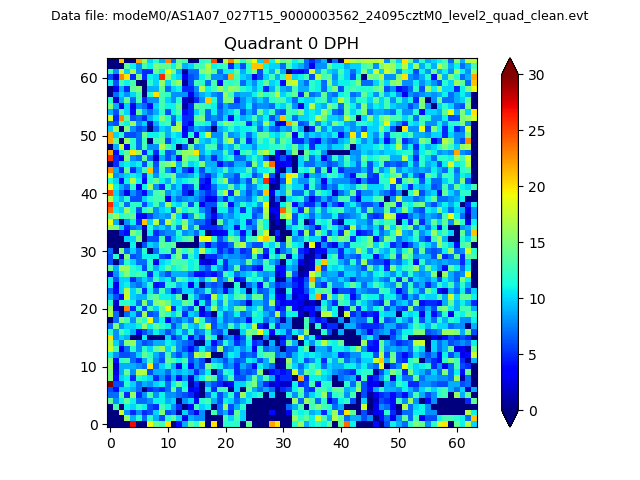 |
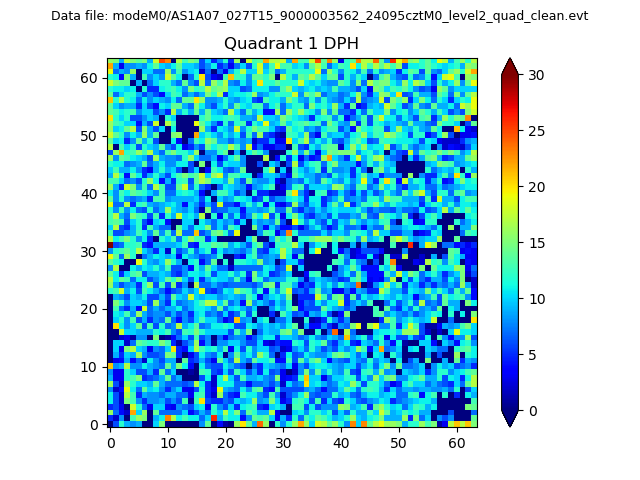 |
Quadrant B |
|---|---|---|---|
| Quadrant D | 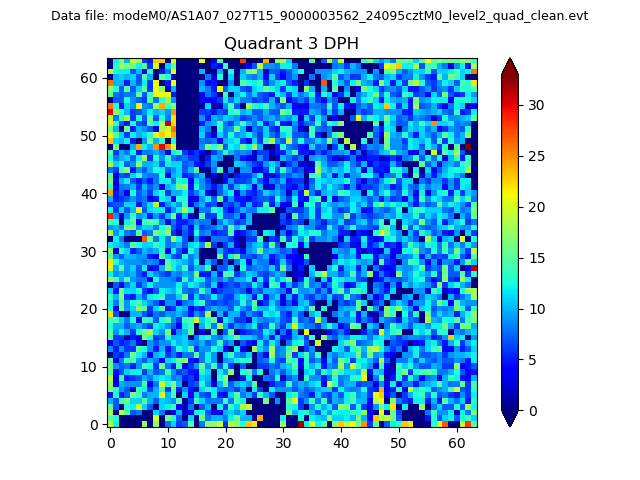 |
 |
Quadrant C |
| Plot type | Count rate plots | Images |
|---|---|---|
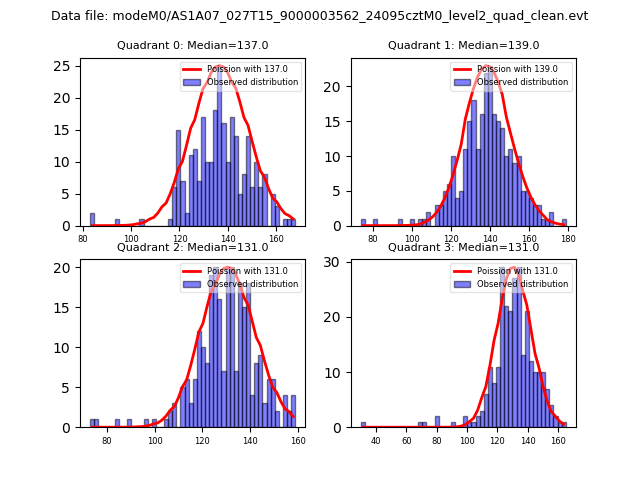
| Comparison with Poisson distribution Blue bars denote a histogram of data divided into 1 sec bins. Red curve is a Poisson curve with rate = median count rate of data. |
 |
 |
| Quadrant-wise count rates Data is divided into 100 sec bins |
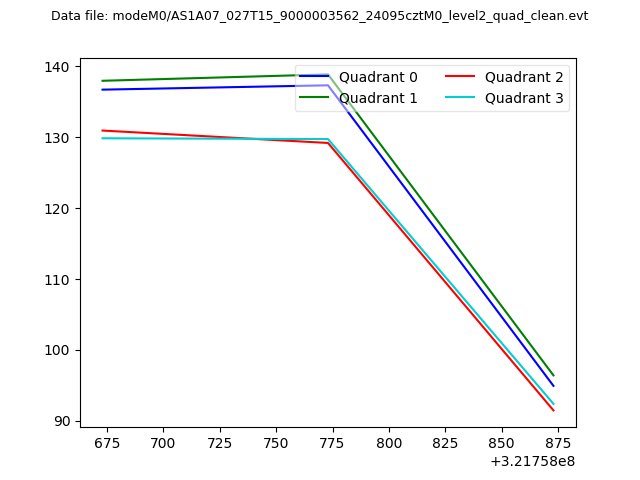 |
|
| Module-wise count rates for Quadrant A Data is divided into 100 sec bins |
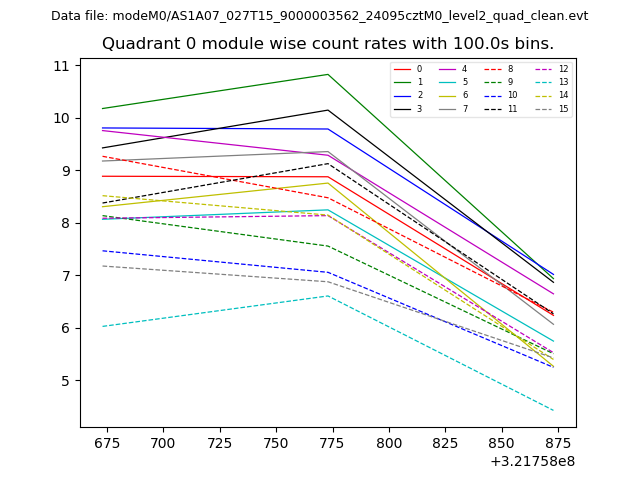 |
 |
| Module-wise count rates for Quadrant B Data is divided into 100 sec bins |
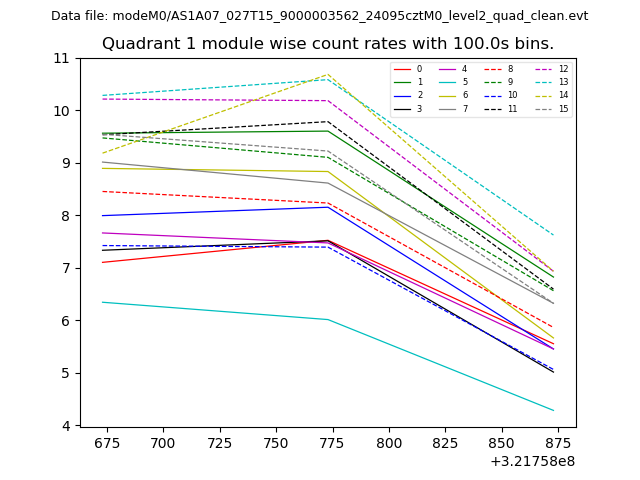 |
 |
| Module-wise count rates for Quadrant C Data is divided into 100 sec bins |
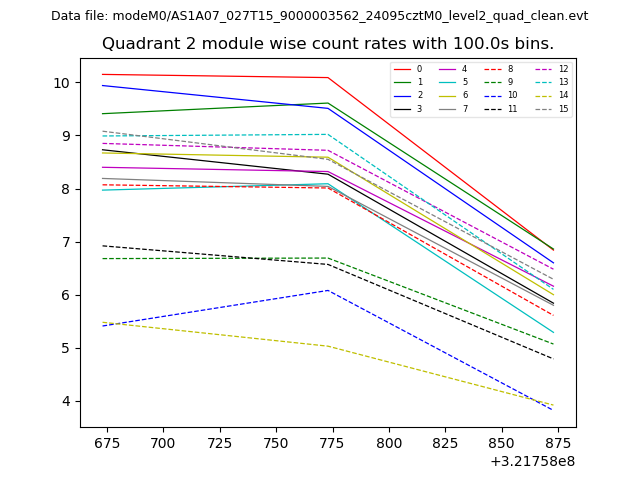 |
 |
| Module-wise count rates for Quadrant D Data is divided into 100 sec bins |
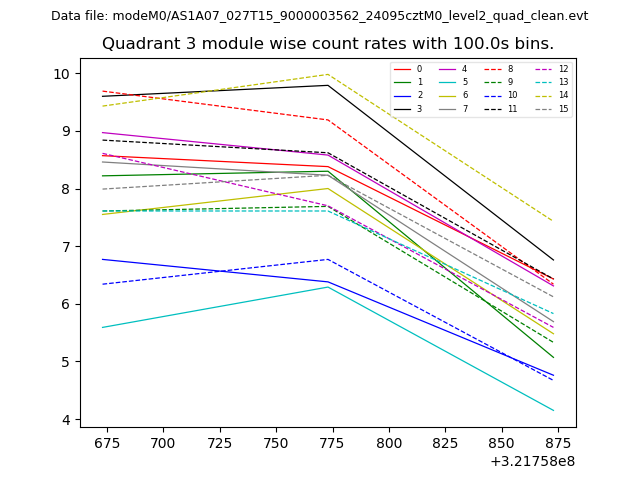 |
 |
| Parameter | Plot |
|---|---|
| CZT HV Monitor | 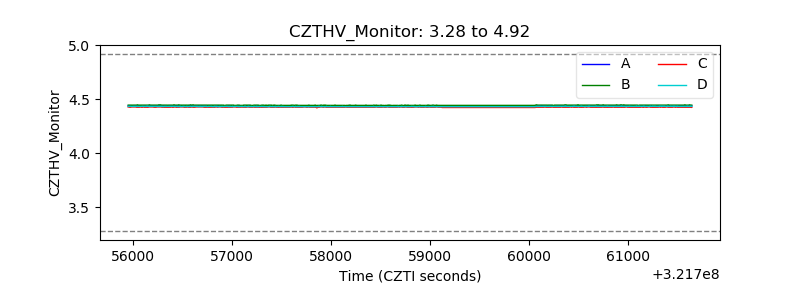 |
| D_VDD | 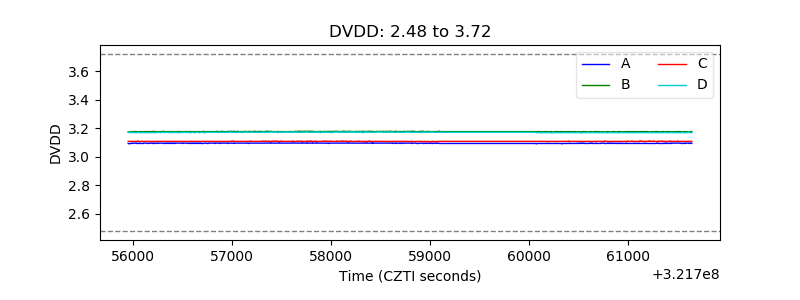 |
| Temperature 1 | 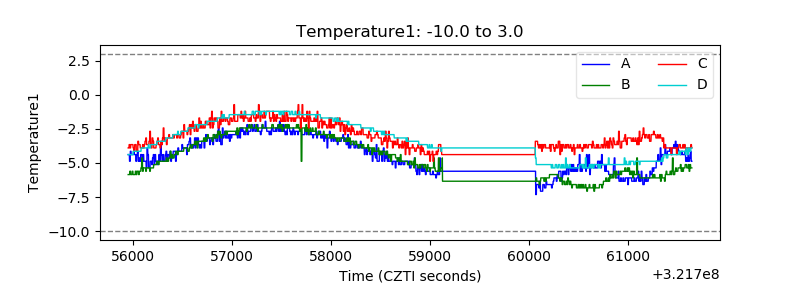 |
| Veto HV Monitor | 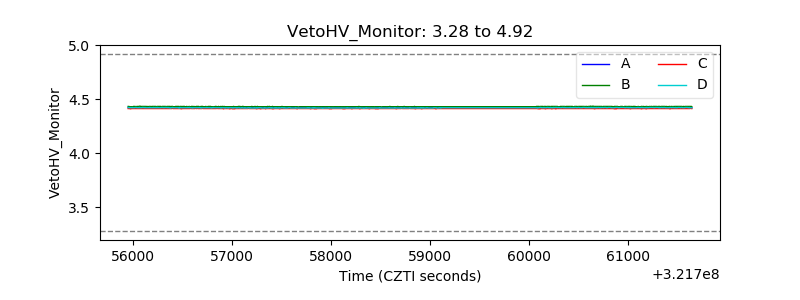 |
| Veto LLD |  |
| Alpha Counter | 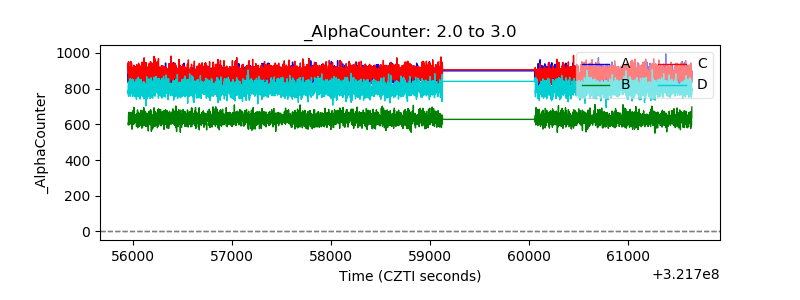 |
| _CPM_Rate | 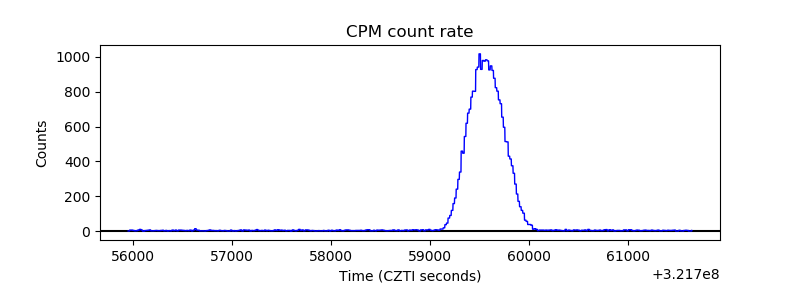 |
| CZT Counter | 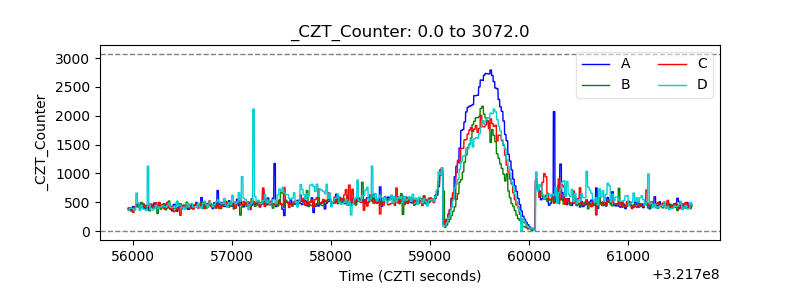 |
| +2.5 Volts monitor |  |
| +5 Volts monitor |  |
| _ROLL_ROT | 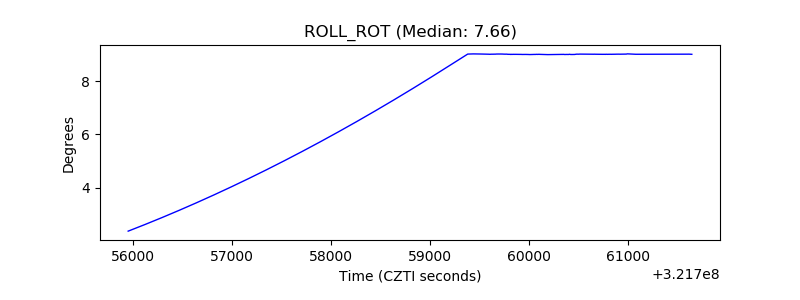 |
| _Roll_DEC | 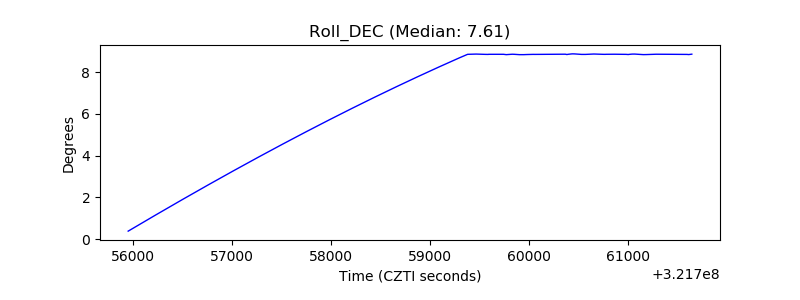 |
| _Roll_RA | 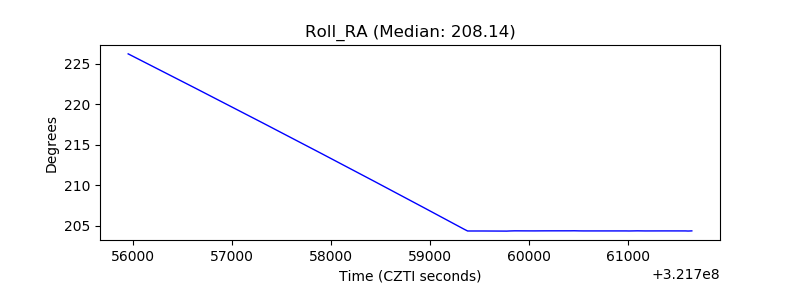 |
| Veto Counter | 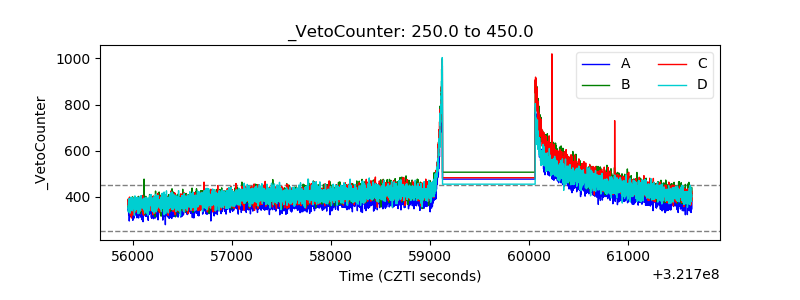 |