| Param | Original file | Final file |
|---|---|---|
| Filename | modeM0/AS1A07_027T15_9000003562_24097cztM0_level2.evt | modeM0/AS1A07_027T15_9000003562_24097cztM0_level2_quad_clean.evt |
| Size (bytes) | 430,871,040 | 87,658,560 |
| Size | 410.9 MB | 83.6 MB |
| Events in quadrant A | 2,916,611 | 576,479 |
| Events in quadrant B | 3,134,865 | 586,752 |
| Events in quadrant C | 2,840,429 | 558,328 |
| Events in quadrant D | 3,768,777 | 533,762 |
| Mode M0 | |||
|---|---|---|---|
| Quadrant | BADHDUFLAG | Total packets | Discarded packets |
| A | 0 | 14040 | 1889 |
| B | 0 | 14902 | 2015 |
| C | 0 | 13948 | 1962 |
| D | 0 | 20210 | 5371 |
| Mode SS | |||
|---|---|---|---|
| Quadrant | BADHDUFLAG | Total packets | Discarded packets |
| A | 0 | 134 | 14 |
| B | 0 | 136 | 24 |
| C | 0 | 132 | 18 |
| D | 0 | 135 | 21 |
| Mode M9 | |||
|---|---|---|---|
| Quadrant | BADHDUFLAG | Total packets | Discarded packets |
| A | 0 | 18 | 0 |
| B | 0 | 18 | 0 |
| C | 0 | 18 | 0 |
| D | 0 | 18 | 0 |
| Quadrant | Total seconds | Saturated seconds | Saturation percentage |
|---|---|---|---|
| A | 5774 | 49 | 0.848632% |
| B | 5747 | 82 | 1.426831% |
| C | 5747 | 60 | 1.044023% |
| D | 5567 | 269 | 4.832046% |
Noise dominated data is calculated using 1-second bins in cleaned event files. If a bin has >2000 counts, and if more than 50% of those come from <1% of pixels, then it is considered to be noise-dominated and hence unusable.
| Quadrant | # 1 sec bins | Bins with >0 counts | Bins with >2000 counts | High rate bins dominated by noise | Noise dominated (total time) | Noise dominated (detector-on time) | Marked lightcurve |
|---|---|---|---|---|---|---|---|
| A | 7793 | 6000 | 11 | 11 | 0.14% | 0.18% | 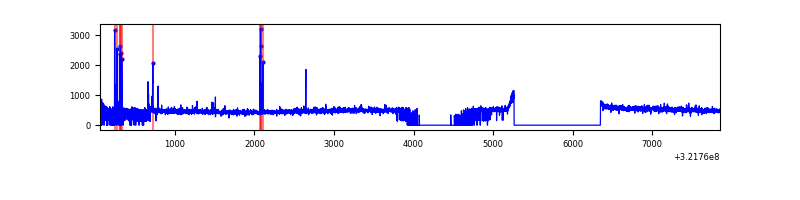 |
| B | 7793 | 5978 | 11 | 11 | 0.14% | 0.18% | 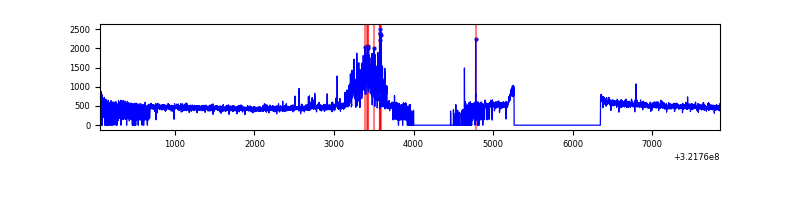 |
| C | 7793 | 5998 | 0 | 0 | 0.00% | 0.00% | 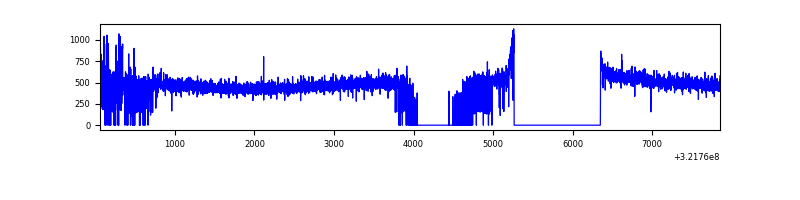 |
| D | 7793 | 5795 | 205 | 205 | 2.63% | 3.54% |  |
Top three noisy pixels from each quadrant. If the there are fewer than three noisy pixels in the level2.evt file, extra rows are filled as -1
| Pixel properties | Quadrant properties | ||||||
|---|---|---|---|---|---|---|---|
| Quadrant | DetID | PixID | Counts | Sigma | Mean | Median | Sigma |
| A | 6 | 16 | 79456 | 535.77 | 730 | 716 | 147.0 |
| A | 2 | 250 | 21681 | 142.65 | 730 | 716 | 147.0 |
| A | 13 | 254 | 9872 | 62.3 | 730 | 716 | 147.0 |
| B | 15 | 33 | 175418 | 1270.15 | 717 | 700 | 137.6 |
| B | 0 | 190 | 146410 | 1059.27 | 717 | 700 | 137.6 |
| B | 12 | 111 | 16214 | 112.78 | 717 | 700 | 137.6 |
| C | 14 | 238 | 110641 | 686.48 | 690 | 696 | 160.2 |
| C | 0 | 239 | 35044 | 214.46 | 690 | 696 | 160.2 |
| C | 7 | 247 | 8694 | 49.94 | 690 | 696 | 160.2 |
| D | 8 | 195 | 613487 | 3754.54 | 668 | 649 | 163.2 |
| D | 12 | 233 | 428979 | 2624.15 | 668 | 649 | 163.2 |
| D | 12 | 218 | 56293 | 340.9 | 668 | 649 | 163.2 |
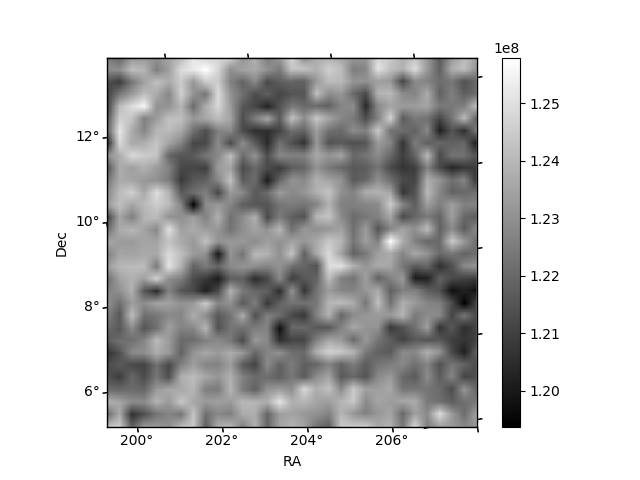
Histogram calculated using DETX and DETY for each event in the final _common_clean file
| Quadrant A | 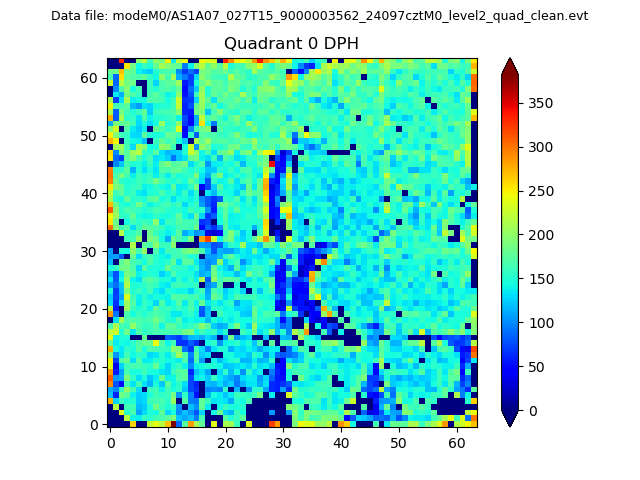 |
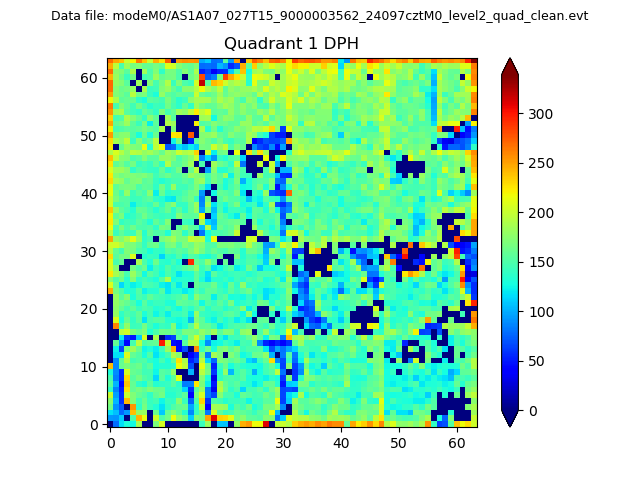 |
Quadrant B |
|---|---|---|---|
| Quadrant D |  |
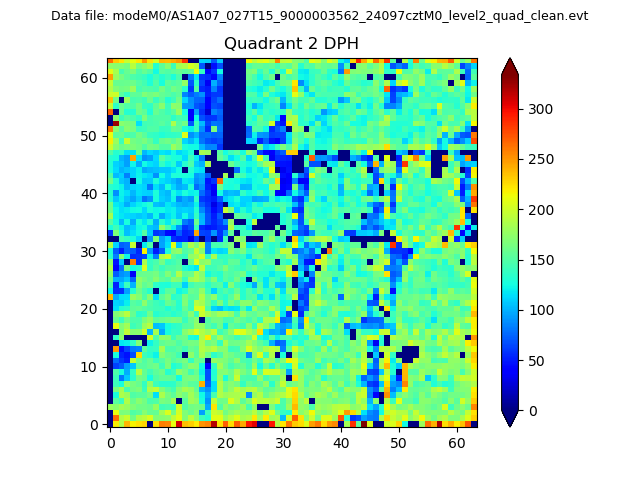 |
Quadrant C |
| Plot type | Count rate plots | Images |
|---|---|---|
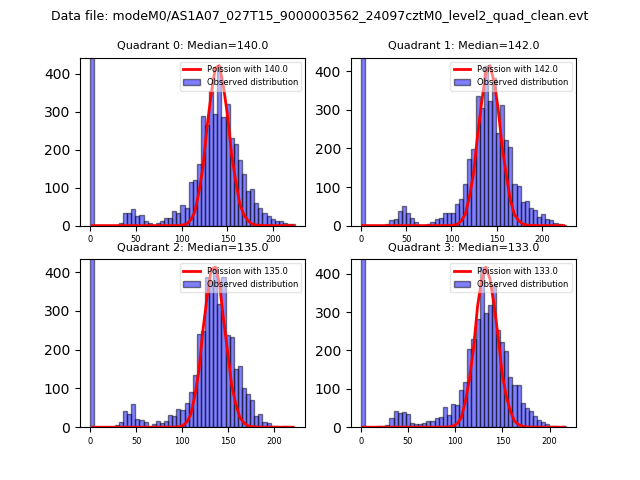
| Comparison with Poisson distribution Blue bars denote a histogram of data divided into 1 sec bins. Red curve is a Poisson curve with rate = median count rate of data. |
 |
 |
| Quadrant-wise count rates Data is divided into 100 sec bins |
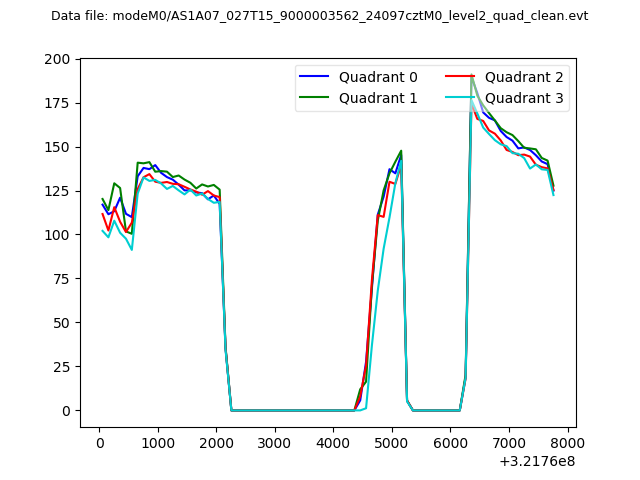 |
|
| Module-wise count rates for Quadrant A Data is divided into 100 sec bins |
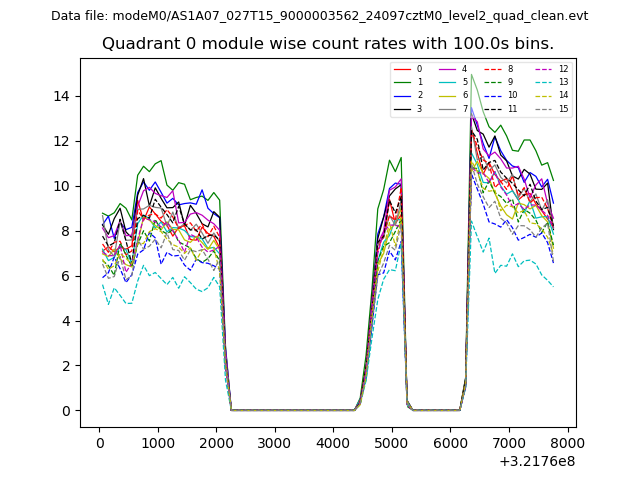 |
 |
| Module-wise count rates for Quadrant B Data is divided into 100 sec bins |
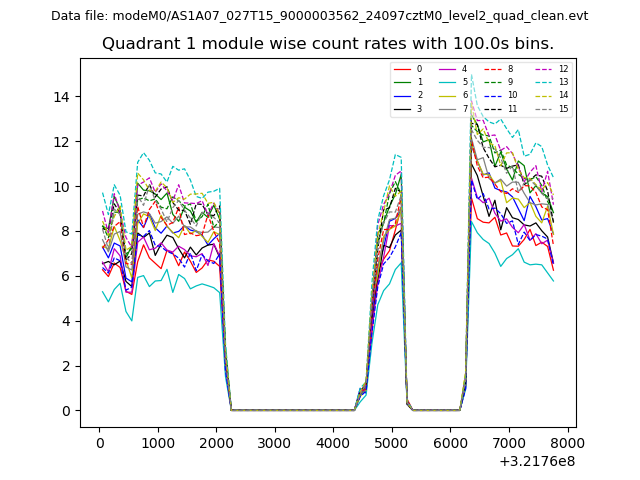 |
 |
| Module-wise count rates for Quadrant C Data is divided into 100 sec bins |
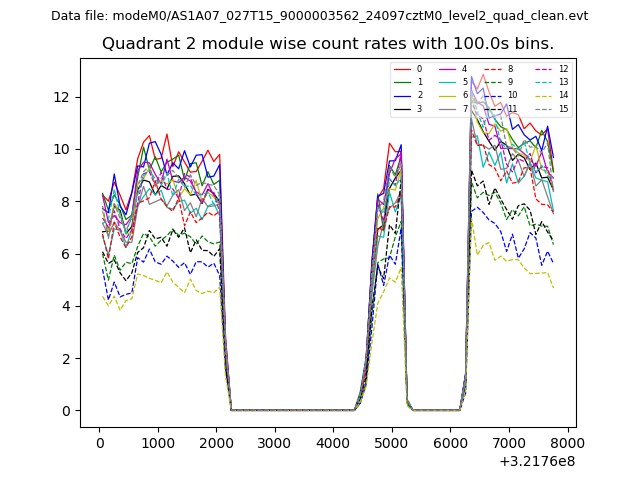 |
 |
| Module-wise count rates for Quadrant D Data is divided into 100 sec bins |
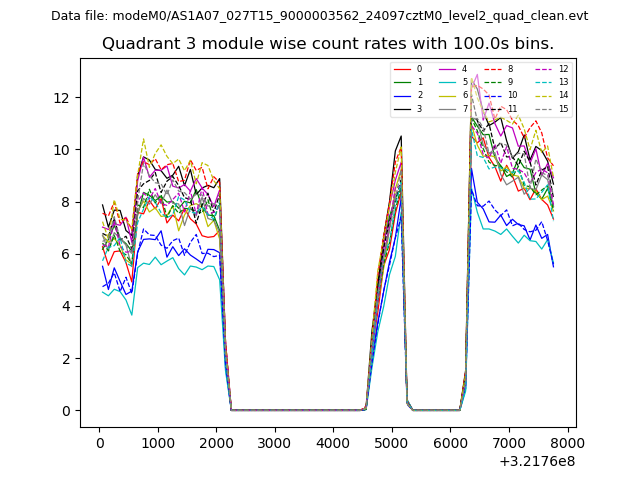 |
 |
| Parameter | Plot |
|---|---|
| CZT HV Monitor | 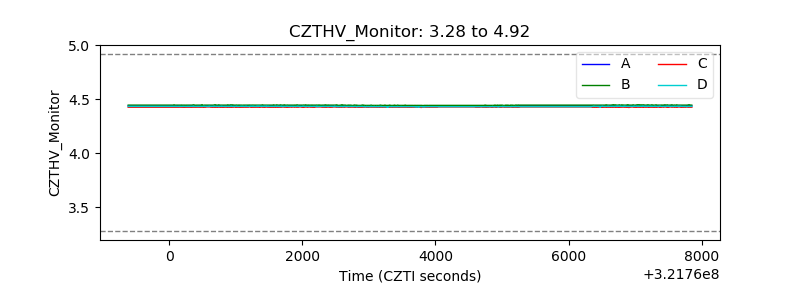 |
| D_VDD | 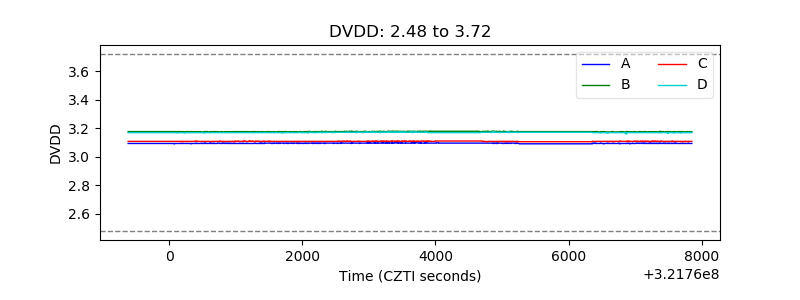 |
| Temperature 1 |  |
| Veto HV Monitor | 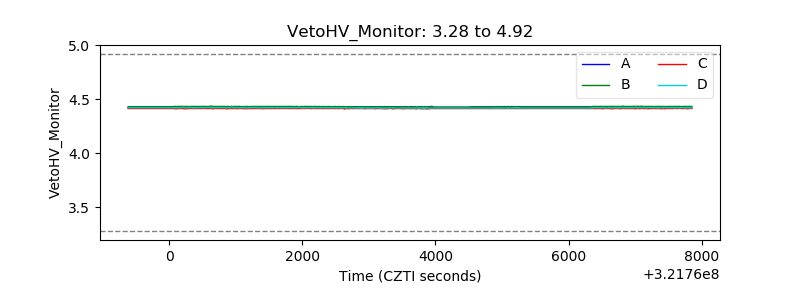 |
| Veto LLD | 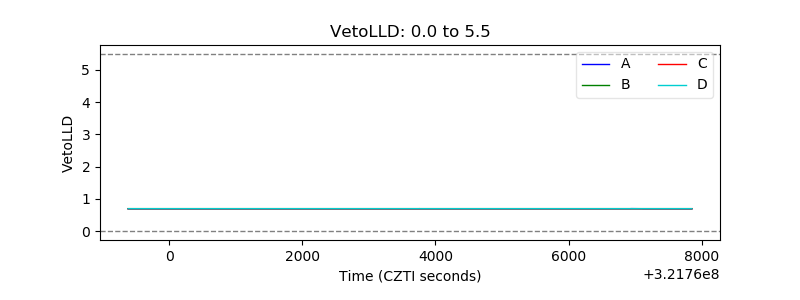 |
| Alpha Counter | 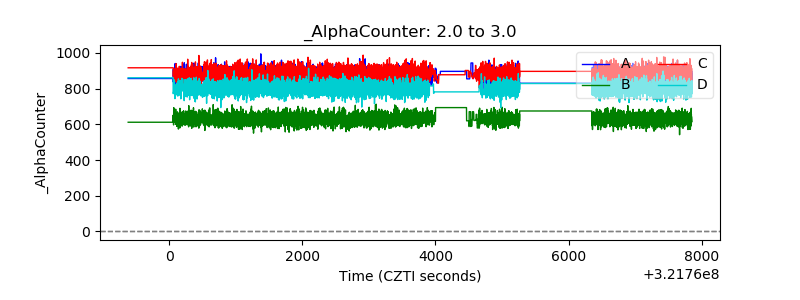 |
| _CPM_Rate | 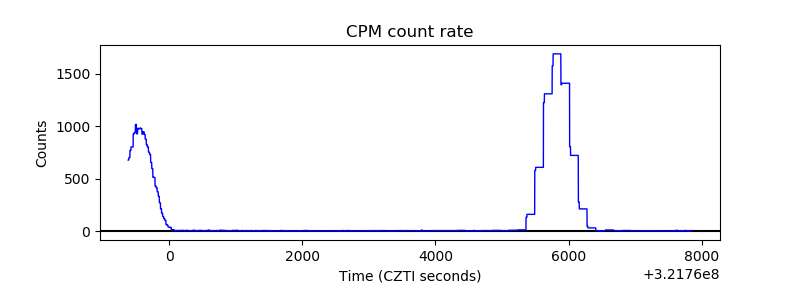 |
| CZT Counter | 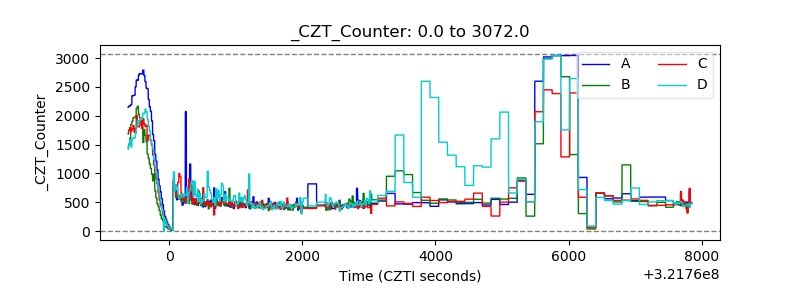 |
| +2.5 Volts monitor |  |
| +5 Volts monitor |  |
| _ROLL_ROT | 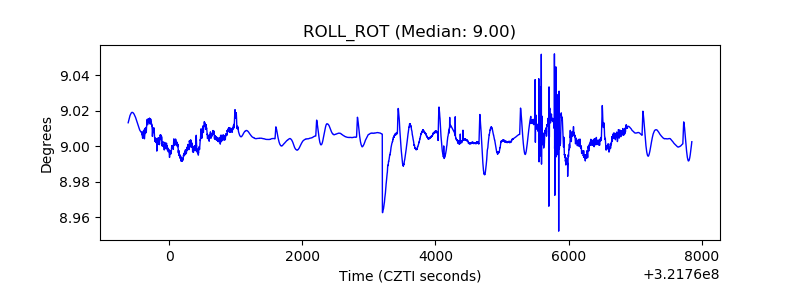 |
| _Roll_DEC | 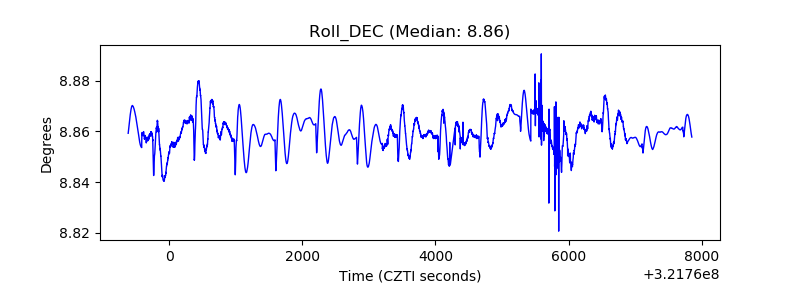 |
| _Roll_RA | 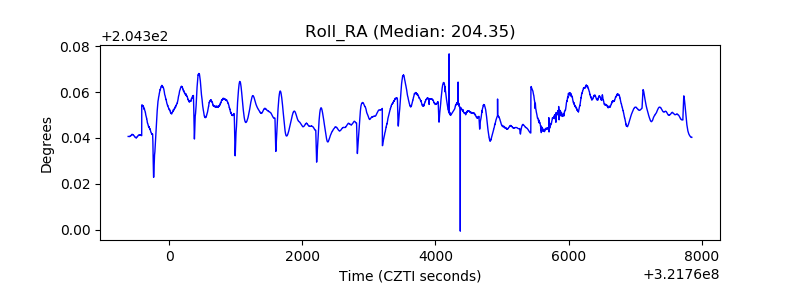 |
| Veto Counter | 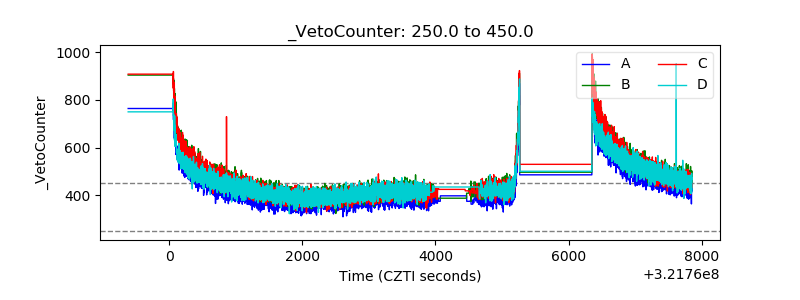 |