| Param | Original file | Final file |
|---|---|---|
| Filename | modeM0/AS1A07_027T15_9000003562_24099cztM0_level2.evt | modeM0/AS1A07_027T15_9000003562_24099cztM0_level2_quad_clean.evt |
| Size (bytes) | 507,182,400 | 92,488,320 |
| Size | 483.7 MB | 88.2 MB |
| Events in quadrant A | 3,460,985 | 606,786 |
| Events in quadrant B | 3,474,133 | 609,491 |
| Events in quadrant C | 3,396,906 | 578,503 |
| Events in quadrant D | 4,604,201 | 569,861 |
| Mode M0 | |||
|---|---|---|---|
| Quadrant | BADHDUFLAG | Total packets | Discarded packets |
| A | 0 | 13966 | 2 |
| B | 0 | 13957 | 2 |
| C | 0 | 13752 | 2 |
| D | 0 | 17761 | 2 |
| Mode SS | |||
|---|---|---|---|
| Quadrant | BADHDUFLAG | Total packets | Discarded packets |
| A | 0 | 126 | 0 |
| B | 0 | 126 | 0 |
| C | 0 | 126 | 0 |
| D | 0 | 126 | 0 |
| Mode M9 | |||
|---|---|---|---|
| Quadrant | BADHDUFLAG | Total packets | Discarded packets |
| A | 0 | 16 | 0 |
| B | 0 | 17 | 0 |
| C | 0 | 17 | 0 |
| D | 0 | 17 | 0 |
| Quadrant | Total seconds | Saturated seconds | Saturation percentage |
|---|---|---|---|
| A | 6256 | 41 | 0.655371% |
| B | 6256 | 56 | 0.895141% |
| C | 6256 | 59 | 0.943095% |
| D | 6256 | 227 | 3.628517% |
Noise dominated data is calculated using 1-second bins in cleaned event files. If a bin has >2000 counts, and if more than 50% of those come from <1% of pixels, then it is considered to be noise-dominated and hence unusable.
| Quadrant | # 1 sec bins | Bins with >0 counts | Bins with >2000 counts | High rate bins dominated by noise | Noise dominated (total time) | Noise dominated (detector-on time) | Marked lightcurve |
|---|---|---|---|---|---|---|---|
| A | 7546 | 6256 | 3 | 3 | 0.04% | 0.05% | 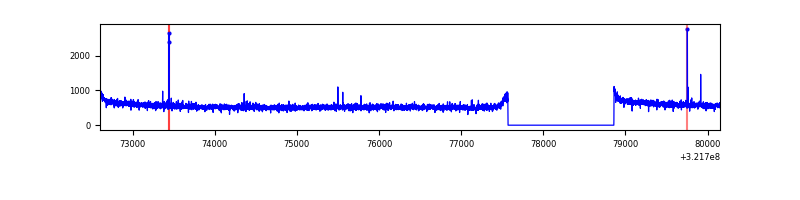 |
| B | 7546 | 6257 | 6 | 6 | 0.08% | 0.10% | 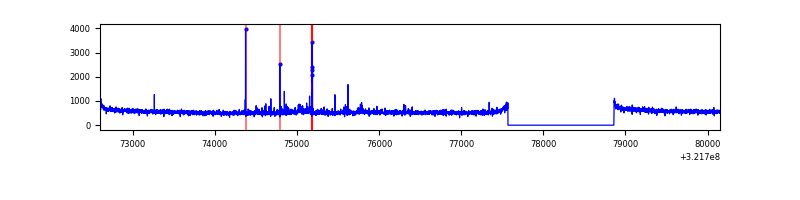 |
| C | 7546 | 6257 | 0 | 0 | 0.00% | 0.00% | 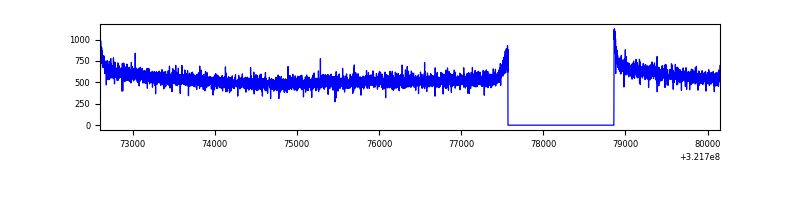 |
| D | 7546 | 6257 | 199 | 199 | 2.64% | 3.18% | 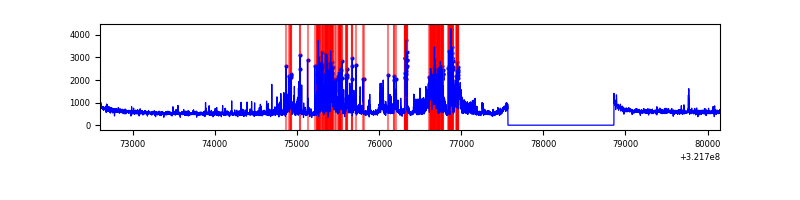 |
Top three noisy pixels from each quadrant. If the there are fewer than three noisy pixels in the level2.evt file, extra rows are filled as -1
| Pixel properties | Quadrant properties | ||||||
|---|---|---|---|---|---|---|---|
| Quadrant | DetID | PixID | Counts | Sigma | Mean | Median | Sigma |
| A | 6 | 16 | 16393 | 88.55 | 890 | 876 | 175.2 |
| A | 2 | 250 | 15308 | 82.36 | 890 | 876 | 175.2 |
| A | 13 | 254 | 10500 | 54.92 | 890 | 876 | 175.2 |
| B | 0 | 190 | 45030 | 269.18 | 867 | 849 | 164.1 |
| B | 12 | 111 | 18608 | 108.2 | 867 | 849 | 164.1 |
| B | 11 | 111 | 16674 | 96.41 | 867 | 849 | 164.1 |
| C | 14 | 238 | 137053 | 705.4 | 835 | 844 | 193.1 |
| C | 13 | 61 | 5849 | 25.92 | 835 | 844 | 193.1 |
| C | 7 | 247 | 5242 | 22.78 | 835 | 844 | 193.1 |
| D | 1 | 52 | 783619 | 3796.75 | 855 | 832 | 206.2 |
| D | 12 | 233 | 420892 | 2037.42 | 855 | 832 | 206.2 |
| D | 8 | 195 | 104702 | 503.8 | 855 | 832 | 206.2 |
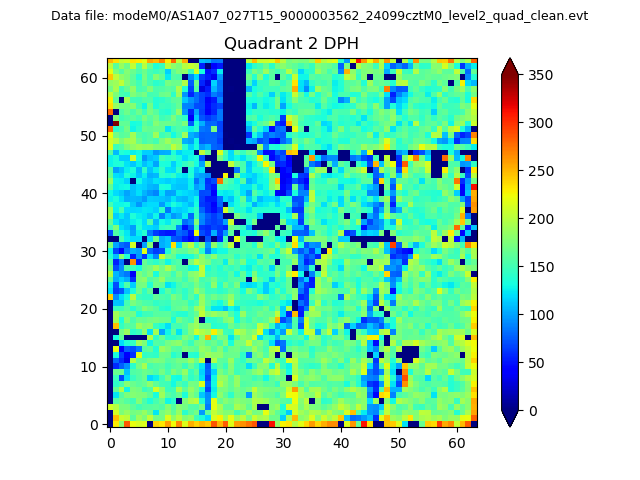
Histogram calculated using DETX and DETY for each event in the final _common_clean file
| Quadrant A | 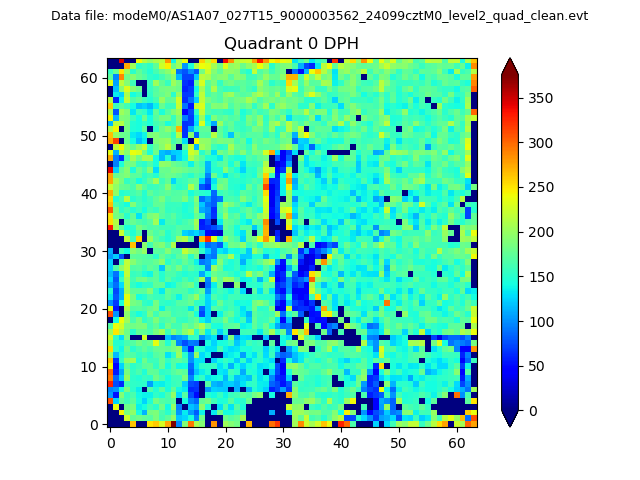 |
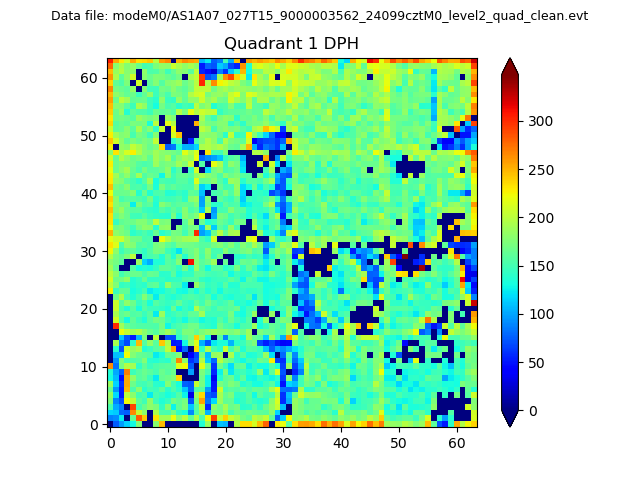 |
Quadrant B |
|---|---|---|---|
| Quadrant D | 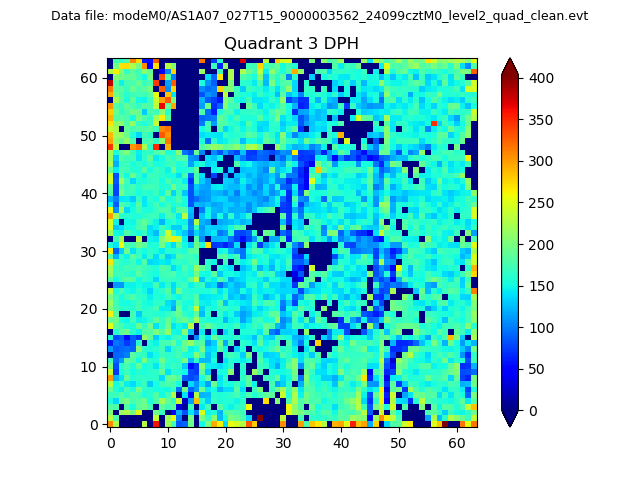 |
 |
Quadrant C |
| Plot type | Count rate plots | Images |
|---|---|---|
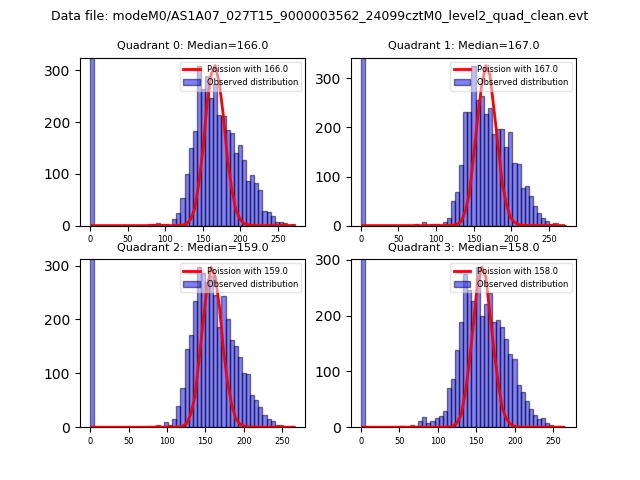
| Comparison with Poisson distribution Blue bars denote a histogram of data divided into 1 sec bins. Red curve is a Poisson curve with rate = median count rate of data. |
 |
 |
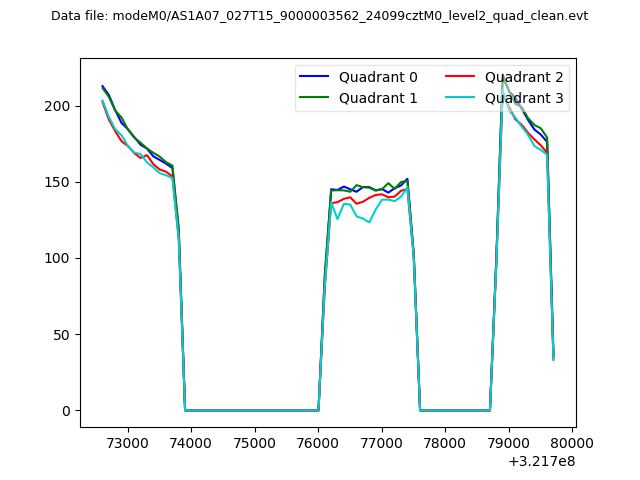
| Quadrant-wise count rates Data is divided into 100 sec bins |
 |
|
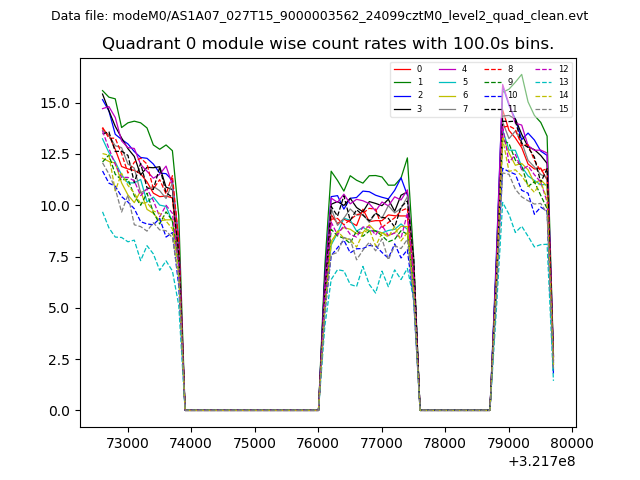
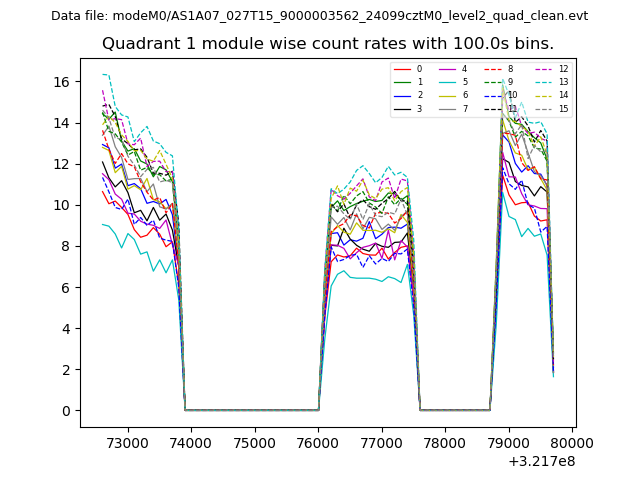
| Module-wise count rates for Quadrant A Data is divided into 100 sec bins |
 |
 |
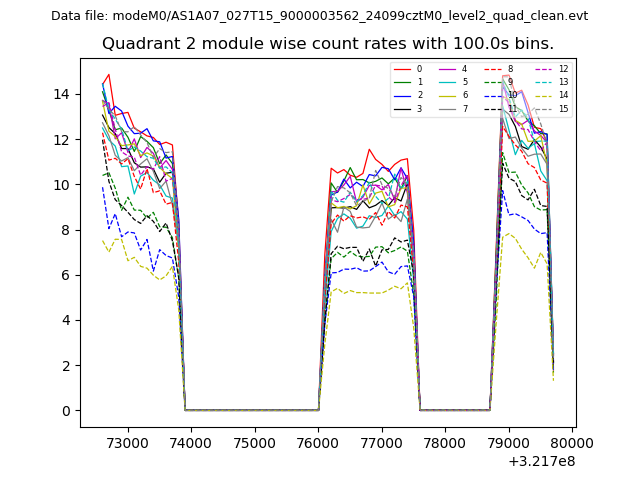
| Module-wise count rates for Quadrant B Data is divided into 100 sec bins |
 |
 |
| Module-wise count rates for Quadrant C Data is divided into 100 sec bins |
 |
 |
| Module-wise count rates for Quadrant D Data is divided into 100 sec bins |
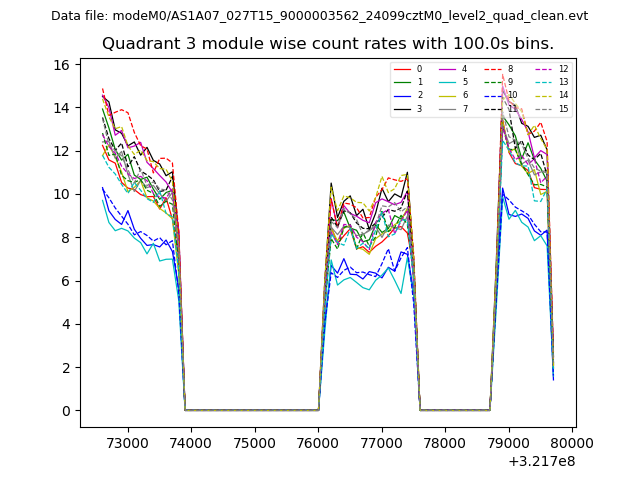 |
 |
| Parameter | Plot |
|---|---|
| CZT HV Monitor | 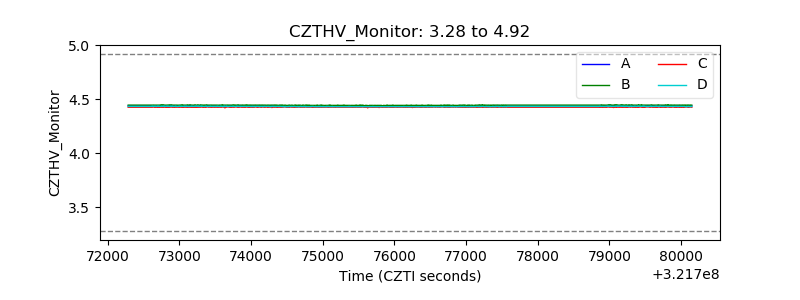 |
| D_VDD | 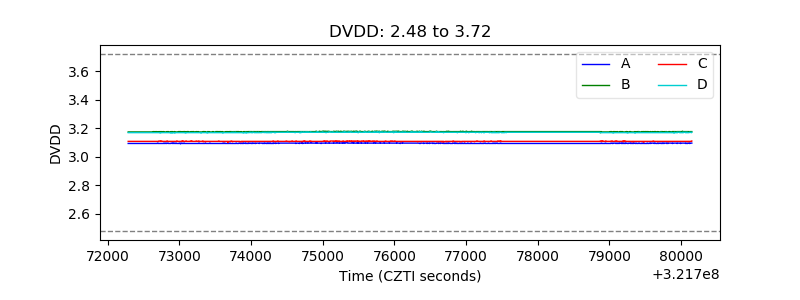 |
| Temperature 1 | 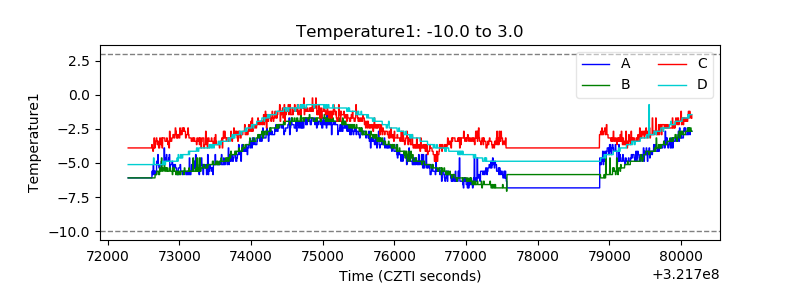 |
| Veto HV Monitor | 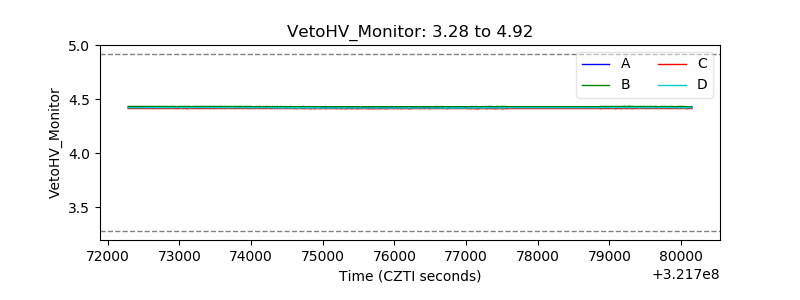 |
| Veto LLD | 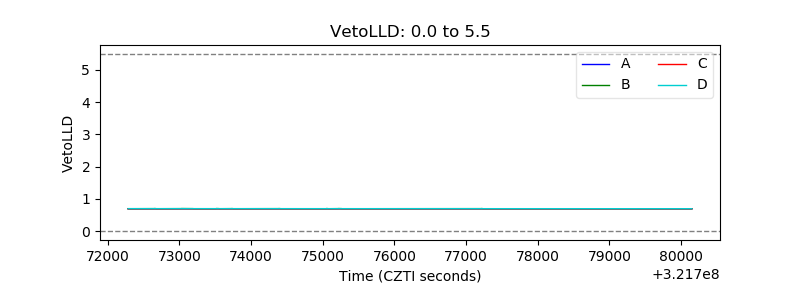 |
| Alpha Counter | 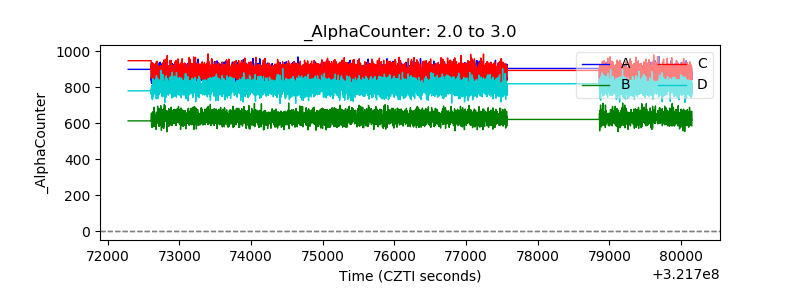 |
| _CPM_Rate | 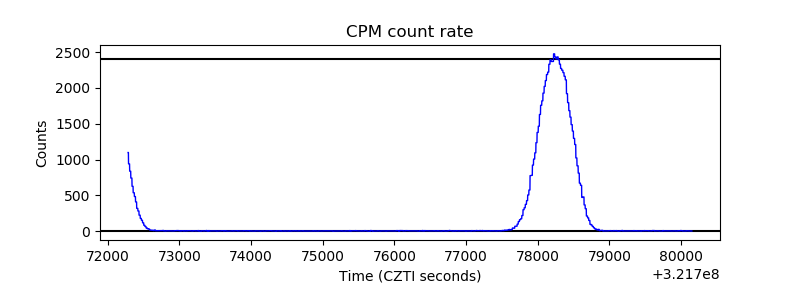 |
| CZT Counter | 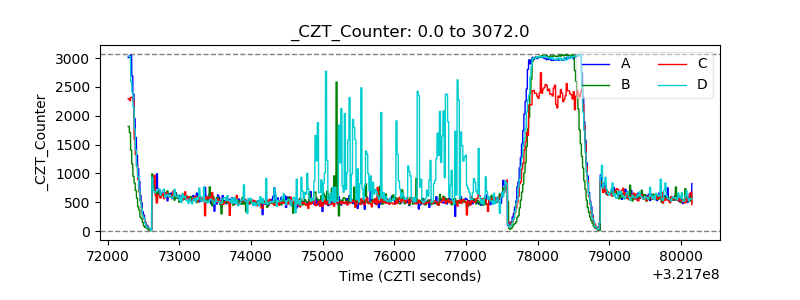 |
| +2.5 Volts monitor |  |
| +5 Volts monitor |  |
| _ROLL_ROT | 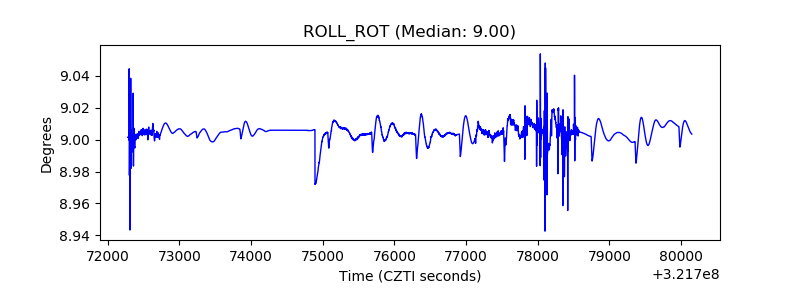 |
| _Roll_DEC |  |
| _Roll_RA | 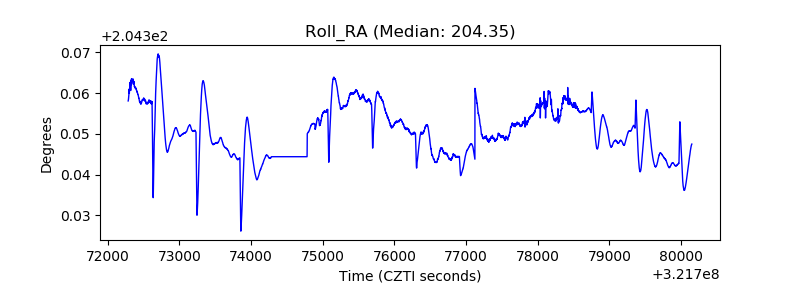 |
| Veto Counter | 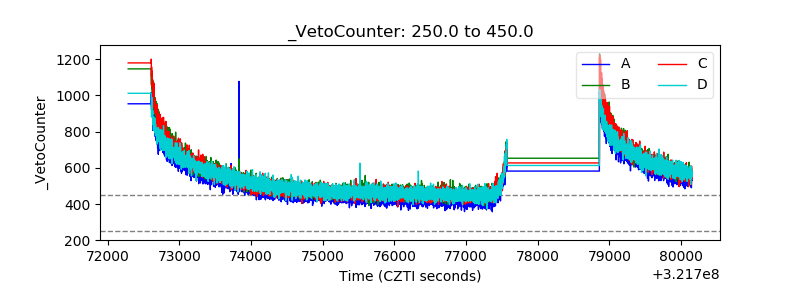 |