| Param | Original file | Final file |
|---|---|---|
| Filename | modeM0/AS1A07_027T15_9000003562_24100cztM0_level2.evt | modeM0/AS1A07_027T15_9000003562_24100cztM0_level2_quad_clean.evt |
| Size (bytes) | 561,265,920 | 84,150,720 |
| Size | 535.3 MB | 80.3 MB |
| Events in quadrant A | 3,694,199 | 534,536 |
| Events in quadrant B | 3,652,230 | 539,202 |
| Events in quadrant C | 3,682,107 | 512,647 |
| Events in quadrant D | 5,528,762 | 507,778 |
| Mode M0 | |||
|---|---|---|---|
| Quadrant | BADHDUFLAG | Total packets | Discarded packets |
| A | 0 | 14922 | 2 |
| B | 0 | 14683 | 2 |
| C | 0 | 14828 | 2 |
| D | 0 | 21300 | 2 |
| Mode SS | |||
|---|---|---|---|
| Quadrant | BADHDUFLAG | Total packets | Discarded packets |
| A | 0 | 132 | 0 |
| B | 0 | 132 | 0 |
| C | 0 | 132 | 0 |
| D | 0 | 132 | 0 |
| Mode M9 | |||
|---|---|---|---|
| Quadrant | BADHDUFLAG | Total packets | Discarded packets |
| A | 0 | 14 | 0 |
| B | 0 | 15 | 0 |
| C | 0 | 15 | 0 |
| D | 0 | 15 | 0 |
| Quadrant | Total seconds | Saturated seconds | Saturation percentage |
|---|---|---|---|
| A | 6510 | 82 | 1.259601% |
| B | 6510 | 81 | 1.244240% |
| C | 6510 | 104 | 1.597542% |
| D | 6510 | 350 | 5.376344% |
Noise dominated data is calculated using 1-second bins in cleaned event files. If a bin has >2000 counts, and if more than 50% of those come from <1% of pixels, then it is considered to be noise-dominated and hence unusable.
| Quadrant | # 1 sec bins | Bins with >0 counts | Bins with >2000 counts | High rate bins dominated by noise | Noise dominated (total time) | Noise dominated (detector-on time) | Marked lightcurve |
|---|---|---|---|---|---|---|---|
| A | 7815 | 6510 | 1 | 1 | 0.01% | 0.02% | 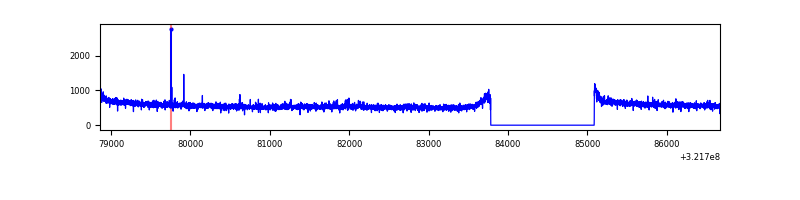 |
| B | 7815 | 6511 | 0 | 0 | 0.00% | 0.00% | 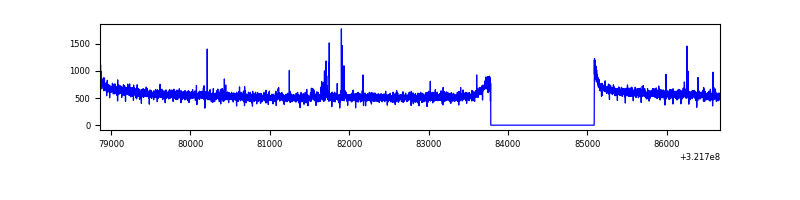 |
| C | 7815 | 6510 | 0 | 0 | 0.00% | 0.00% |  |
| D | 7814 | 6509 | 247 | 247 | 3.16% | 3.79% | 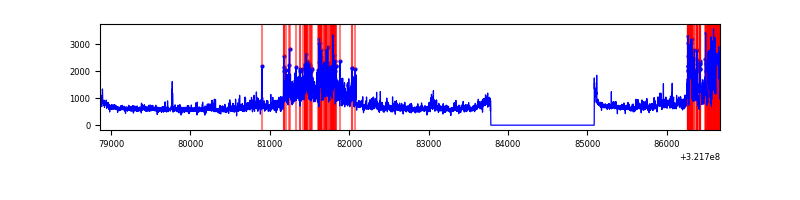 |
Top three noisy pixels from each quadrant. If the there are fewer than three noisy pixels in the level2.evt file, extra rows are filled as -1
| Pixel properties | Quadrant properties | ||||||
|---|---|---|---|---|---|---|---|
| Quadrant | DetID | PixID | Counts | Sigma | Mean | Median | Sigma |
| A | 2 | 250 | 23859 | 122.95 | 948 | 931 | 186.5 |
| A | 6 | 16 | 16182 | 81.78 | 948 | 931 | 186.5 |
| A | 13 | 254 | 10944 | 53.69 | 948 | 931 | 186.5 |
| B | 0 | 190 | 26278 | 146.32 | 925 | 904 | 173.4 |
| B | 12 | 111 | 19690 | 108.33 | 925 | 904 | 173.4 |
| B | 11 | 111 | 17606 | 96.31 | 925 | 904 | 173.4 |
| C | 14 | 238 | 145218 | 700.63 | 891 | 899 | 206.0 |
| C | 0 | 239 | 56057 | 267.78 | 891 | 899 | 206.0 |
| C | 7 | 247 | 9641 | 42.44 | 891 | 899 | 206.0 |
| D | 8 | 195 | 1493948 | 6927.29 | 906 | 884 | 215.5 |
| D | 12 | 233 | 507212 | 2349.18 | 906 | 884 | 215.5 |
| D | 1 | 52 | 74545 | 341.76 | 906 | 884 | 215.5 |
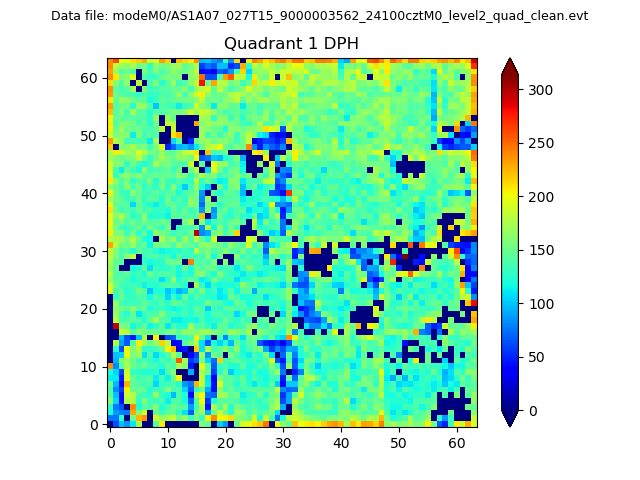
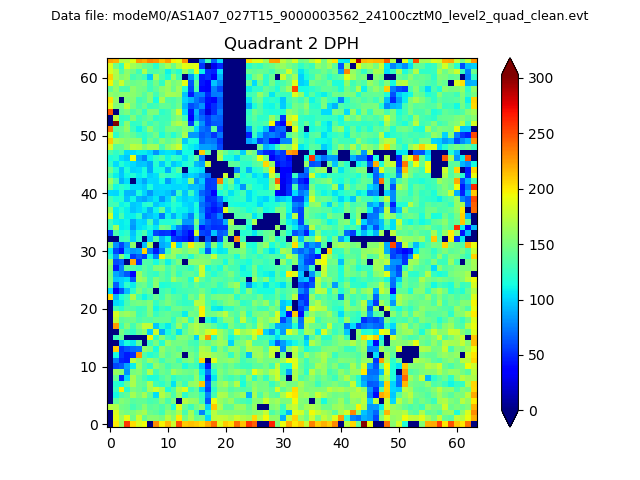
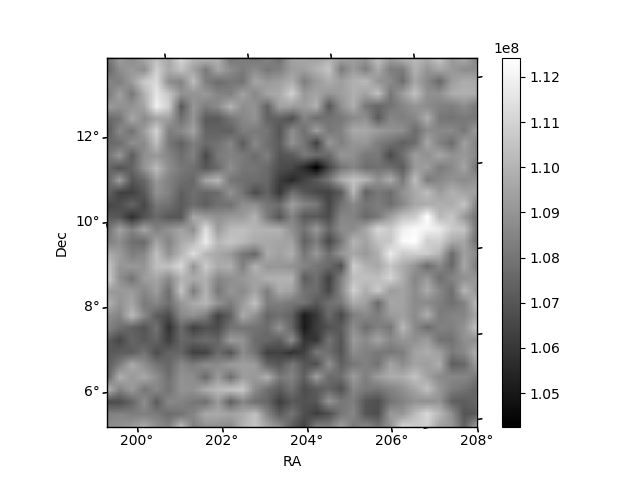
Histogram calculated using DETX and DETY for each event in the final _common_clean file
| Quadrant A | 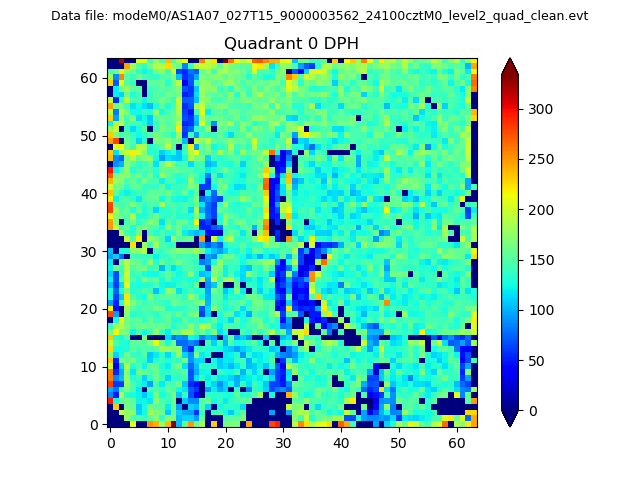 |
 |
Quadrant B |
|---|---|---|---|
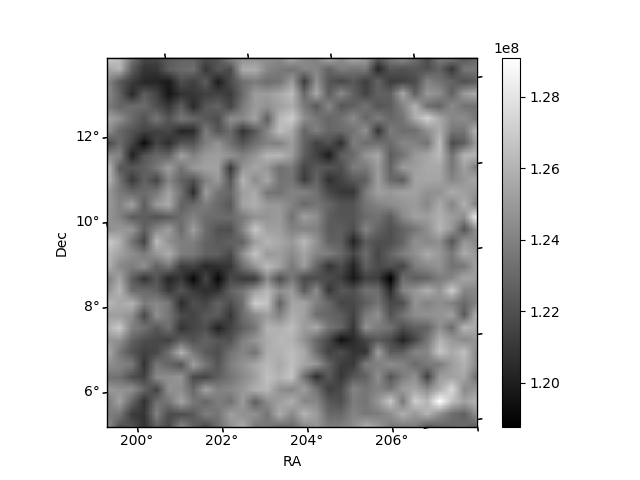
| Quadrant D | 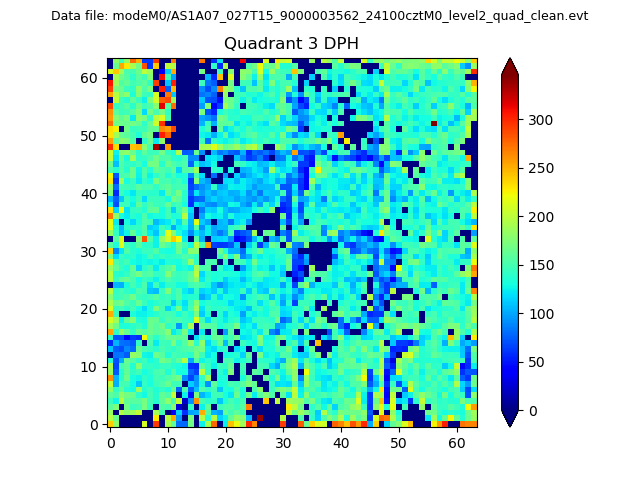 |
 |
Quadrant C |
| Plot type | Count rate plots | Images |
|---|---|---|
| Comparison with Poisson distribution Blue bars denote a histogram of data divided into 1 sec bins. Red curve is a Poisson curve with rate = median count rate of data. |
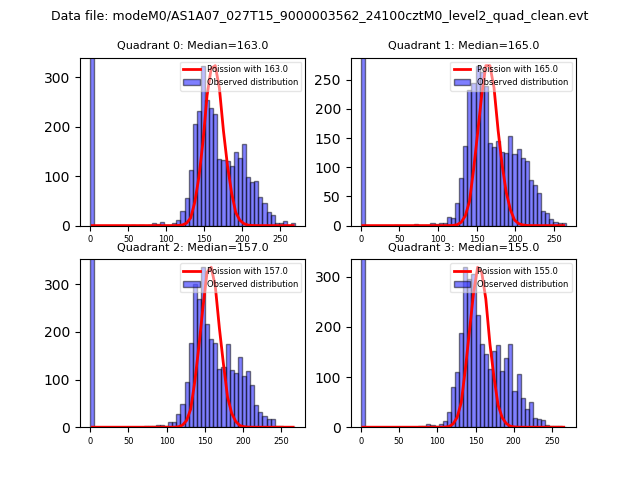 |
 |
| Quadrant-wise count rates Data is divided into 100 sec bins |
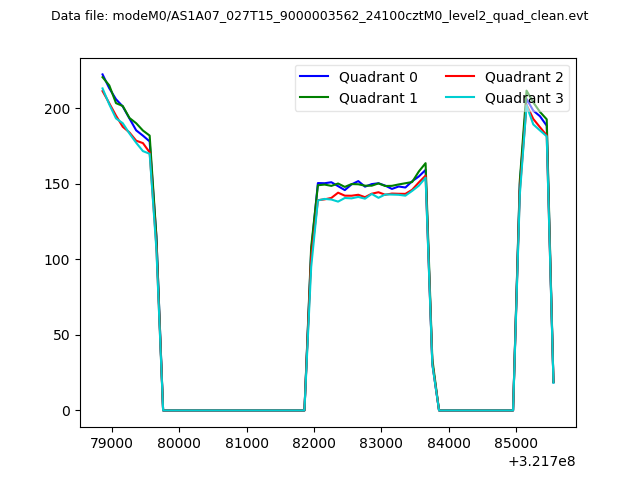 |
|
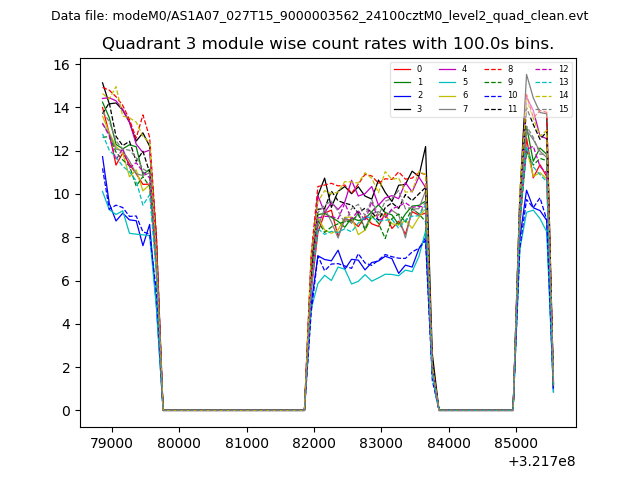
| Module-wise count rates for Quadrant A Data is divided into 100 sec bins |
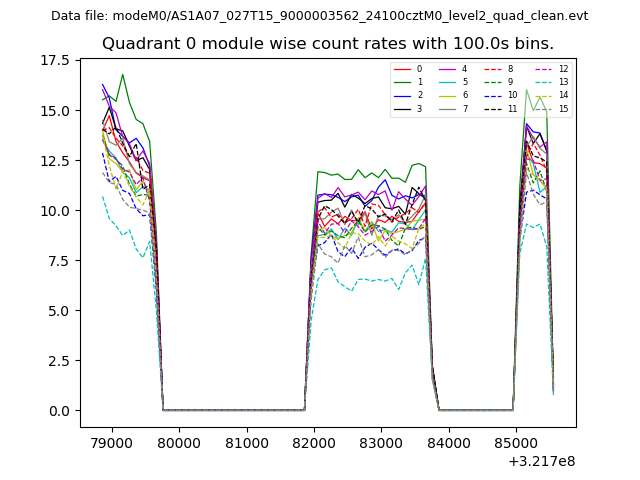 |
 |
| Module-wise count rates for Quadrant B Data is divided into 100 sec bins |
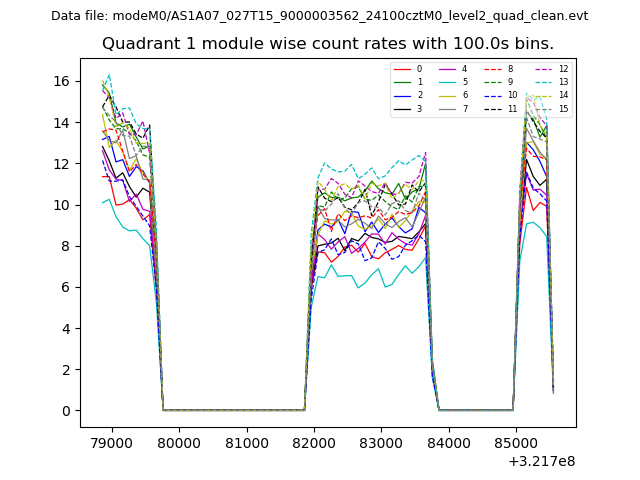 |
 |
| Module-wise count rates for Quadrant C Data is divided into 100 sec bins |
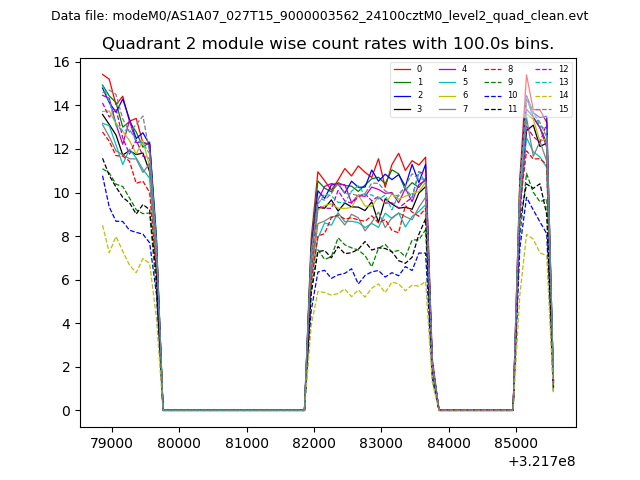 |
 |
| Module-wise count rates for Quadrant D Data is divided into 100 sec bins |
 |
 |
| Parameter | Plot |
|---|---|
| CZT HV Monitor | 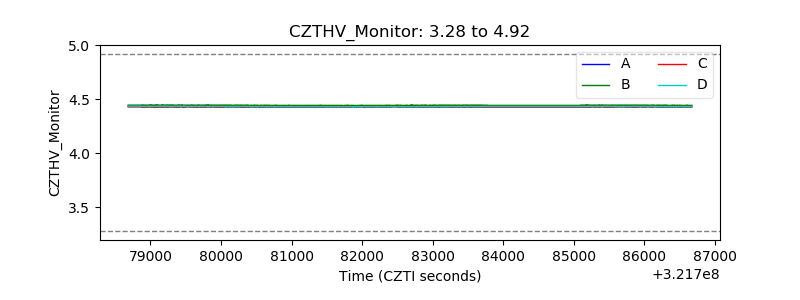 |
| D_VDD | 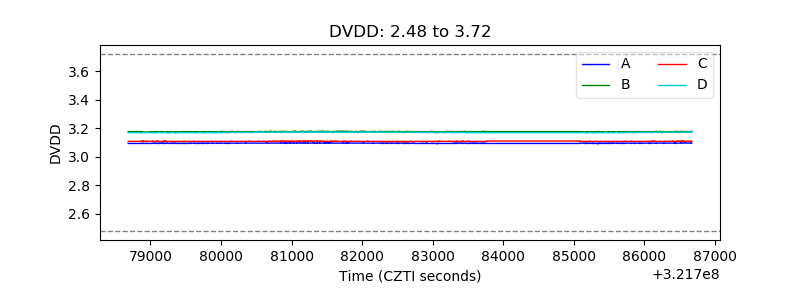 |
| Temperature 1 | 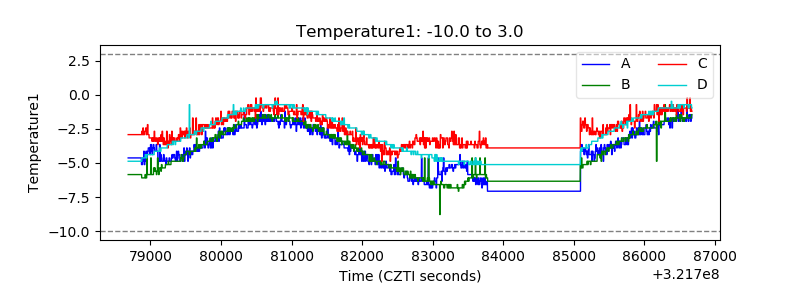 |
| Veto HV Monitor | 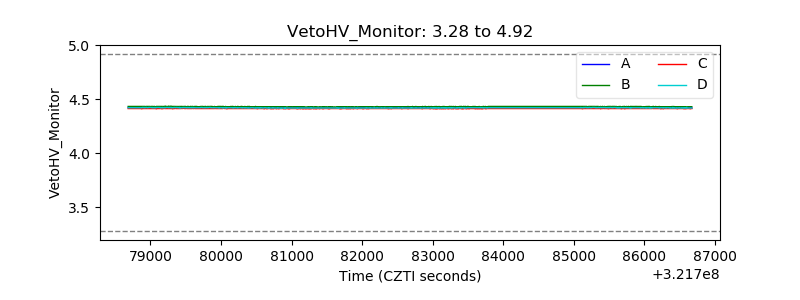 |
| Veto LLD | 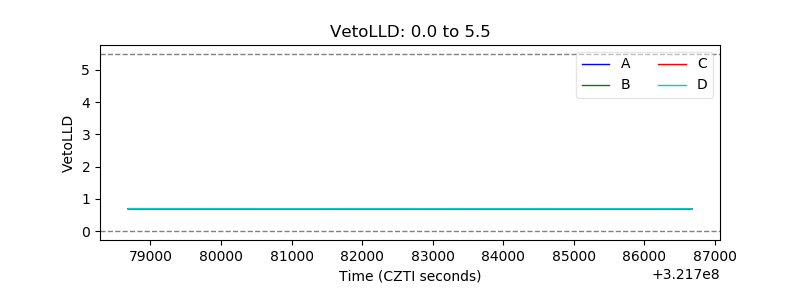 |
| Alpha Counter | 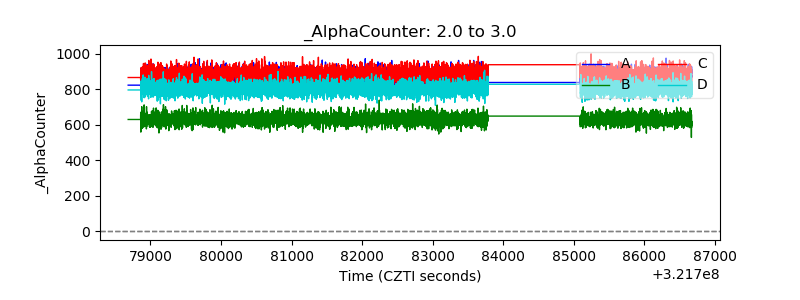 |
| _CPM_Rate | 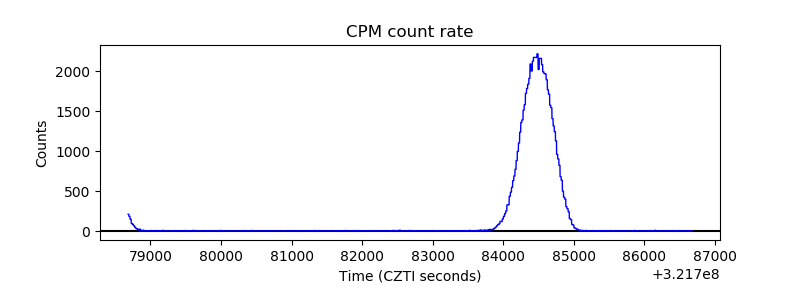 |
| CZT Counter | 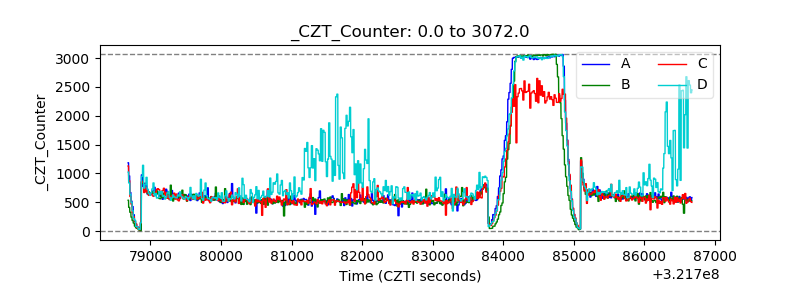 |
| +2.5 Volts monitor | 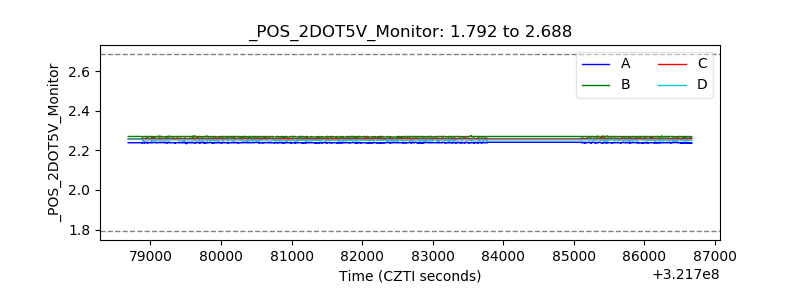 |
| +5 Volts monitor |  |
| _ROLL_ROT | 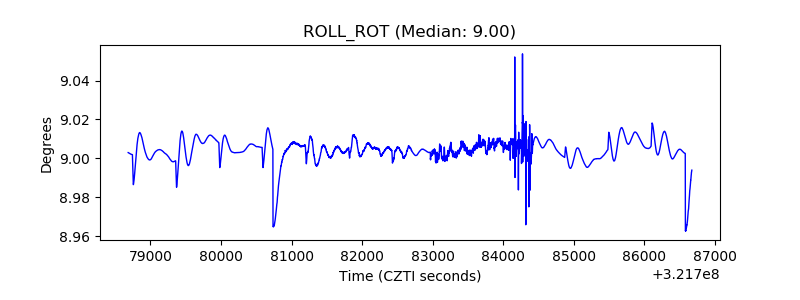 |
| _Roll_DEC | 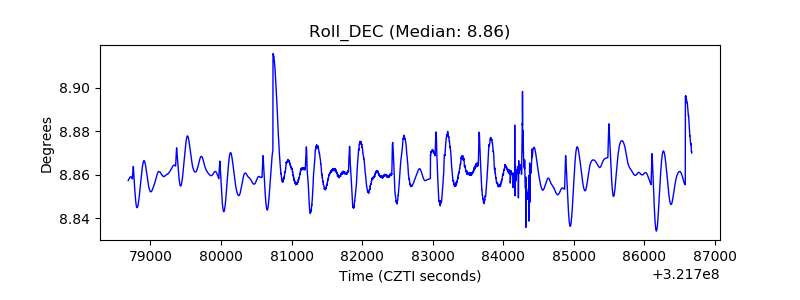 |
| _Roll_RA | 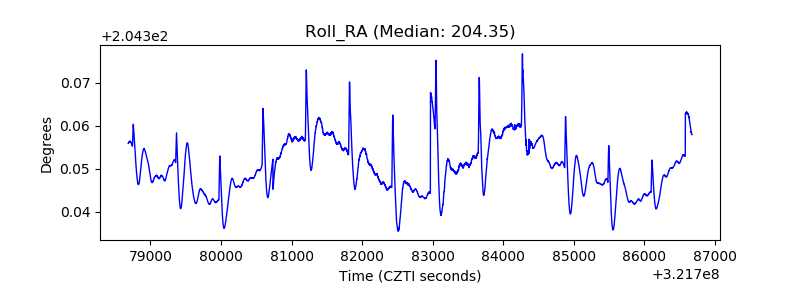 |
| Veto Counter | 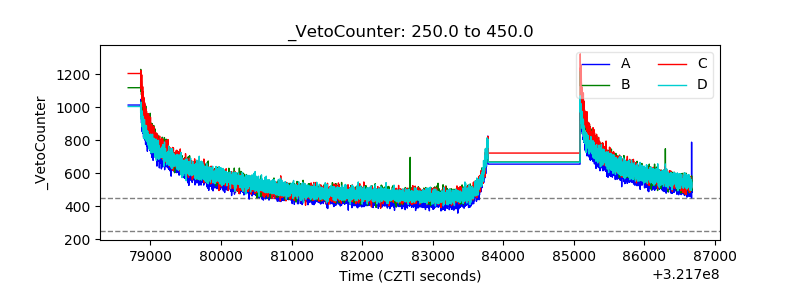 |