| Param | Original file | Final file |
|---|---|---|
| Filename | modeM0/AS1C05_012T04_9000003564_24102cztM0_level2.evt | modeM0/AS1C05_012T04_9000003564_24102cztM0_level2_quad_clean.evt |
| Size (bytes) | 592,911,360 | 140,690,880 |
| Size | 565.4 MB | 134.2 MB |
| Events in quadrant A | 3,387,876 | 990,045 |
| Events in quadrant B | 3,414,542 | 991,085 |
| Events in quadrant C | 3,393,831 | 945,173 |
| Events in quadrant D | 7,296,579 | 857,838 |
| Mode SS | |||
|---|---|---|---|
| Quadrant | BADHDUFLAG | Total packets | Discarded packets |
| A | 0 | 140 | 0 |
| B | 0 | 140 | 0 |
| C | 0 | 140 | 0 |
| D | 0 | 140 | 0 |
| Mode M0 | |||
|---|---|---|---|
| Quadrant | BADHDUFLAG | Total packets | Discarded packets |
| A | 0 | 14154 | 2 |
| B | 0 | 14199 | 2 |
| C | 0 | 14122 | 3 |
| D | 0 | 26378 | 2 |
| Mode M9 | |||
|---|---|---|---|
| Quadrant | BADHDUFLAG | Total packets | Discarded packets |
| A | 0 | 10 | 0 |
| B | 0 | 11 | 0 |
| C | 0 | 11 | 0 |
| D | 0 | 11 | 0 |
| Quadrant | Total seconds | Saturated seconds | Saturation percentage |
|---|---|---|---|
| A | 6835 | 128 | 1.872714% |
| B | 6835 | 142 | 2.077542% |
| C | 6834 | 160 | 2.341235% |
| D | 6834 | 1052 | 15.393620% |
Noise dominated data is calculated using 1-second bins in cleaned event files. If a bin has >2000 counts, and if more than 50% of those come from <1% of pixels, then it is considered to be noise-dominated and hence unusable.
| Quadrant | # 1 sec bins | Bins with >0 counts | Bins with >2000 counts | High rate bins dominated by noise | Noise dominated (total time) | Noise dominated (detector-on time) | Marked lightcurve |
|---|---|---|---|---|---|---|---|
| A | 7910 | 6835 | 0 | 0 | 0.00% | 0.00% | 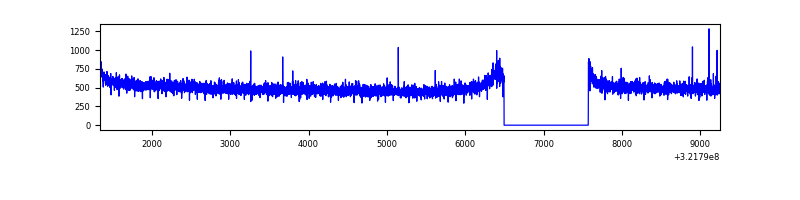 |
| B | 7910 | 6835 | 0 | 0 | 0.00% | 0.00% | 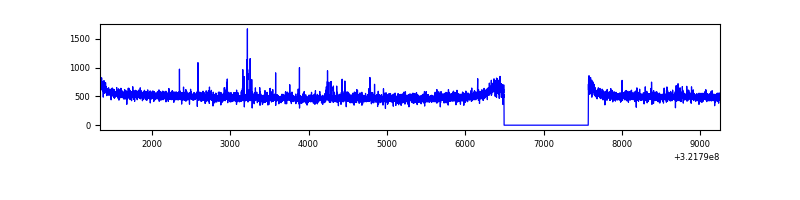 |
| C | 7909 | 6834 | 0 | 0 | 0.00% | 0.00% | 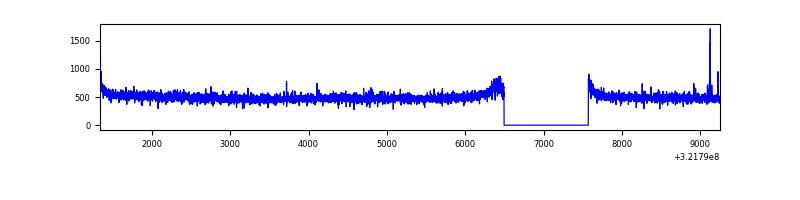 |
| D | 7909 | 6834 | 918 | 918 | 11.61% | 13.43% | 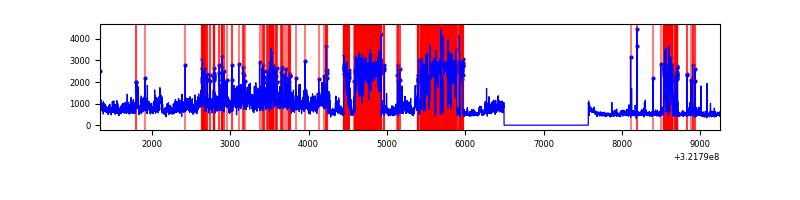 |
Top three noisy pixels from each quadrant. If the there are fewer than three noisy pixels in the level2.evt file, extra rows are filled as -1
| Pixel properties | Quadrant properties | ||||||
|---|---|---|---|---|---|---|---|
| Quadrant | DetID | PixID | Counts | Sigma | Mean | Median | Sigma |
| A | 13 | 254 | 11470 | 61.22 | 877 | 860 | 173.3 |
| A | 0 | 226 | 7686 | 39.38 | 877 | 860 | 173.3 |
| A | 3 | 137 | 7171 | 36.41 | 877 | 860 | 173.3 |
| B | 12 | 111 | 18714 | 111.94 | 861 | 842 | 159.7 |
| B | 11 | 111 | 16622 | 98.83 | 861 | 842 | 159.7 |
| B | 14 | 111 | 14130 | 83.23 | 861 | 842 | 159.7 |
| C | 14 | 238 | 135187 | 716.58 | 827 | 833 | 187.5 |
| C | 7 | 247 | 17260 | 87.61 | 827 | 833 | 187.5 |
| C | 0 | 239 | 10414 | 51.1 | 827 | 833 | 187.5 |
| D | 8 | 195 | 1413992 | 7388.87 | 801 | 778 | 191.3 |
| D | 1 | 52 | 1318272 | 6888.41 | 801 | 778 | 191.3 |
| D | 11 | 176 | 922436 | 4818.81 | 801 | 778 | 191.3 |
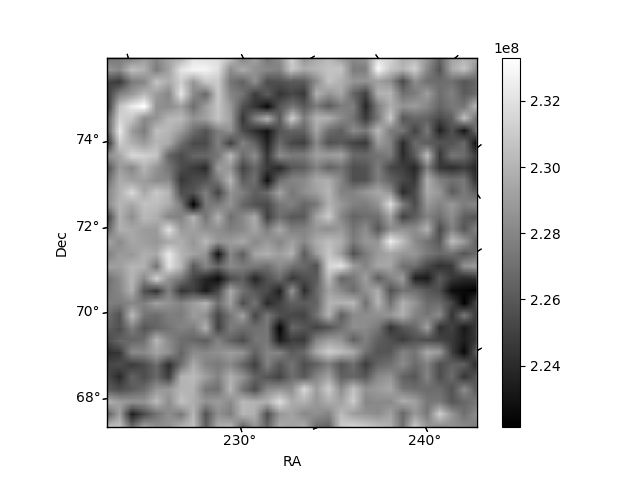
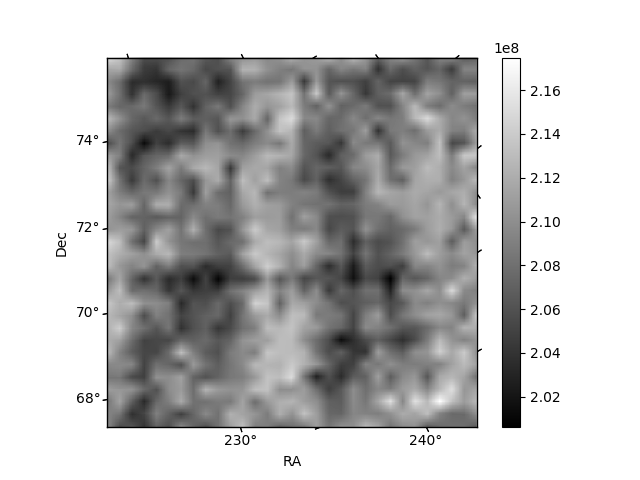
Histogram calculated using DETX and DETY for each event in the final _common_clean file
| Quadrant A |  |
 |
Quadrant B |
|---|---|---|---|
| Quadrant D | 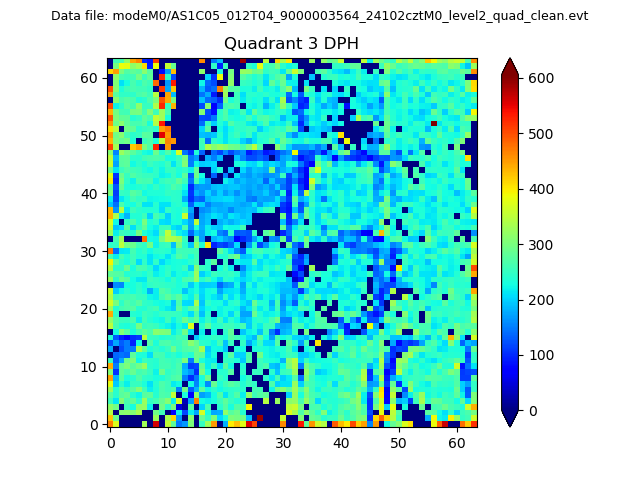 |
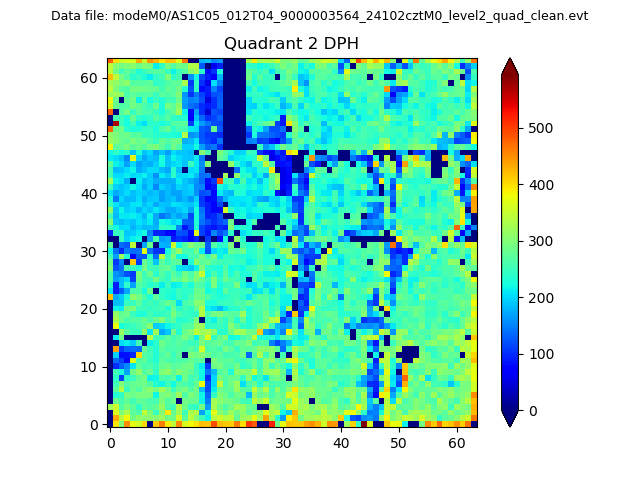 |
Quadrant C |
| Plot type | Count rate plots | Images |
|---|---|---|
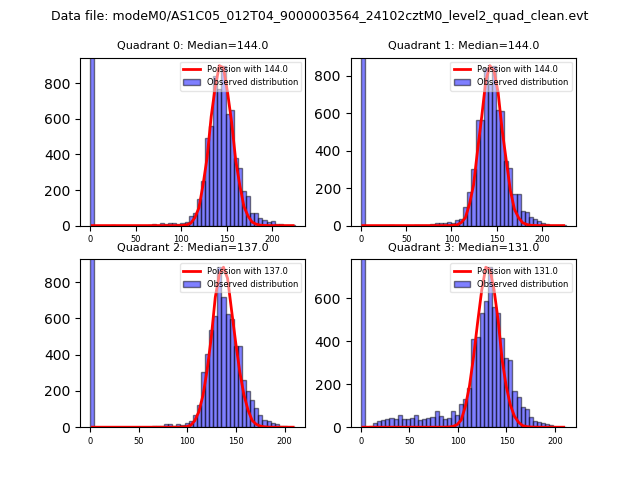
| Comparison with Poisson distribution Blue bars denote a histogram of data divided into 1 sec bins. Red curve is a Poisson curve with rate = median count rate of data. |
 |
 |
| Quadrant-wise count rates Data is divided into 100 sec bins |
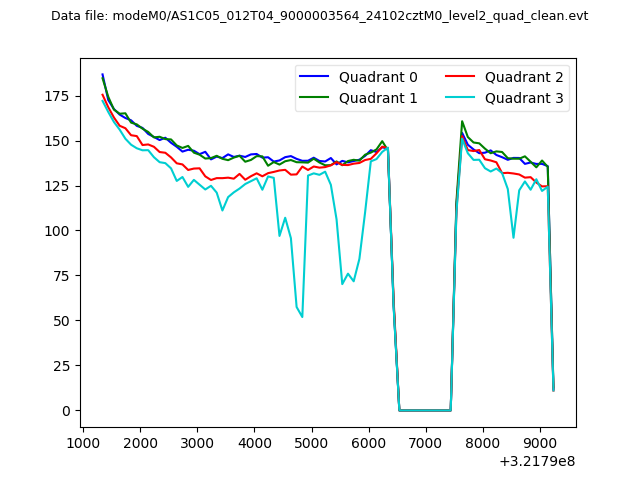 |
|
| Module-wise count rates for Quadrant A Data is divided into 100 sec bins |
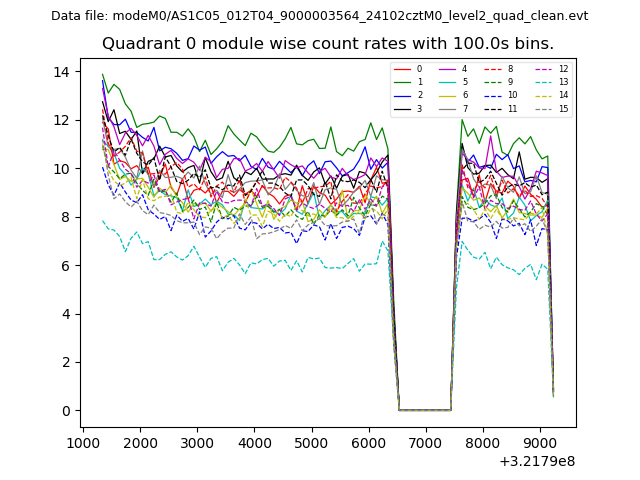 |
 |
| Module-wise count rates for Quadrant B Data is divided into 100 sec bins |
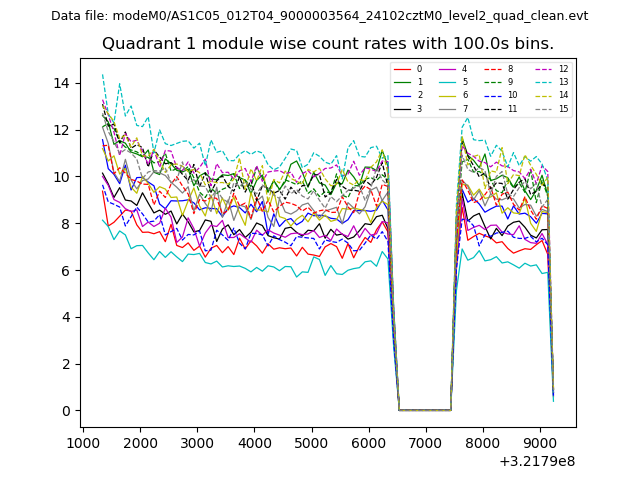 |
 |
| Module-wise count rates for Quadrant C Data is divided into 100 sec bins |
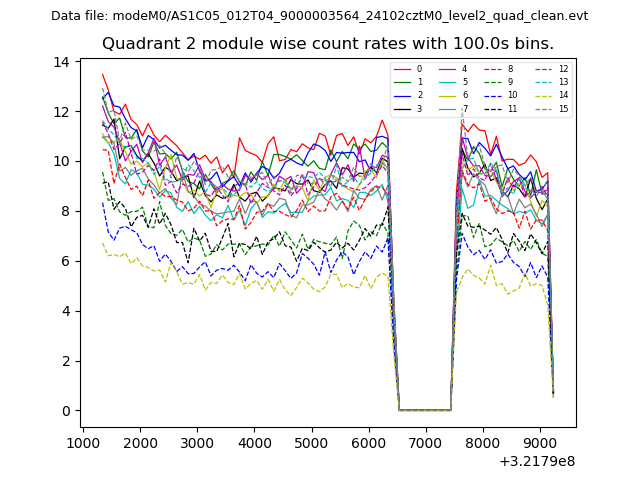 |
 |
| Module-wise count rates for Quadrant D Data is divided into 100 sec bins |
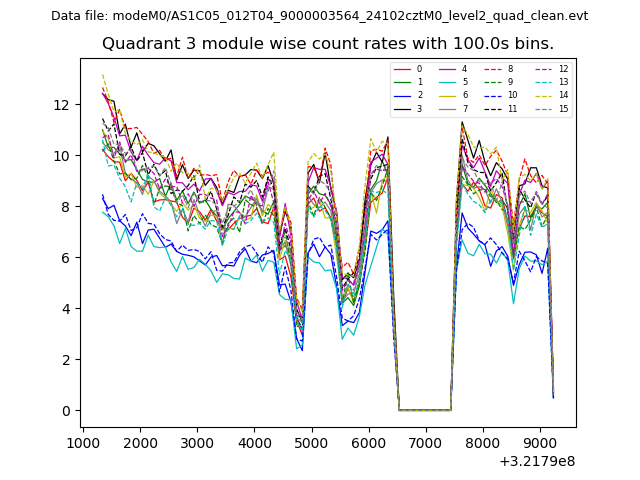 |
 |
| Parameter | Plot |
|---|---|
| CZT HV Monitor |  |
| D_VDD | 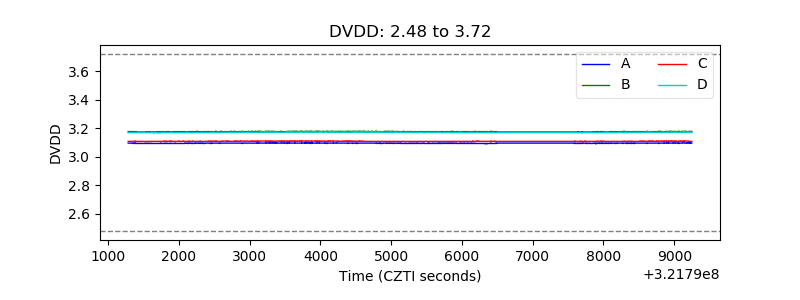 |
| Temperature 1 | 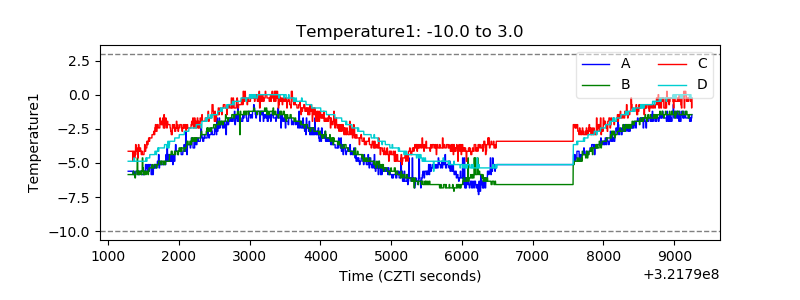 |
| Veto HV Monitor | 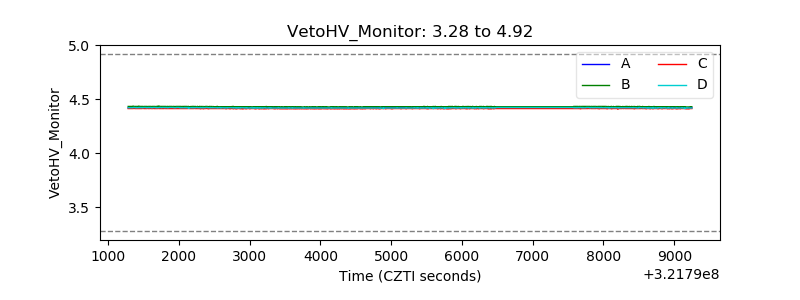 |
| Veto LLD | 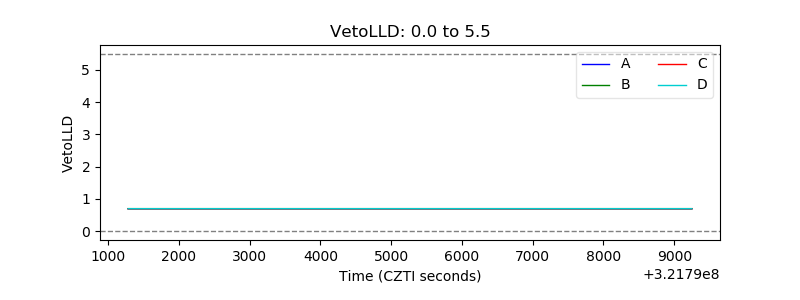 |
| Alpha Counter | 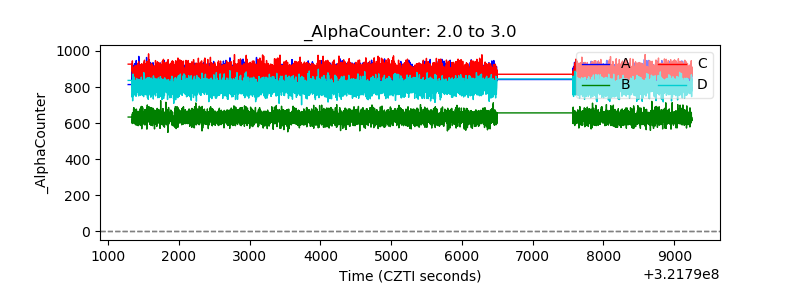 |
| _CPM_Rate | 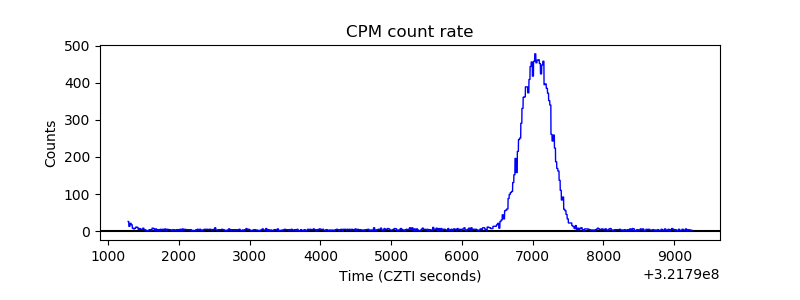 |
| CZT Counter | 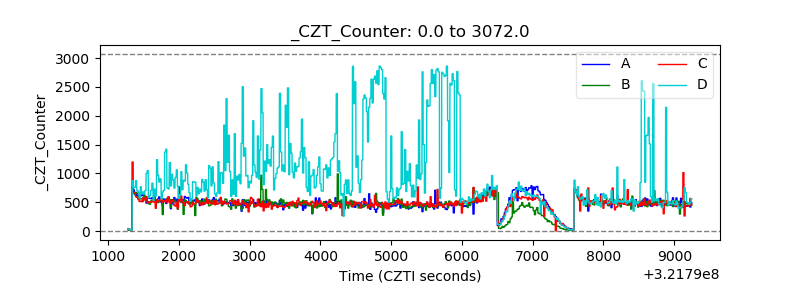 |
| +2.5 Volts monitor |  |
| +5 Volts monitor | 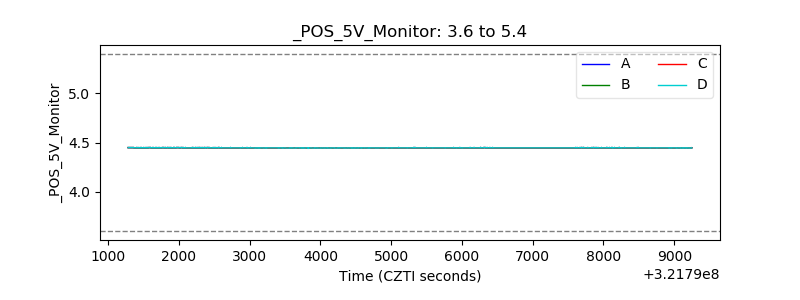 |
| _ROLL_ROT | 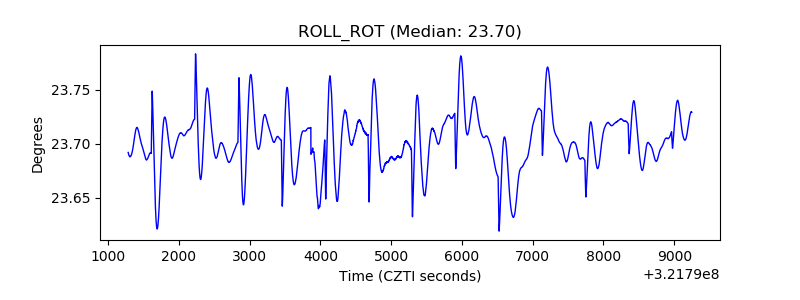 |
| _Roll_DEC | 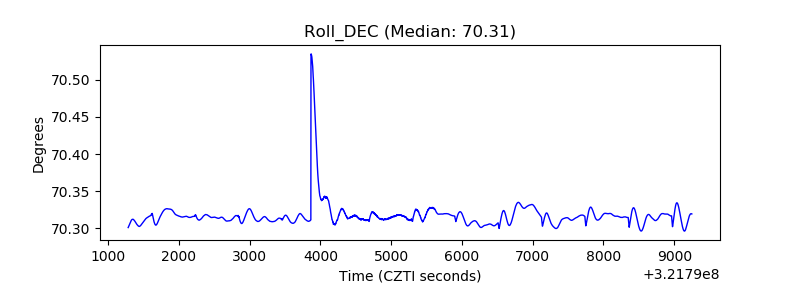 |
| _Roll_RA | 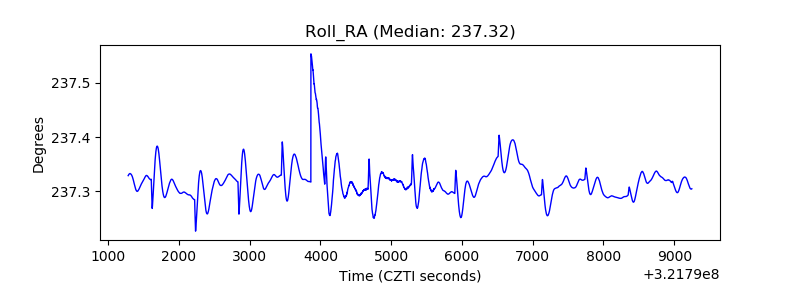 |
| Veto Counter | 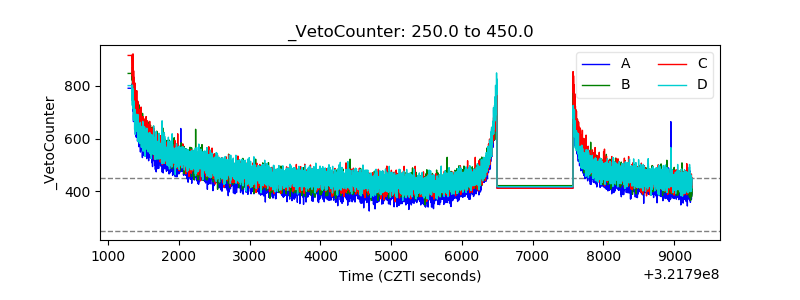 |