| Param | Original file | Final file |
|---|---|---|
| Filename | modeM0/AS1C05_012T04_9000003564_24103cztM0_level2.evt | modeM0/AS1C05_012T04_9000003564_24103cztM0_level2_quad_clean.evt |
| Size (bytes) | 499,449,600 | 131,621,760 |
| Size | 476.3 MB | 125.5 MB |
| Events in quadrant A | 3,193,140 | 904,658 |
| Events in quadrant B | 3,215,001 | 909,870 |
| Events in quadrant C | 3,465,648 | 864,821 |
| Events in quadrant D | 4,795,921 | 838,943 |
| Mode SS | |||
|---|---|---|---|
| Quadrant | BADHDUFLAG | Total packets | Discarded packets |
| A | 0 | 136 | 0 |
| B | 0 | 136 | 0 |
| C | 0 | 136 | 0 |
| D | 0 | 136 | 0 |
| Mode M0 | |||
|---|---|---|---|
| Quadrant | BADHDUFLAG | Total packets | Discarded packets |
| A | 0 | 13763 | 1 |
| B | 0 | 13786 | 1 |
| C | 0 | 14444 | 1 |
| D | 0 | 18638 | 1 |
| Mode M9 | |||
|---|---|---|---|
| Quadrant | BADHDUFLAG | Total packets | Discarded packets |
| A | 0 | 8 | 0 |
| B | 0 | 8 | 0 |
| C | 0 | 8 | 0 |
| D | 0 | 8 | 0 |
| Quadrant | Total seconds | Saturated seconds | Saturation percentage |
|---|---|---|---|
| A | 6720 | 106 | 1.577381% |
| B | 6721 | 108 | 1.606904% |
| C | 6721 | 168 | 2.499628% |
| D | 6721 | 262 | 3.898229% |
Noise dominated data is calculated using 1-second bins in cleaned event files. If a bin has >2000 counts, and if more than 50% of those come from <1% of pixels, then it is considered to be noise-dominated and hence unusable.
| Quadrant | # 1 sec bins | Bins with >0 counts | Bins with >2000 counts | High rate bins dominated by noise | Noise dominated (total time) | Noise dominated (detector-on time) | Marked lightcurve |
|---|---|---|---|---|---|---|---|
| A | 7476 | 6720 | 4 | 4 | 0.05% | 0.06% | 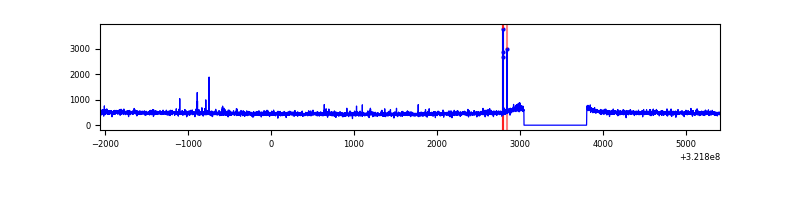 |
| B | 7477 | 6721 | 0 | 0 | 0.00% | 0.00% | 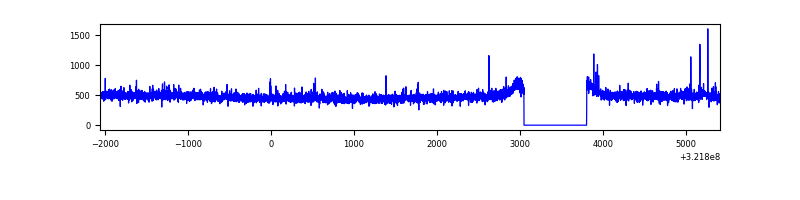 |
| C | 7477 | 6721 | 32 | 32 | 0.43% | 0.48% | 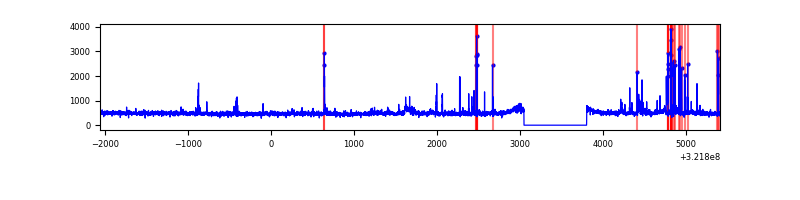 |
| D | 7477 | 6721 | 165 | 165 | 2.21% | 2.45% | 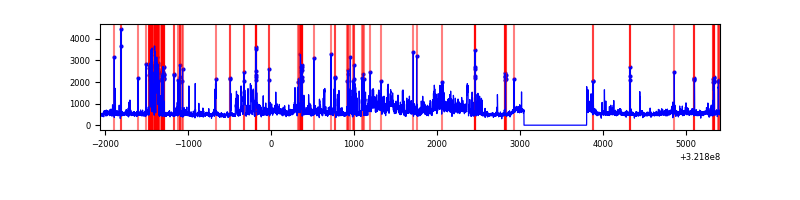 |
Top three noisy pixels from each quadrant. If the there are fewer than three noisy pixels in the level2.evt file, extra rows are filled as -1
| Pixel properties | Quadrant properties | ||||||
|---|---|---|---|---|---|---|---|
| Quadrant | DetID | PixID | Counts | Sigma | Mean | Median | Sigma |
| A | 6 | 16 | 30229 | 179.45 | 819 | 802 | 164.0 |
| A | 13 | 254 | 11245 | 63.68 | 819 | 802 | 164.0 |
| A | 0 | 226 | 7263 | 39.4 | 819 | 802 | 164.0 |
| B | 12 | 111 | 17835 | 112.07 | 810 | 792 | 152.1 |
| B | 0 | 229 | 17395 | 109.18 | 810 | 792 | 152.1 |
| B | 11 | 111 | 16006 | 100.04 | 810 | 792 | 152.1 |
| C | 0 | 239 | 274382 | 1517.72 | 780 | 784 | 180.3 |
| C | 14 | 238 | 125000 | 689.06 | 780 | 784 | 180.3 |
| C | 7 | 247 | 25531 | 137.28 | 780 | 784 | 180.3 |
| D | 8 | 195 | 862020 | 4535.81 | 790 | 767 | 189.9 |
| D | 1 | 52 | 504403 | 2652.41 | 790 | 767 | 189.9 |
| D | 12 | 233 | 258230 | 1355.94 | 790 | 767 | 189.9 |
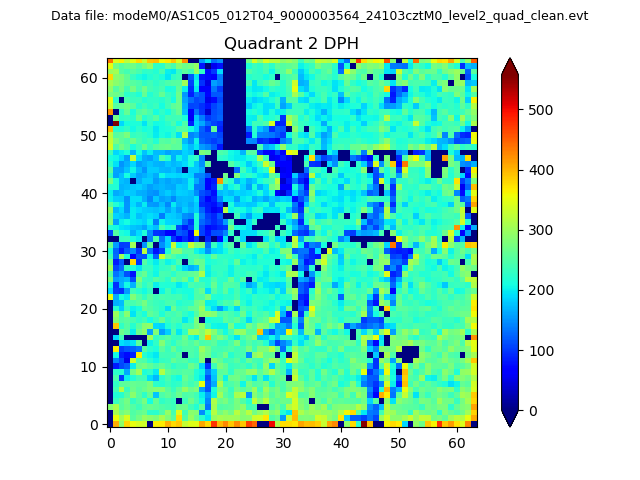
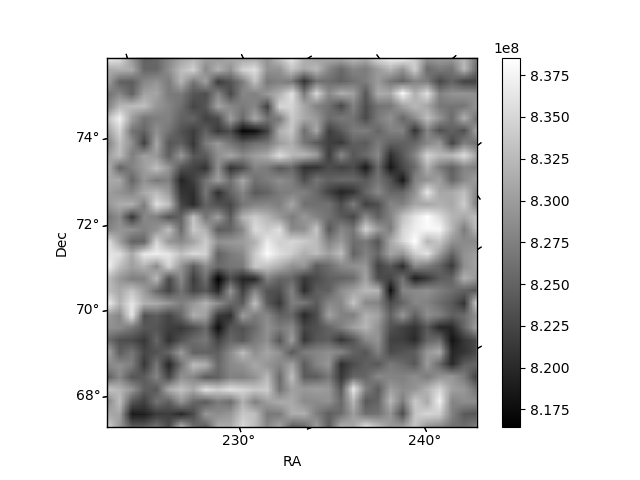
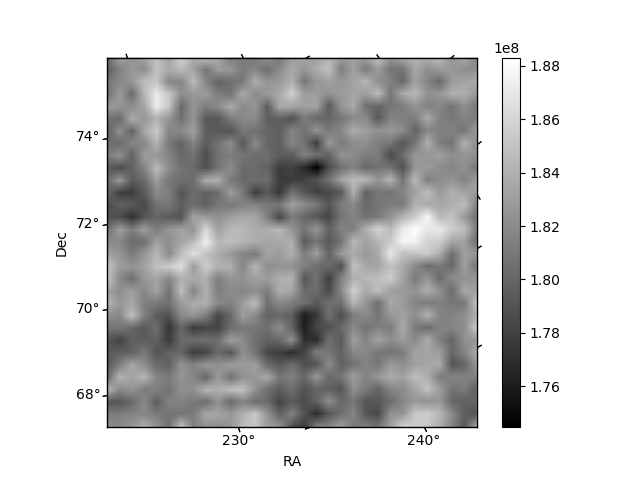
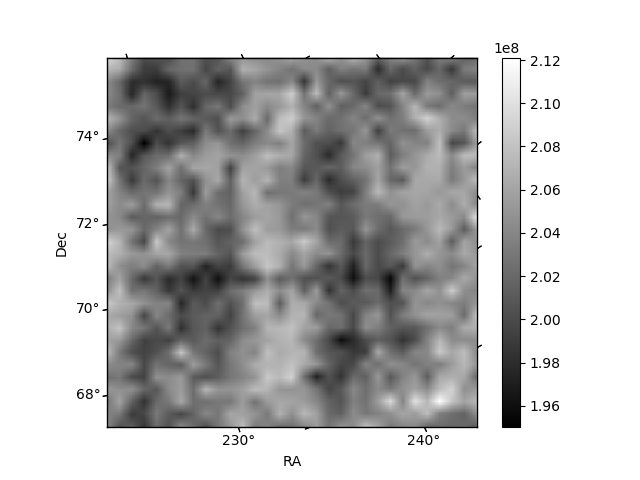
Histogram calculated using DETX and DETY for each event in the final _common_clean file
| Quadrant A | 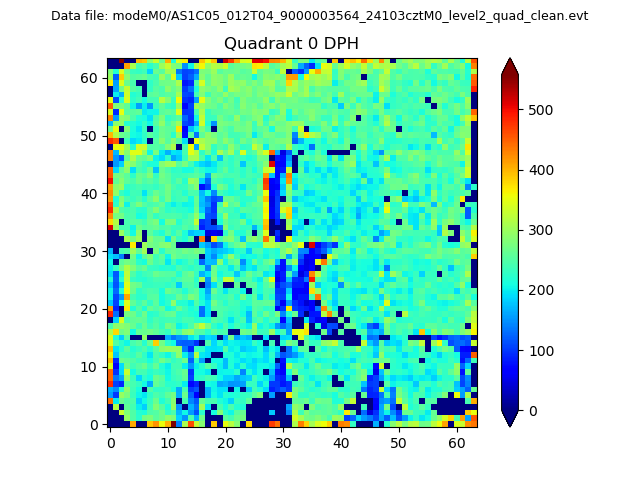 |
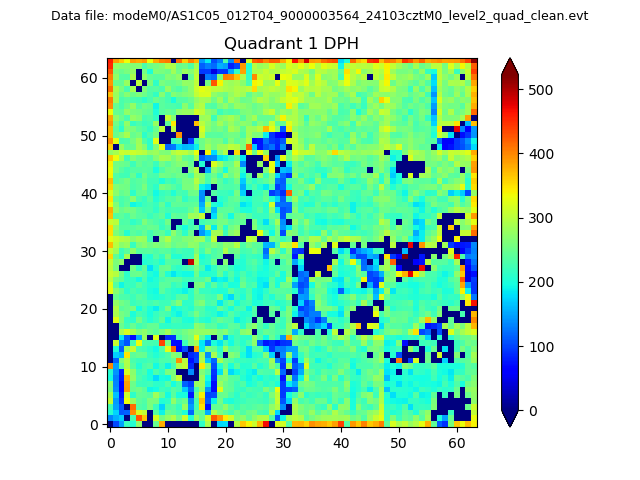 |
Quadrant B |
|---|---|---|---|
| Quadrant D | 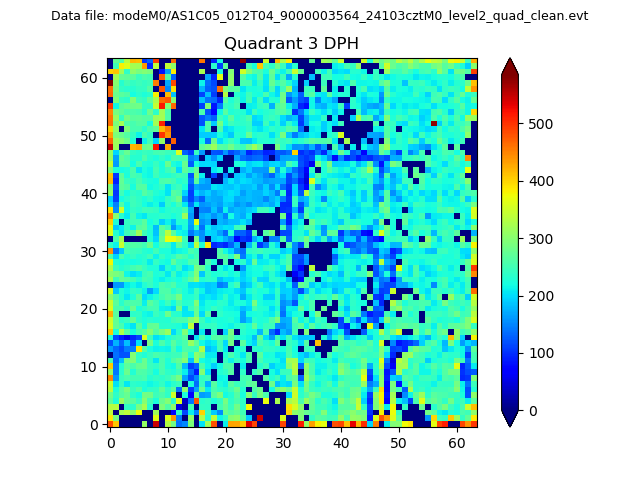 |
 |
Quadrant C |
| Plot type | Count rate plots | Images |
|---|---|---|
| Comparison with Poisson distribution Blue bars denote a histogram of data divided into 1 sec bins. Red curve is a Poisson curve with rate = median count rate of data. |
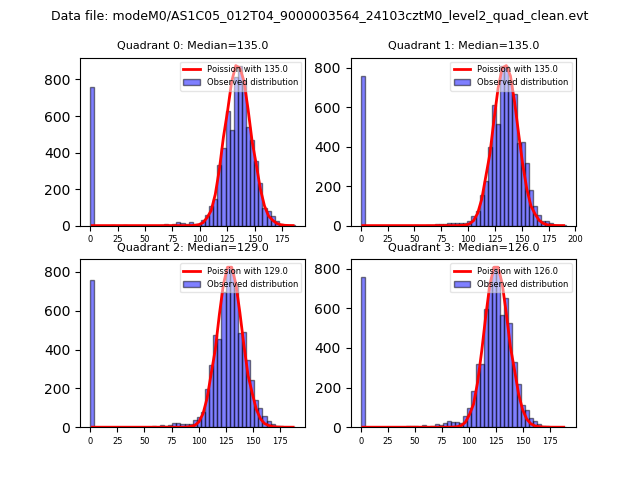 |
 |
| Quadrant-wise count rates Data is divided into 100 sec bins |
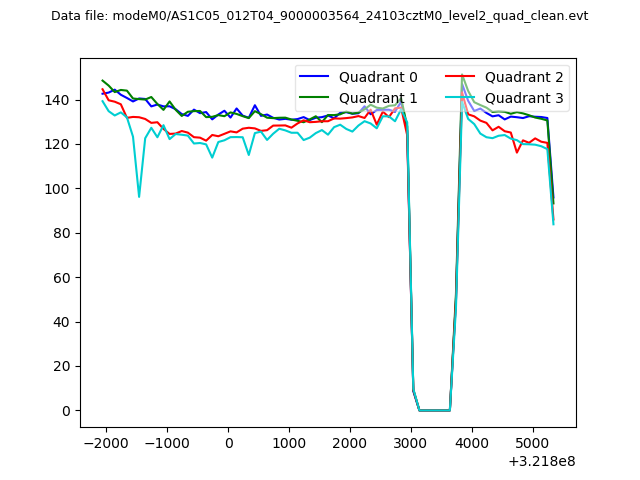 |
|
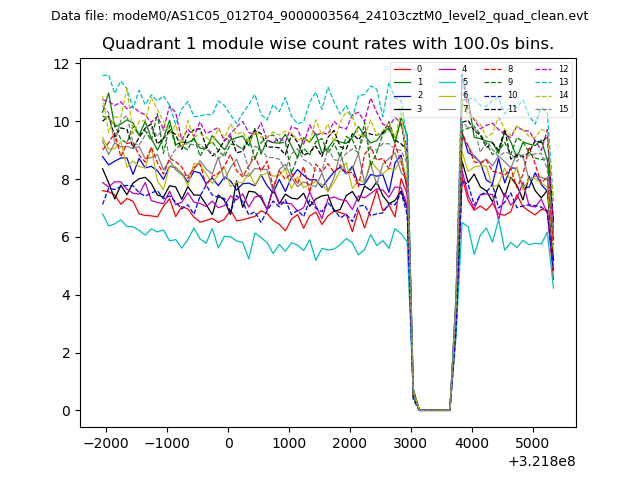
| Module-wise count rates for Quadrant A Data is divided into 100 sec bins |
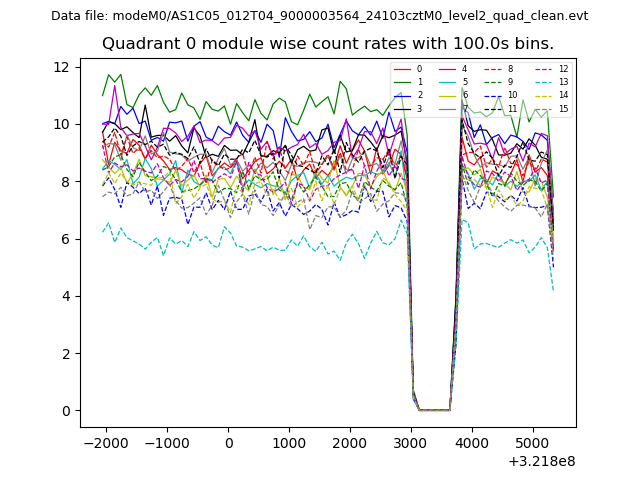 |
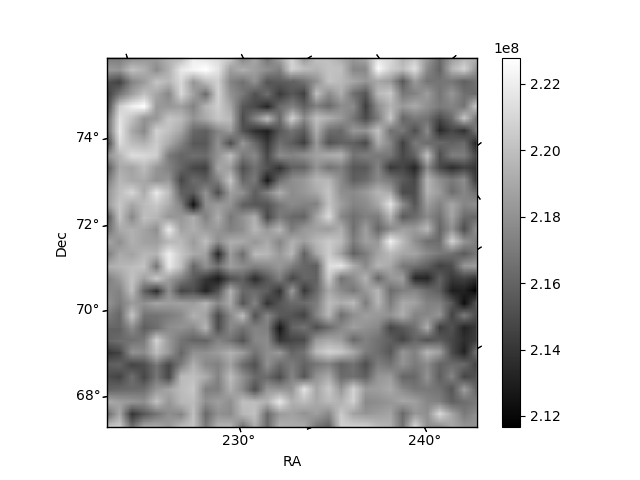 |
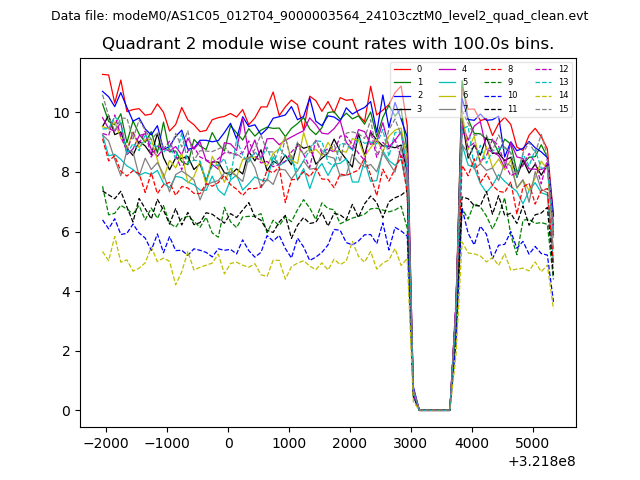
| Module-wise count rates for Quadrant B Data is divided into 100 sec bins |
 |
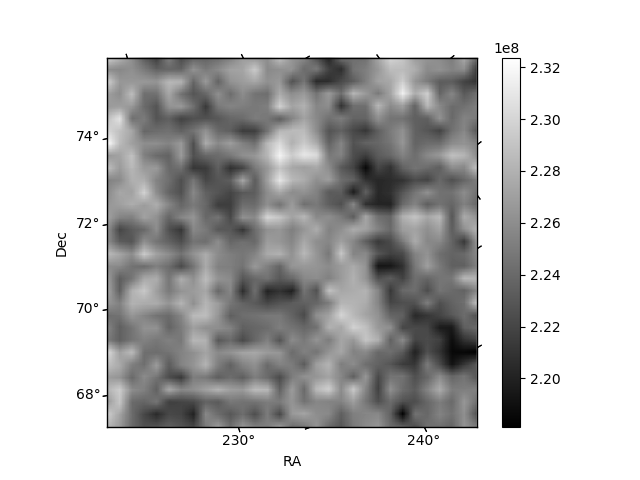 |
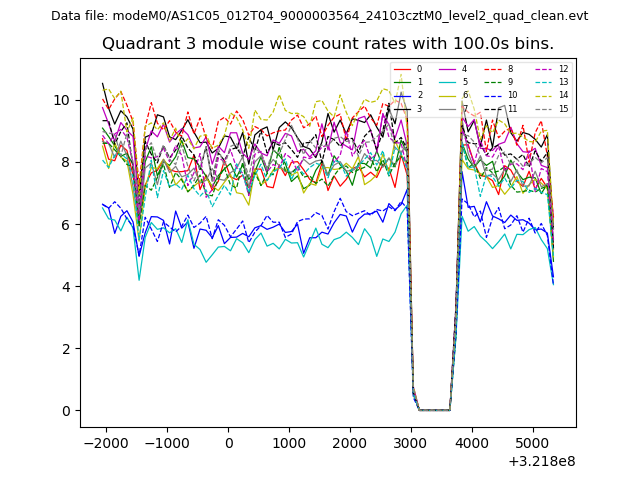
| Module-wise count rates for Quadrant C Data is divided into 100 sec bins |
 |
 |
| Module-wise count rates for Quadrant D Data is divided into 100 sec bins |
 |
 |
| Parameter | Plot |
|---|---|
| CZT HV Monitor | 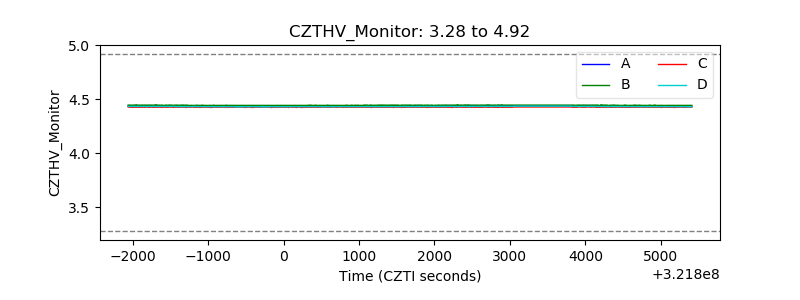 |
| D_VDD | 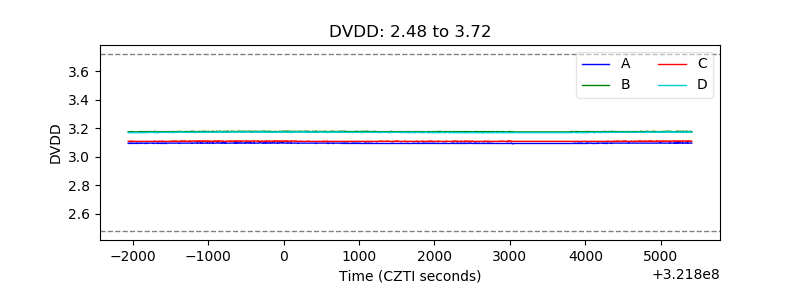 |
| Temperature 1 | 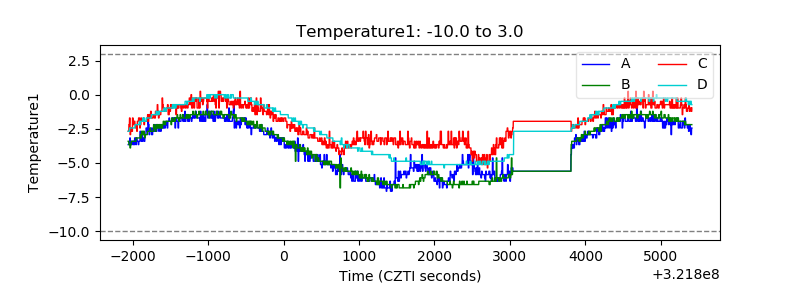 |
| Veto HV Monitor | 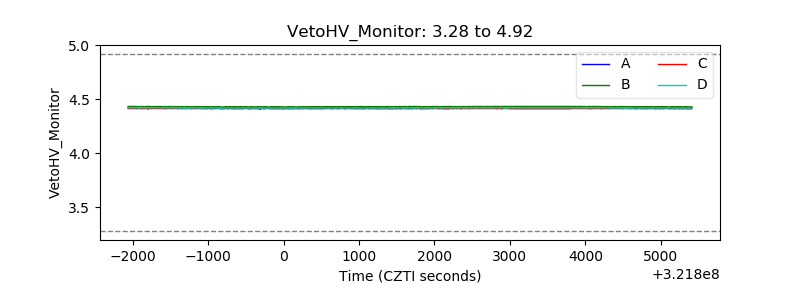 |
| Veto LLD | 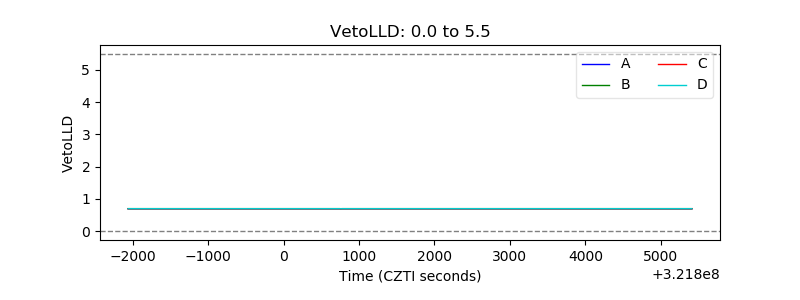 |
| Alpha Counter |  |
| _CPM_Rate |  |
| CZT Counter | 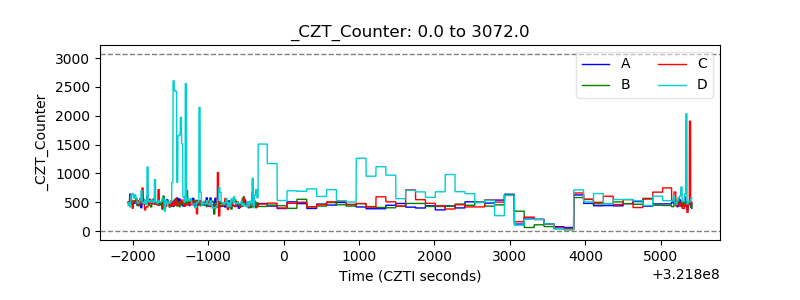 |
| +2.5 Volts monitor |  |
| +5 Volts monitor |  |
| _ROLL_ROT | 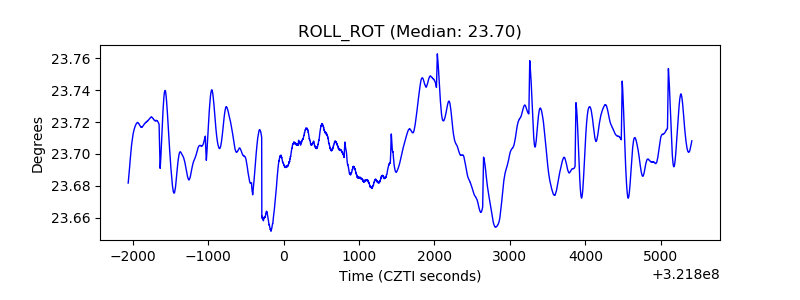 |
| _Roll_DEC | 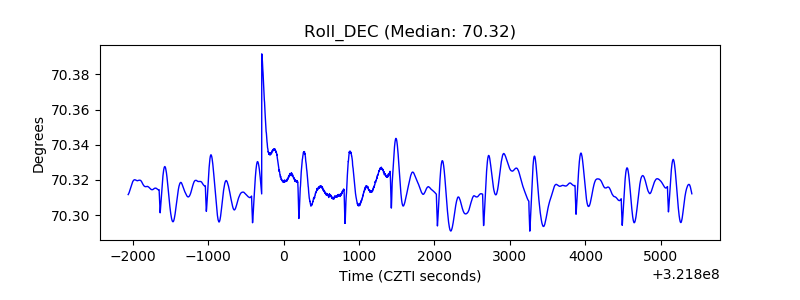 |
| _Roll_RA | 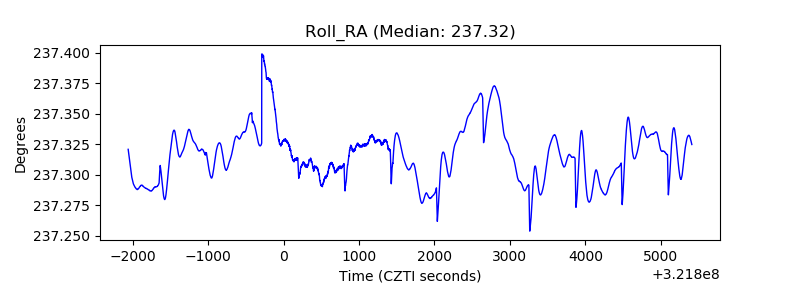 |
| Veto Counter | 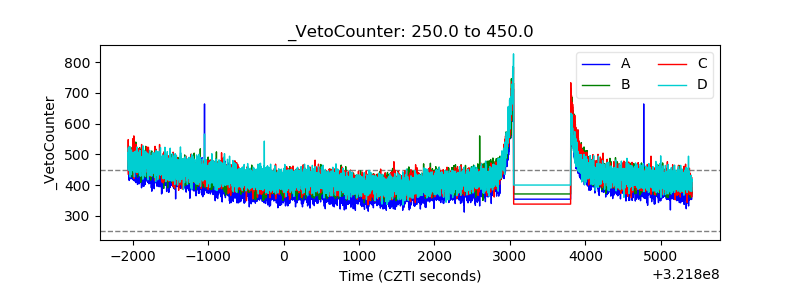 |