| Param | Original file | Final file |
|---|---|---|
| Filename | modeM0/AS1C05_012T04_9000003564_24104cztM0_level2.evt | modeM0/AS1C05_012T04_9000003564_24104cztM0_level2_quad_clean.evt |
| Size (bytes) | 542,396,160 | 138,614,400 |
| Size | 517.3 MB | 132.2 MB |
| Events in quadrant A | 3,388,012 | 949,316 |
| Events in quadrant B | 3,451,452 | 956,819 |
| Events in quadrant C | 3,591,998 | 908,840 |
| Events in quadrant D | 5,501,275 | 876,692 |
| Mode SS | |||
|---|---|---|---|
| Quadrant | BADHDUFLAG | Total packets | Discarded packets |
| A | 0 | 148 | 0 |
| B | 0 | 148 | 0 |
| C | 0 | 148 | 0 |
| D | 0 | 148 | 0 |
| Mode M0 | |||
|---|---|---|---|
| Quadrant | BADHDUFLAG | Total packets | Discarded packets |
| A | 0 | 14798 | 1 |
| B | 0 | 14970 | 1 |
| C | 0 | 15370 | 1 |
| D | 0 | 21311 | 1 |
| Mode M9 | |||
|---|---|---|---|
| Quadrant | BADHDUFLAG | Total packets | Discarded packets |
| A | 0 | 4 | 0 |
| B | 0 | 4 | 0 |
| C | 0 | 4 | 0 |
| D | 0 | 4 | 0 |
| Quadrant | Total seconds | Saturated seconds | Saturation percentage |
|---|---|---|---|
| A | 7277 | 54 | 0.742064% |
| B | 7278 | 69 | 0.948063% |
| C | 7277 | 145 | 1.992579% |
| D | 7277 | 327 | 4.493610% |
Noise dominated data is calculated using 1-second bins in cleaned event files. If a bin has >2000 counts, and if more than 50% of those come from <1% of pixels, then it is considered to be noise-dominated and hence unusable.
| Quadrant | # 1 sec bins | Bins with >0 counts | Bins with >2000 counts | High rate bins dominated by noise | Noise dominated (total time) | Noise dominated (detector-on time) | Marked lightcurve |
|---|---|---|---|---|---|---|---|
| A | 7662 | 7278 | 0 | 0 | 0.00% | 0.00% | 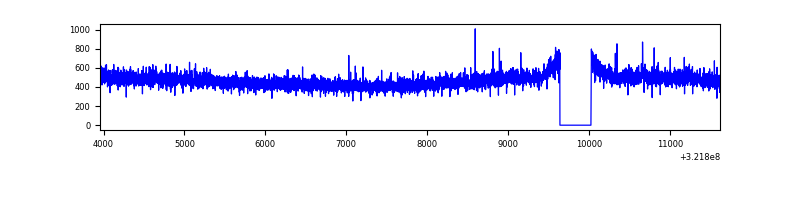 |
| B | 7663 | 7279 | 0 | 0 | 0.00% | 0.00% | 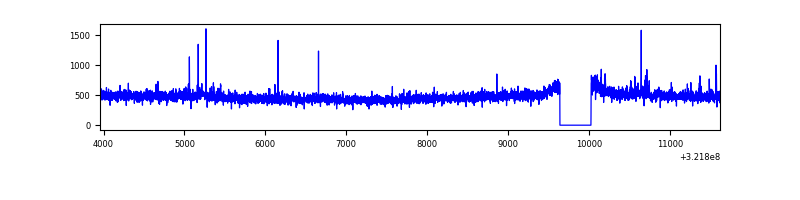 |
| C | 7662 | 7278 | 23 | 23 | 0.30% | 0.32% | 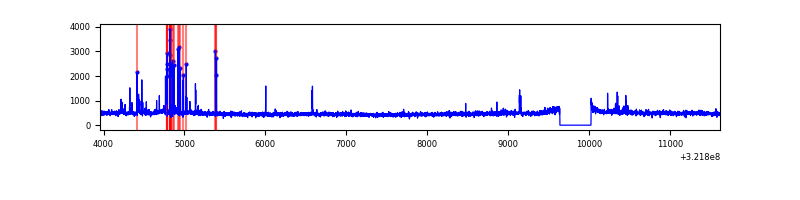 |
| D | 7662 | 7278 | 250 | 250 | 3.26% | 3.44% | 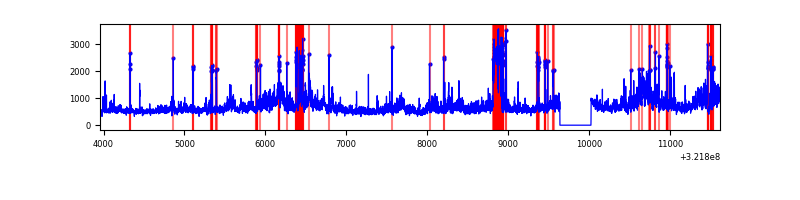 |
Top three noisy pixels from each quadrant. If the there are fewer than three noisy pixels in the level2.evt file, extra rows are filled as -1
| Pixel properties | Quadrant properties | ||||||
|---|---|---|---|---|---|---|---|
| Quadrant | DetID | PixID | Counts | Sigma | Mean | Median | Sigma |
| A | 13 | 254 | 13755 | 73.5 | 873 | 854 | 175.5 |
| A | 2 | 250 | 10000 | 52.11 | 873 | 854 | 175.5 |
| A | 4 | 2 | 9106 | 47.01 | 873 | 854 | 175.5 |
| B | 0 | 229 | 32978 | 197.16 | 866 | 844 | 163.0 |
| B | 12 | 111 | 19314 | 113.33 | 866 | 844 | 163.0 |
| B | 11 | 111 | 17071 | 99.56 | 866 | 844 | 163.0 |
| C | 0 | 239 | 192271 | 988.72 | 831 | 835 | 193.6 |
| C | 14 | 238 | 131202 | 673.31 | 831 | 835 | 193.6 |
| C | 7 | 247 | 19870 | 98.31 | 831 | 835 | 193.6 |
| D | 8 | 195 | 1408240 | 6922.68 | 840 | 813 | 203.3 |
| D | 11 | 176 | 425097 | 2086.92 | 840 | 813 | 203.3 |
| D | 1 | 52 | 260008 | 1274.9 | 840 | 813 | 203.3 |
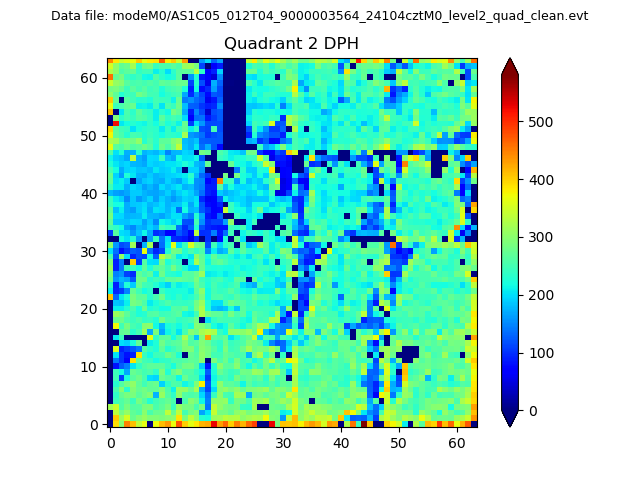
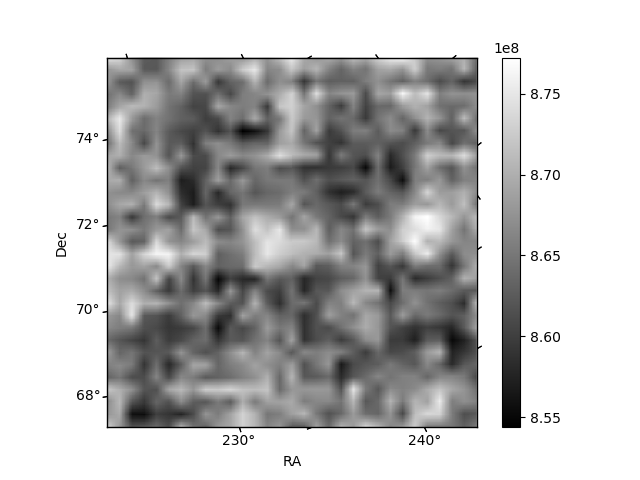
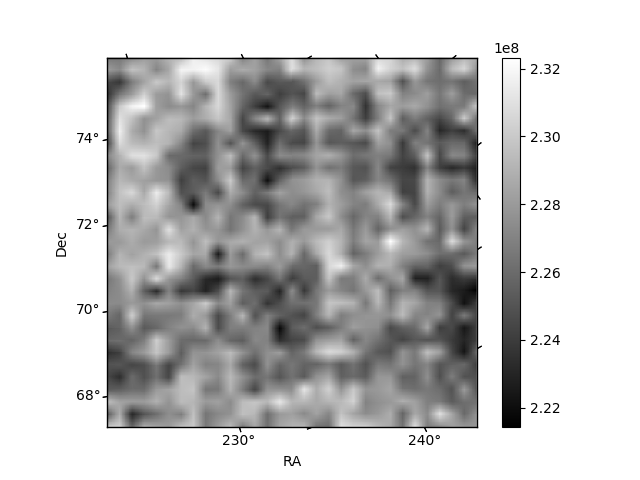
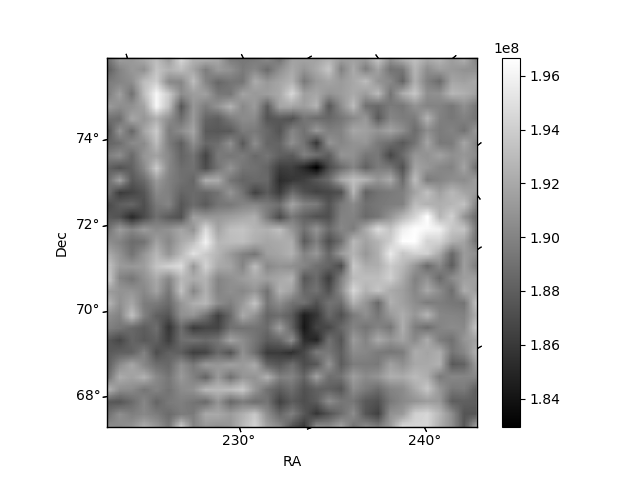
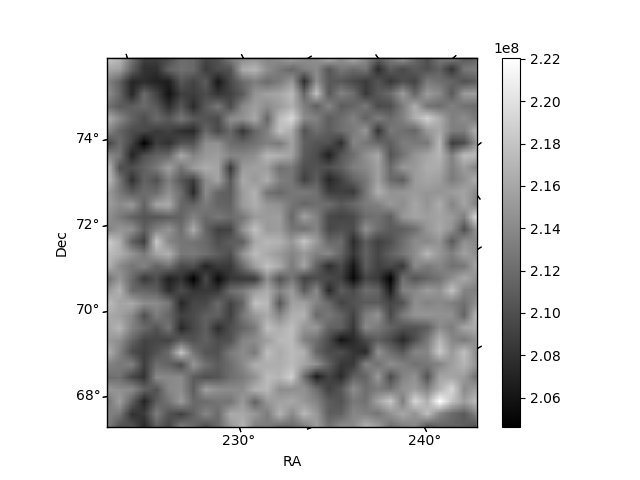
Histogram calculated using DETX and DETY for each event in the final _common_clean file
| Quadrant A | 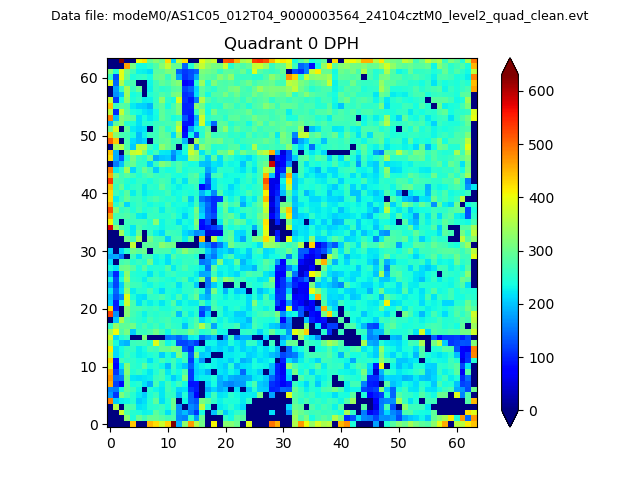 |
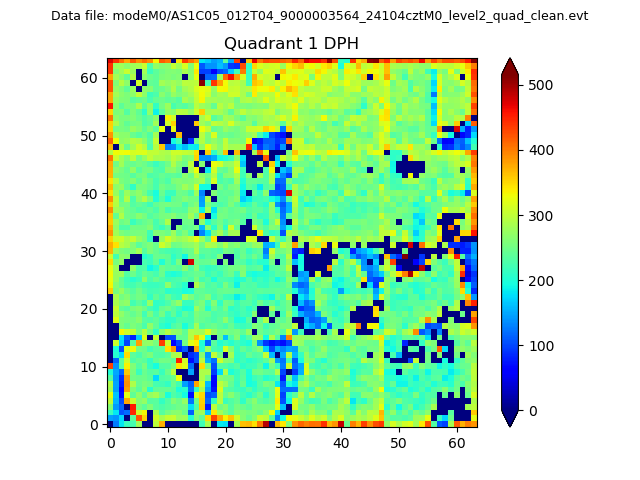 |
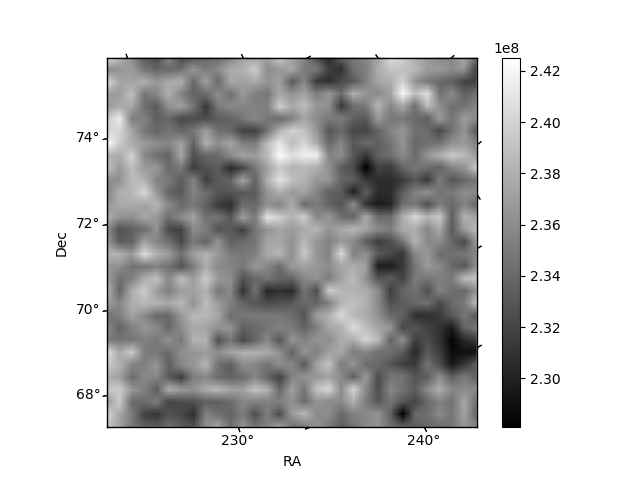
Quadrant B |
|---|---|---|---|
| Quadrant D | 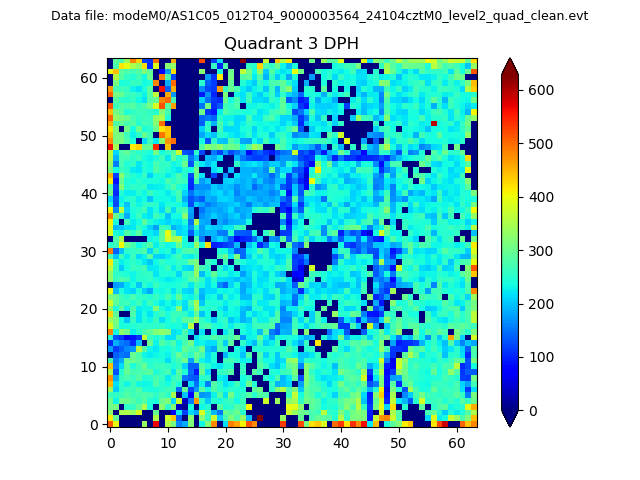 |
 |
Quadrant C |
| Plot type | Count rate plots | Images |
|---|---|---|
| Comparison with Poisson distribution Blue bars denote a histogram of data divided into 1 sec bins. Red curve is a Poisson curve with rate = median count rate of data. |
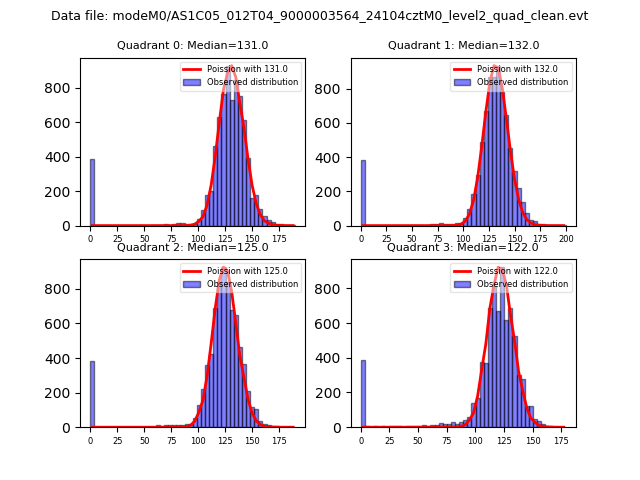 |
 |
| Quadrant-wise count rates Data is divided into 100 sec bins |
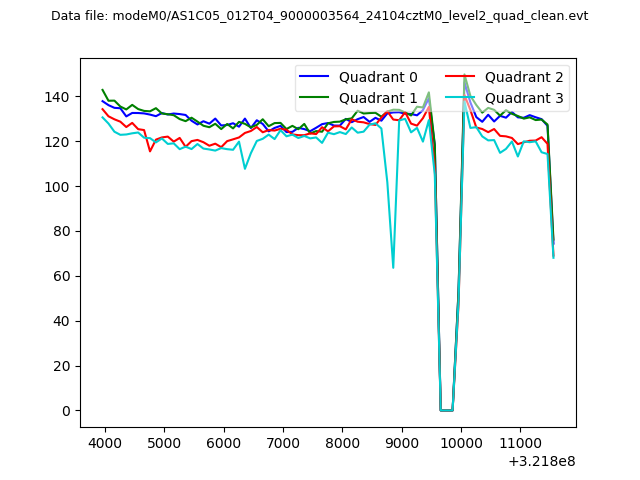 |
|
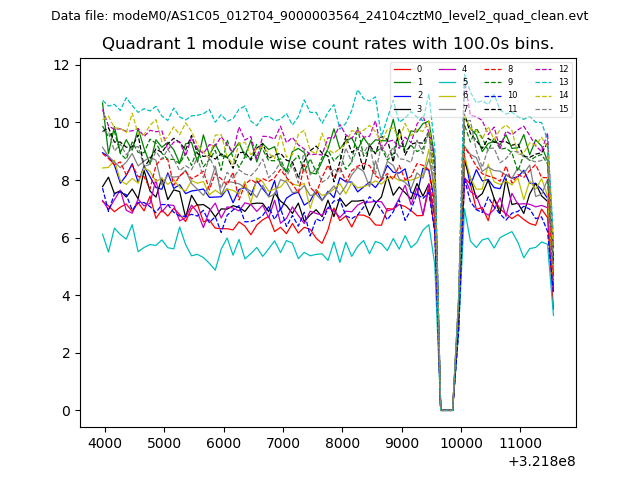
| Module-wise count rates for Quadrant A Data is divided into 100 sec bins |
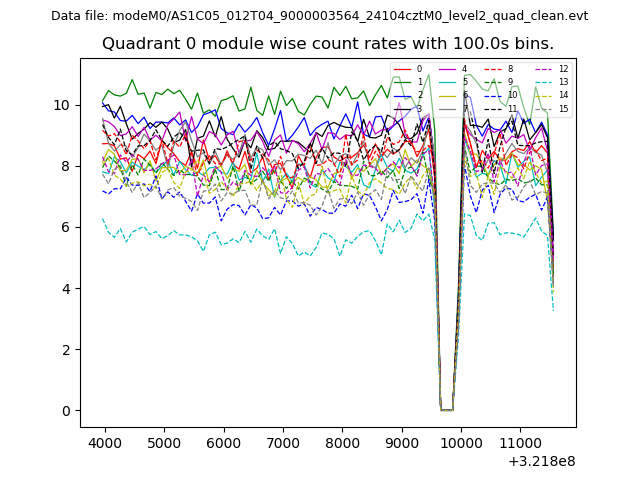 |
 |
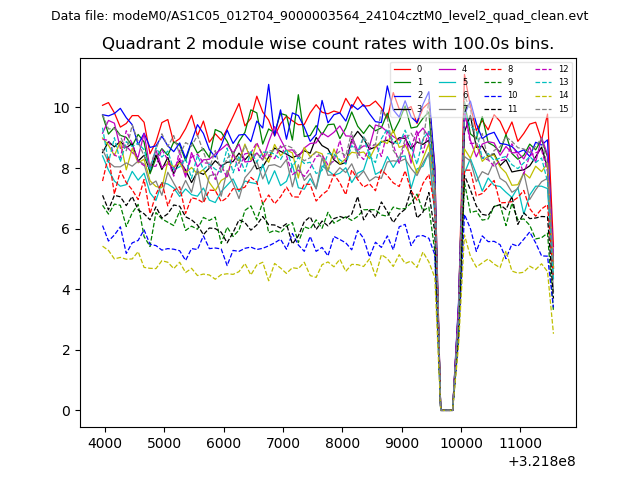
| Module-wise count rates for Quadrant B Data is divided into 100 sec bins |
 |
 |
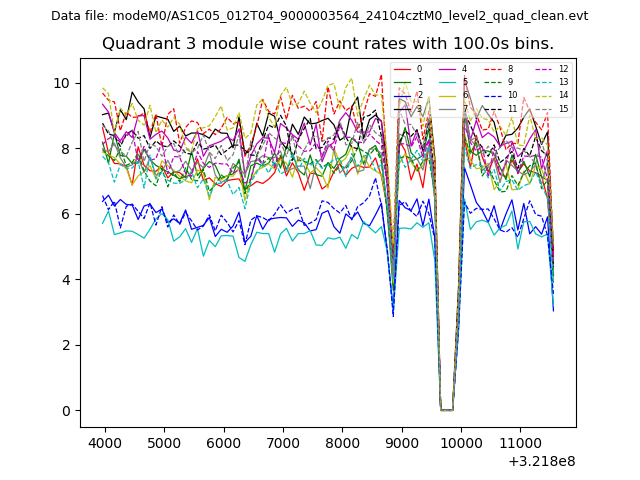
| Module-wise count rates for Quadrant C Data is divided into 100 sec bins |
 |
 |
| Module-wise count rates for Quadrant D Data is divided into 100 sec bins |
 |
 |
| Parameter | Plot |
|---|---|
| CZT HV Monitor | 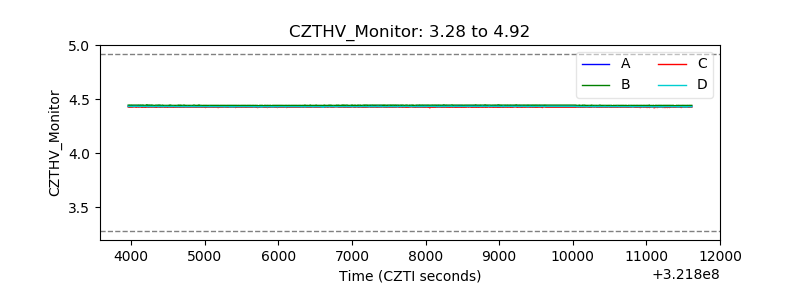 |
| D_VDD | 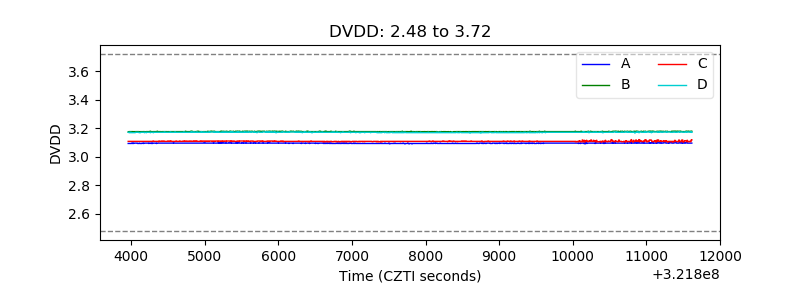 |
| Temperature 1 | 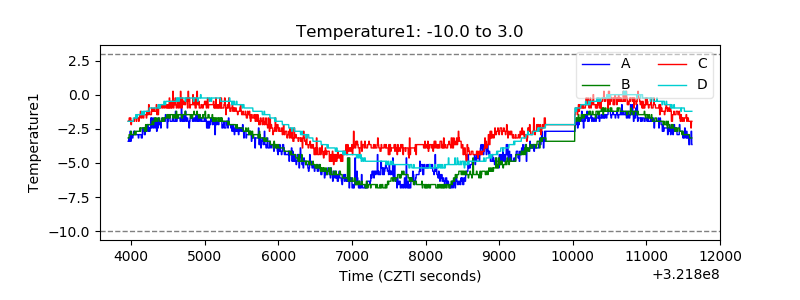 |
| Veto HV Monitor | 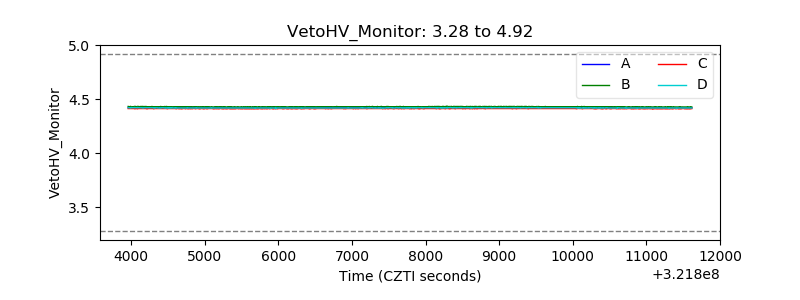 |
| Veto LLD | 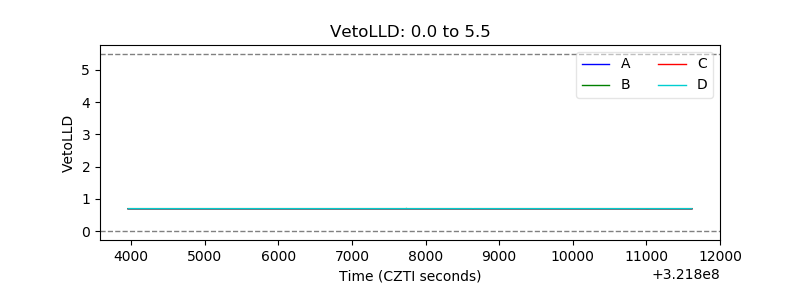 |
| Alpha Counter | 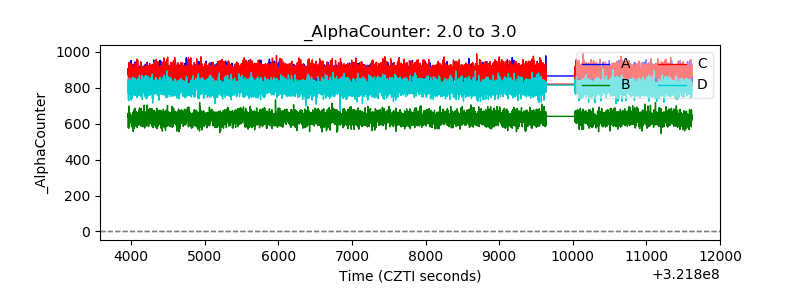 |
| _CPM_Rate | 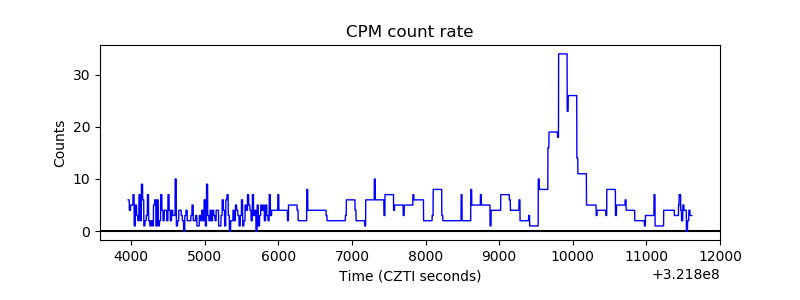 |
| CZT Counter | 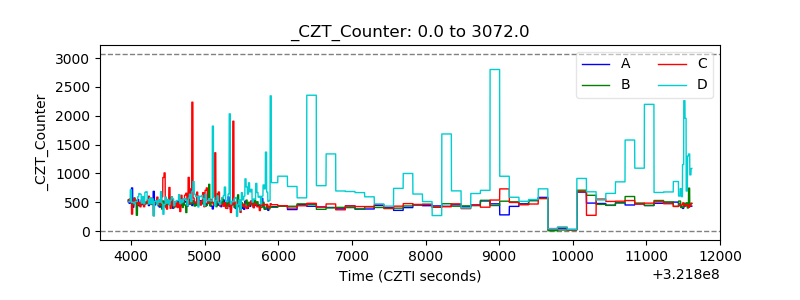 |
| +2.5 Volts monitor |  |
| +5 Volts monitor |  |
| _ROLL_ROT | 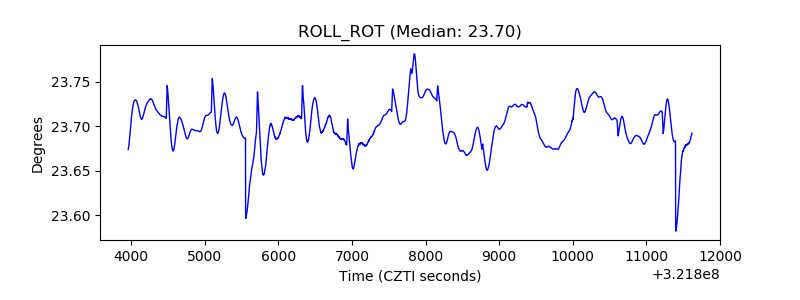 |
| _Roll_DEC | 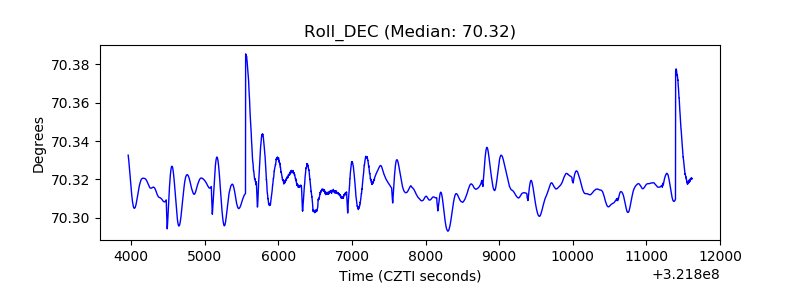 |
| _Roll_RA | 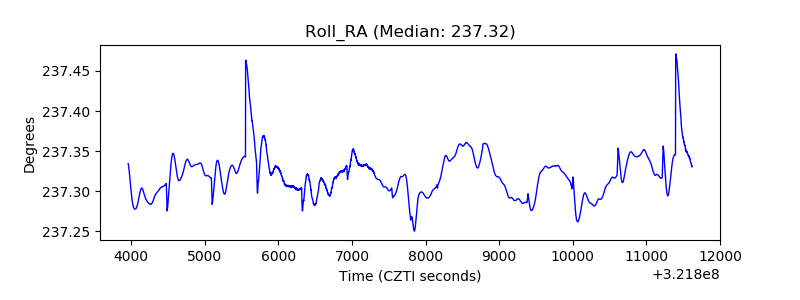 |
| Veto Counter | 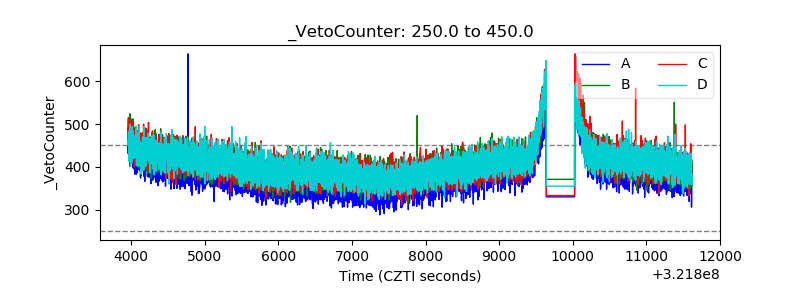 |