| Param | Original file | Final file |
|---|---|---|
| Filename | modeM0/AS1C05_012T04_9000003564_24106cztM0_level2.evt | modeM0/AS1C05_012T04_9000003564_24106cztM0_level2_quad_clean.evt |
| Size (bytes) | 574,194,240 | 133,894,080 |
| Size | 547.6 MB | 127.7 MB |
| Events in quadrant A | 3,306,987 | 912,383 |
| Events in quadrant B | 3,713,936 | 911,008 |
| Events in quadrant C | 3,480,830 | 881,000 |
| Events in quadrant D | 6,400,651 | 850,299 |
| Mode SS | |||
|---|---|---|---|
| Quadrant | BADHDUFLAG | Total packets | Discarded packets |
| A | 0 | 146 | 0 |
| B | 0 | 146 | 0 |
| C | 0 | 146 | 0 |
| D | 0 | 146 | 0 |
| Mode M0 | |||
|---|---|---|---|
| Quadrant | BADHDUFLAG | Total packets | Discarded packets |
| A | 0 | 14602 | 1 |
| B | 0 | 15737 | 1 |
| C | 0 | 14945 | 1 |
| D | 0 | 24072 | 2 |
| Mode M9 | |||
|---|---|---|---|
| Quadrant | BADHDUFLAG | Total packets | Discarded packets |
| A | 0 | 4 | 0 |
| B | 0 | 4 | 0 |
| C | 0 | 4 | 0 |
| D | 0 | 4 | 0 |
| Quadrant | Total seconds | Saturated seconds | Saturation percentage |
|---|---|---|---|
| A | 7189 | 15 | 0.208652% |
| B | 7190 | 133 | 1.849791% |
| C | 7190 | 79 | 1.098748% |
| D | 7189 | 187 | 2.601196% |
Noise dominated data is calculated using 1-second bins in cleaned event files. If a bin has >2000 counts, and if more than 50% of those come from <1% of pixels, then it is considered to be noise-dominated and hence unusable.
| Quadrant | # 1 sec bins | Bins with >0 counts | Bins with >2000 counts | High rate bins dominated by noise | Noise dominated (total time) | Noise dominated (detector-on time) | Marked lightcurve |
|---|---|---|---|---|---|---|---|
| A | 7609 | 7190 | 0 | 0 | 0.00% | 0.00% | 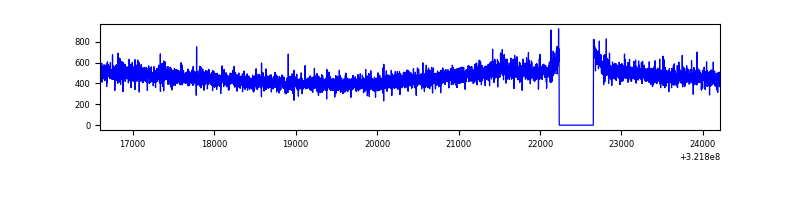 |
| B | 7610 | 7191 | 91 | 91 | 1.20% | 1.27% | 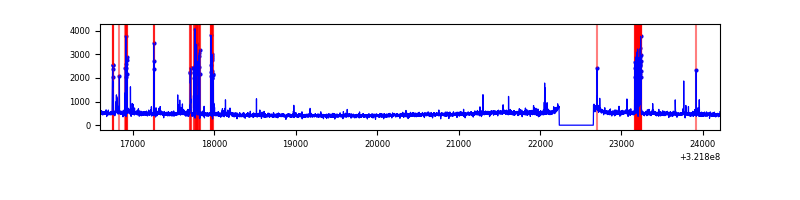 |
| C | 7610 | 7191 | 14 | 14 | 0.18% | 0.19% | 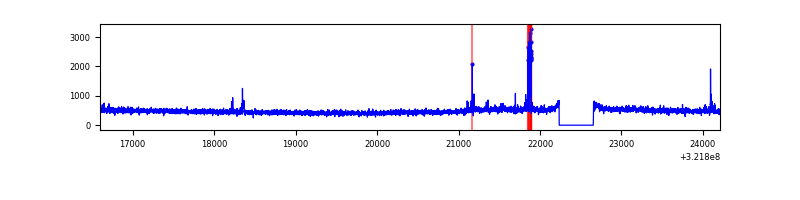 |
| D | 7609 | 7190 | 98 | 98 | 1.29% | 1.36% | 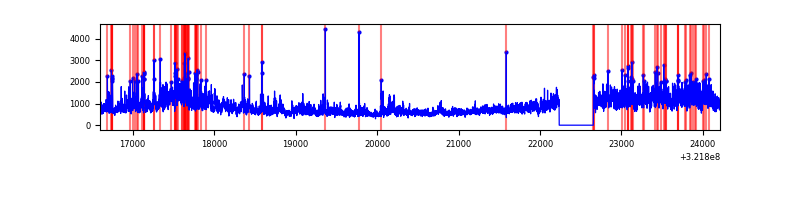 |
Top three noisy pixels from each quadrant. If the there are fewer than three noisy pixels in the level2.evt file, extra rows are filled as -1
| Pixel properties | Quadrant properties | ||||||
|---|---|---|---|---|---|---|---|
| Quadrant | DetID | PixID | Counts | Sigma | Mean | Median | Sigma |
| A | 13 | 254 | 13040 | 70.53 | 853 | 832 | 173.1 |
| A | 2 | 250 | 8973 | 47.03 | 853 | 832 | 173.1 |
| A | 3 | 137 | 7638 | 39.32 | 853 | 832 | 173.1 |
| B | 0 | 245 | 253353 | 1578.44 | 842 | 822 | 160.0 |
| B | 5 | 172 | 76348 | 472.08 | 842 | 822 | 160.0 |
| B | 0 | 229 | 35998 | 219.87 | 842 | 822 | 160.0 |
| C | 14 | 238 | 130517 | 675.83 | 820 | 822 | 191.9 |
| C | 7 | 247 | 85798 | 442.8 | 820 | 822 | 191.9 |
| C | 0 | 239 | 58934 | 302.82 | 820 | 822 | 191.9 |
| D | 8 | 195 | 2763966 | 13507.94 | 828 | 802 | 204.6 |
| D | 12 | 233 | 155237 | 754.97 | 828 | 802 | 204.6 |
| D | 1 | 52 | 103444 | 501.77 | 828 | 802 | 204.6 |
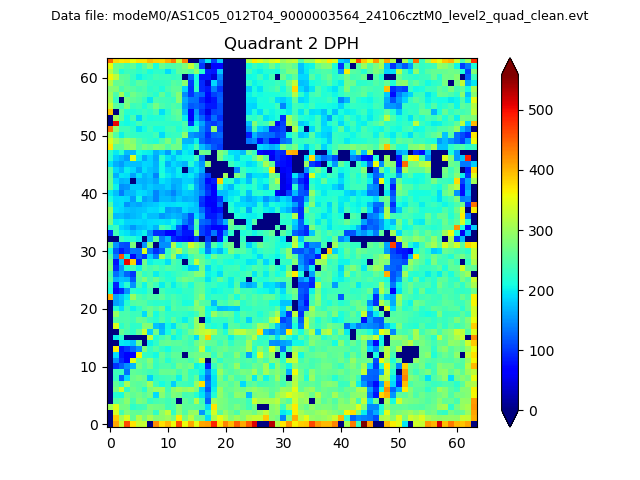
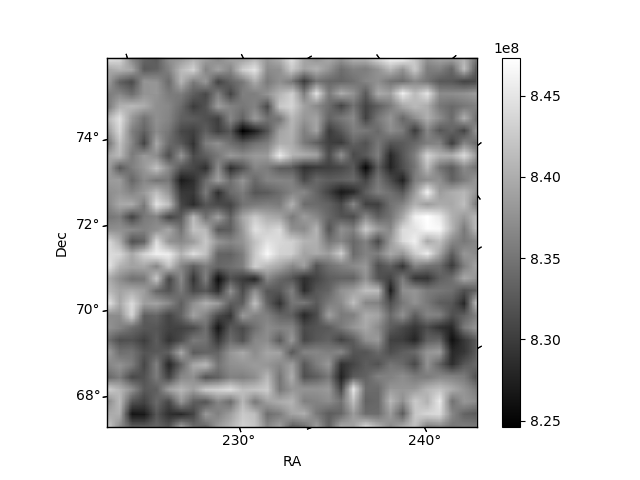
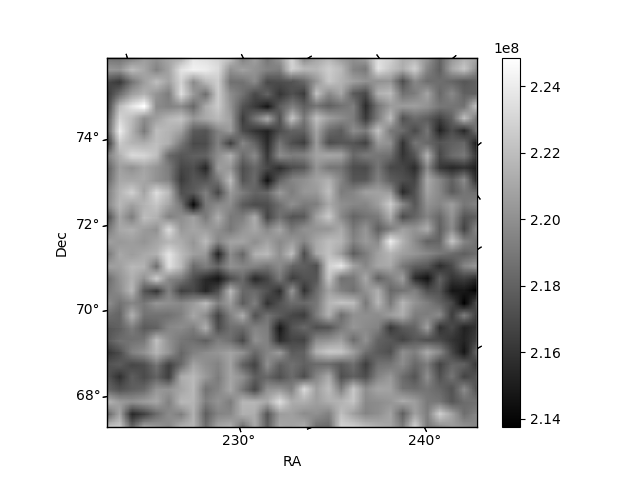
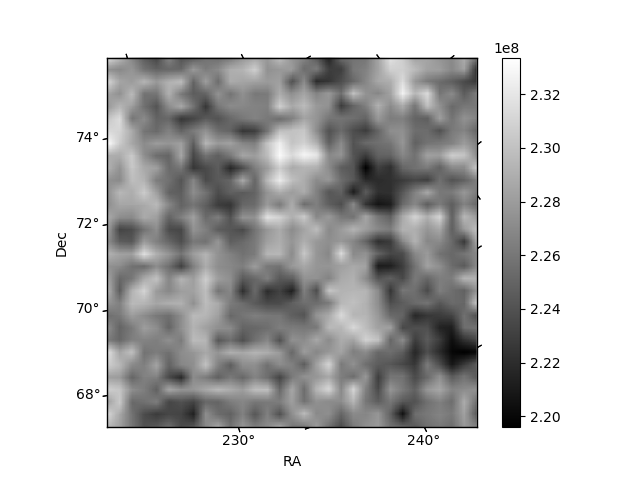
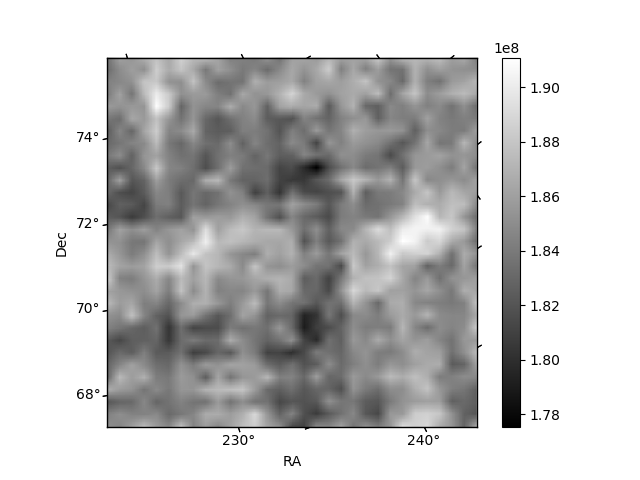
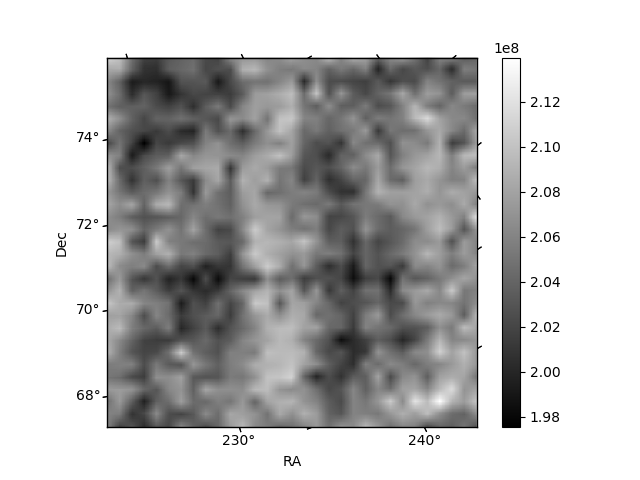
Histogram calculated using DETX and DETY for each event in the final _common_clean file
| Quadrant A | 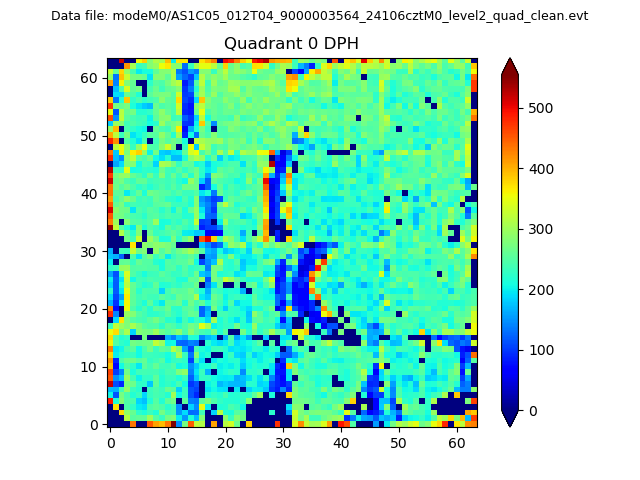 |
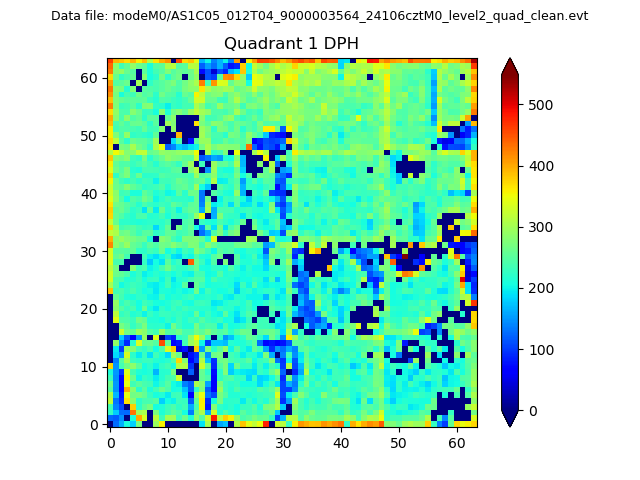 |
Quadrant B |
|---|---|---|---|
| Quadrant D | 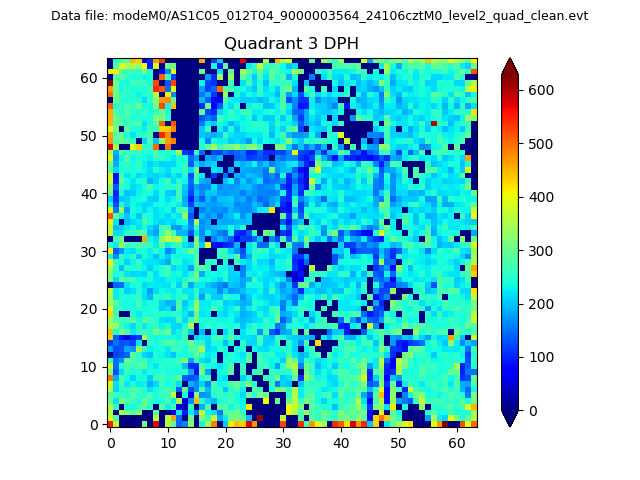 |
 |
Quadrant C |
| Plot type | Count rate plots | Images |
|---|---|---|
| Comparison with Poisson distribution Blue bars denote a histogram of data divided into 1 sec bins. Red curve is a Poisson curve with rate = median count rate of data. |
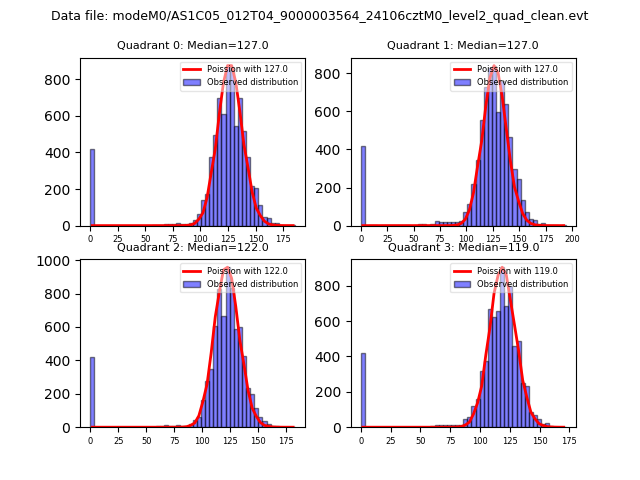 |
 |
| Quadrant-wise count rates Data is divided into 100 sec bins |
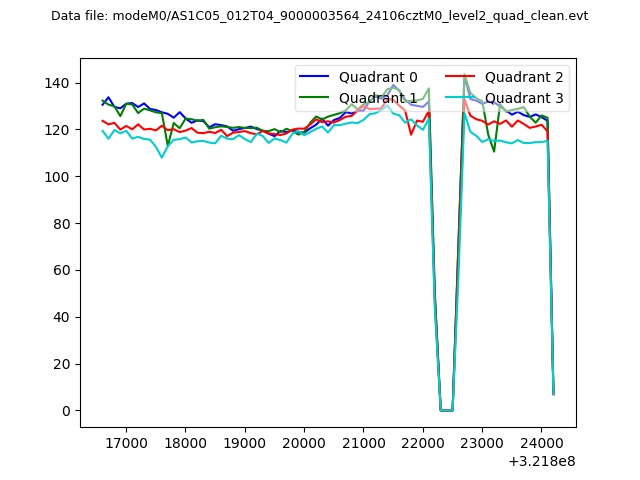 |
|
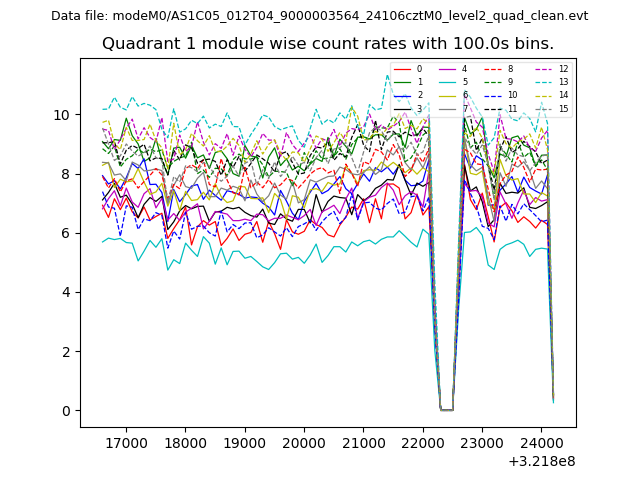
| Module-wise count rates for Quadrant A Data is divided into 100 sec bins |
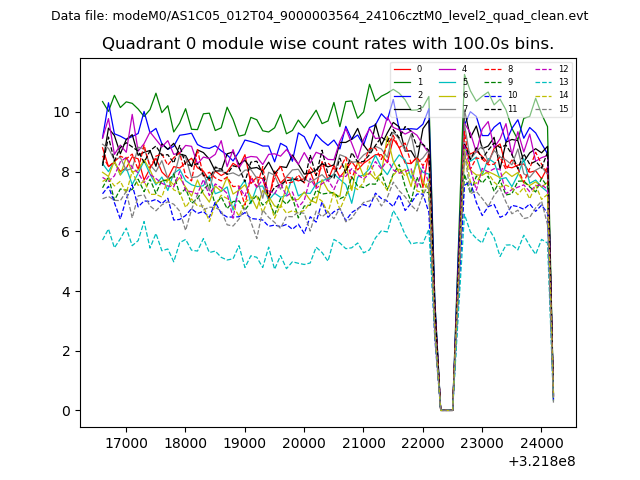 |
 |
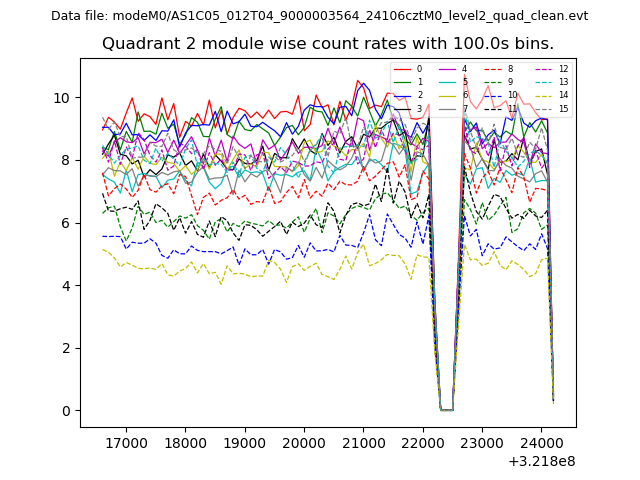
| Module-wise count rates for Quadrant B Data is divided into 100 sec bins |
 |
 |
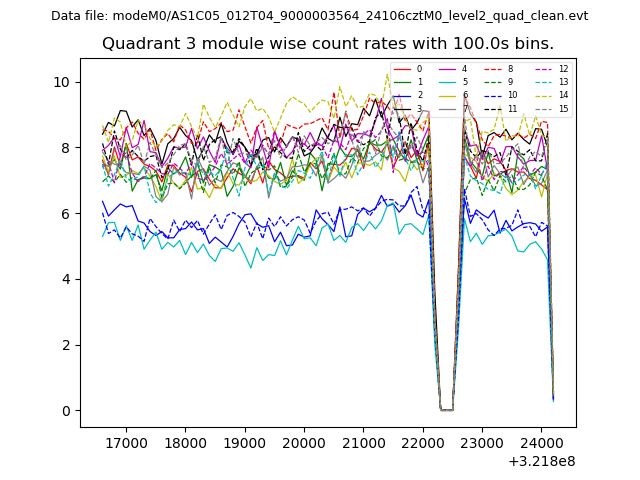
| Module-wise count rates for Quadrant C Data is divided into 100 sec bins |
 |
 |
| Module-wise count rates for Quadrant D Data is divided into 100 sec bins |
 |
 |
| Parameter | Plot |
|---|---|
| CZT HV Monitor | 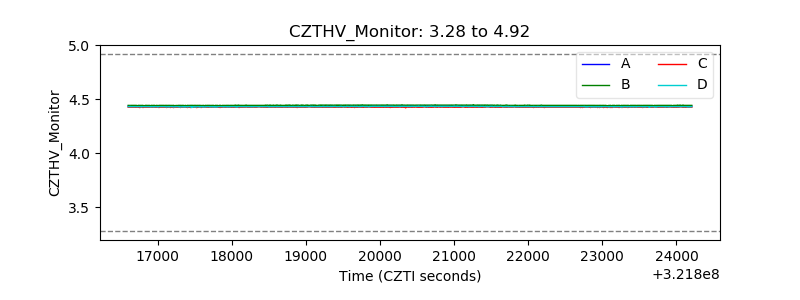 |
| D_VDD | 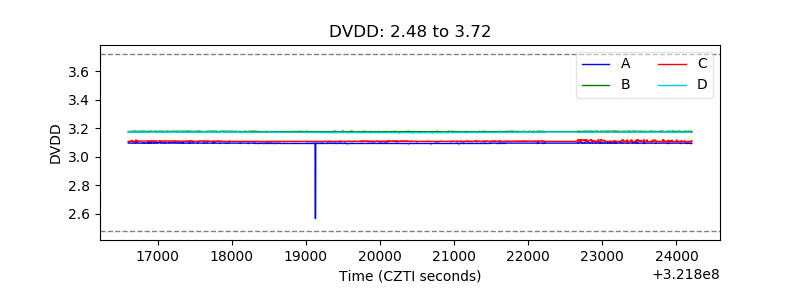 |
| Temperature 1 | 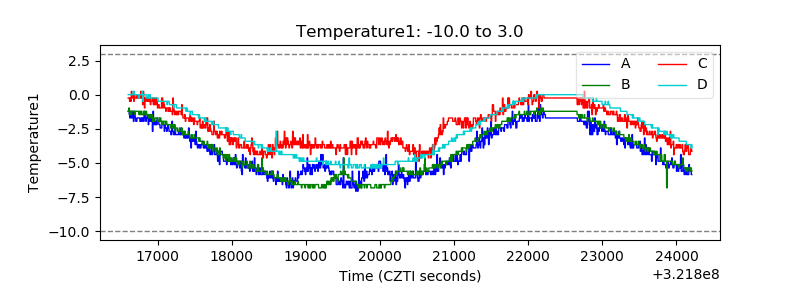 |
| Veto HV Monitor | 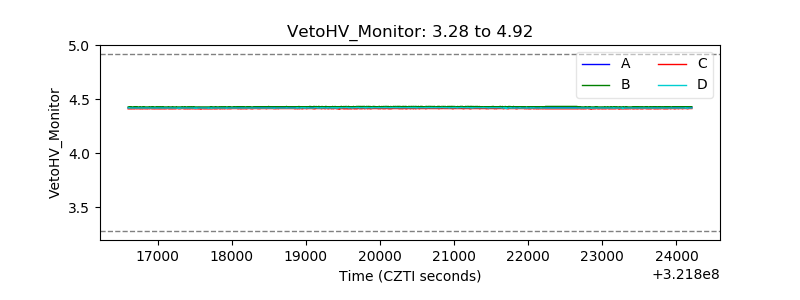 |
| Veto LLD | 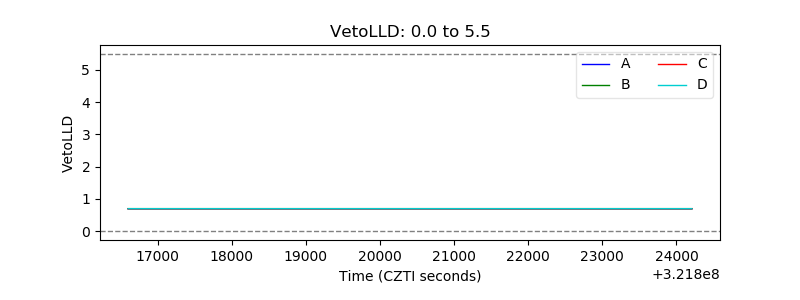 |
| Alpha Counter | 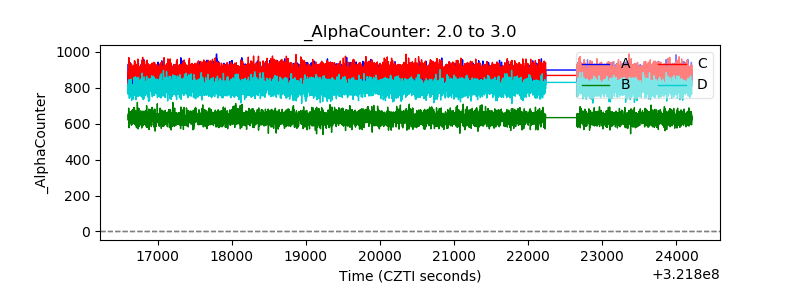 |
| _CPM_Rate | 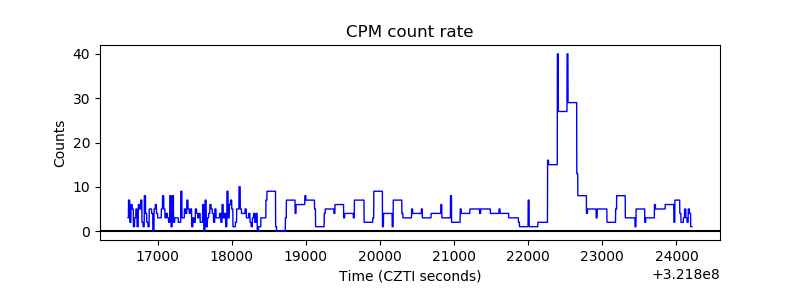 |
| CZT Counter | 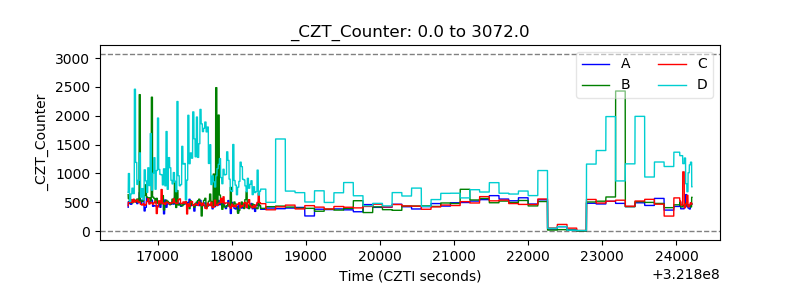 |
| +2.5 Volts monitor | 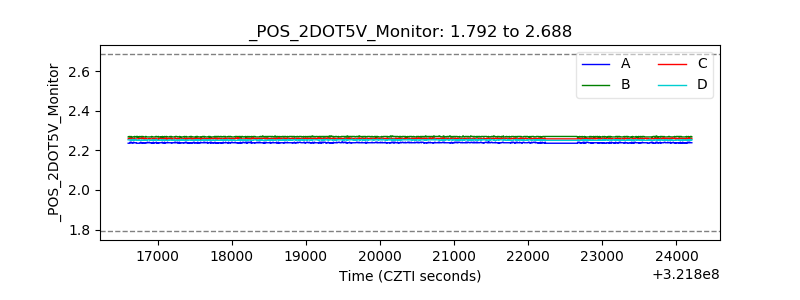 |
| +5 Volts monitor |  |
| _ROLL_ROT | 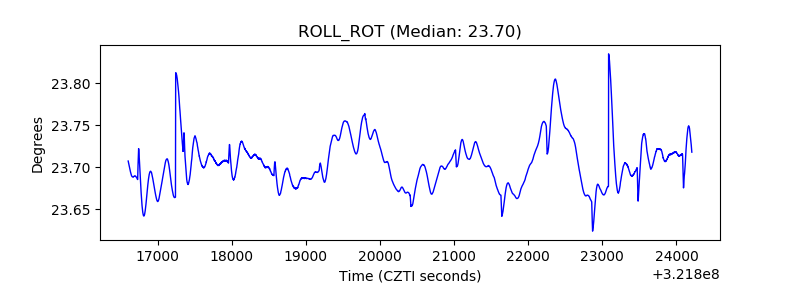 |
| _Roll_DEC | 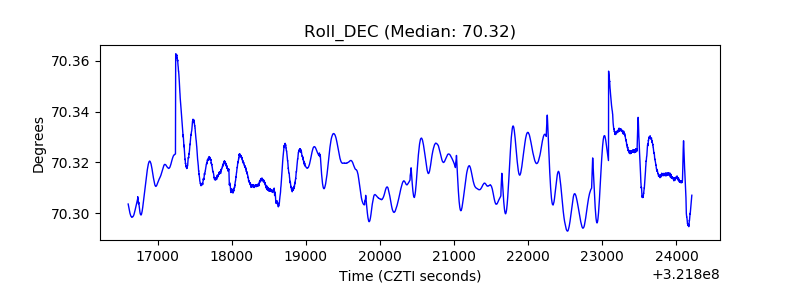 |
| _Roll_RA | 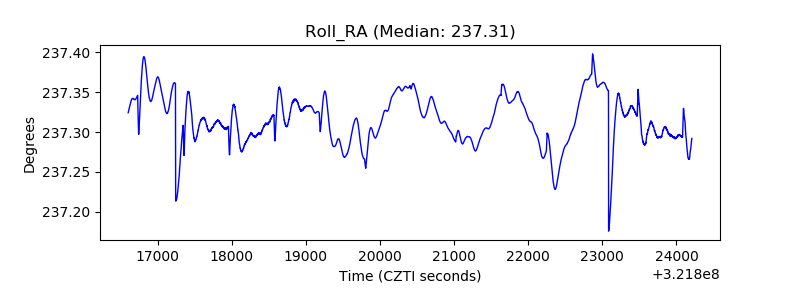 |
| Veto Counter | 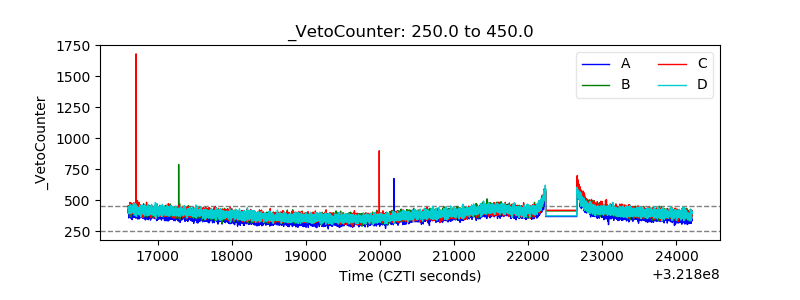 |