| Param | Original file | Final file |
|---|---|---|
| Filename | modeM0/AS1C05_012T04_9000003564_24108cztM0_level2.evt | modeM0/AS1C05_012T04_9000003564_24108cztM0_level2_quad_clean.evt |
| Size (bytes) | 1,009,094,400 | 236,914,560 |
| Size | 962.3 MB | 225.9 MB |
| Events in quadrant A | 5,875,310 | 1,606,558 |
| Events in quadrant B | 6,175,155 | 1,618,349 |
| Events in quadrant C | 6,036,326 | 1,570,984 |
| Events in quadrant D | 11,610,445 | 1,497,049 |
| Mode SS | |||
|---|---|---|---|
| Quadrant | BADHDUFLAG | Total packets | Discarded packets |
| A | 0 | 260 | 0 |
| B | 0 | 260 | 0 |
| C | 0 | 260 | 0 |
| D | 0 | 260 | 0 |
| Mode M0 | |||
|---|---|---|---|
| Quadrant | BADHDUFLAG | Total packets | Discarded packets |
| A | 0 | 26192 | 3 |
| B | 0 | 27048 | 3 |
| C | 0 | 26237 | 3 |
| D | 0 | 43433 | 3 |
| Mode M9 | |||
|---|---|---|---|
| Quadrant | BADHDUFLAG | Total packets | Discarded packets |
| A | 0 | 14 | 0 |
| B | 0 | 15 | 0 |
| C | 0 | 15 | 0 |
| D | 0 | 15 | 0 |
| Quadrant | Total seconds | Saturated seconds | Saturation percentage |
|---|---|---|---|
| A | 12779 | 38 | 0.297363% |
| B | 12779 | 117 | 0.915565% |
| C | 12778 | 135 | 1.056503% |
| D | 12778 | 629 | 4.922523% |
Noise dominated data is calculated using 1-second bins in cleaned event files. If a bin has >2000 counts, and if more than 50% of those come from <1% of pixels, then it is considered to be noise-dominated and hence unusable.
| Quadrant | # 1 sec bins | Bins with >0 counts | Bins with >2000 counts | High rate bins dominated by noise | Noise dominated (total time) | Noise dominated (detector-on time) | Marked lightcurve |
|---|---|---|---|---|---|---|---|
| A | 14099 | 12781 | 0 | 0 | 0.00% | 0.00% | 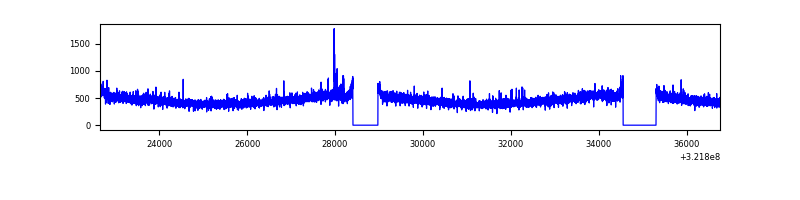 |
| B | 14099 | 12781 | 44 | 44 | 0.31% | 0.34% | 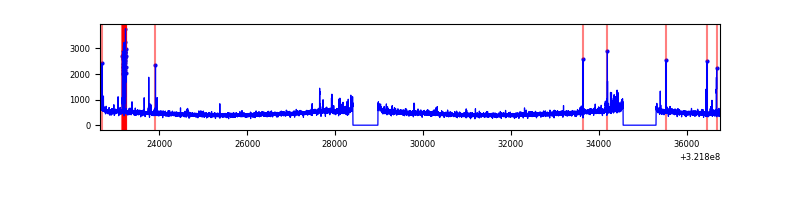 |
| C | 14098 | 12779 | 0 | 0 | 0.00% | 0.00% | 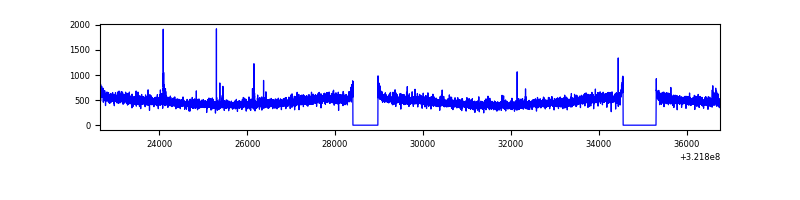 |
| D | 14098 | 12779 | 361 | 361 | 2.56% | 2.82% | 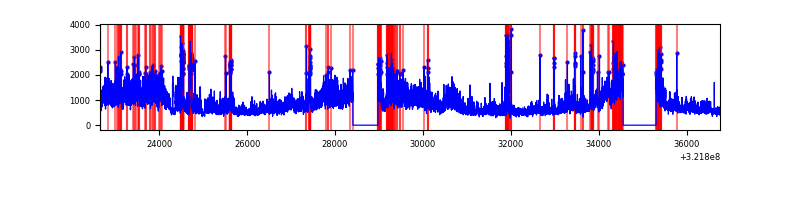 |
Top three noisy pixels from each quadrant. If the there are fewer than three noisy pixels in the level2.evt file, extra rows are filled as -1
| Pixel properties | Quadrant properties | ||||||
|---|---|---|---|---|---|---|---|
| Quadrant | DetID | PixID | Counts | Sigma | Mean | Median | Sigma |
| A | 3 | 1 | 42827 | 136.89 | 1507 | 1473 | 302.1 |
| A | 13 | 254 | 22605 | 69.95 | 1507 | 1473 | 302.1 |
| A | 2 | 250 | 16588 | 50.03 | 1507 | 1473 | 302.1 |
| B | 0 | 245 | 129023 | 455.43 | 1498 | 1464 | 280.1 |
| B | 15 | 33 | 54499 | 189.35 | 1498 | 1464 | 280.1 |
| B | 0 | 229 | 37855 | 129.93 | 1498 | 1464 | 280.1 |
| C | 14 | 238 | 229368 | 675.09 | 1455 | 1463 | 337.6 |
| C | 7 | 247 | 85669 | 249.43 | 1455 | 1463 | 337.6 |
| C | 3 | 233 | 20822 | 57.34 | 1455 | 1463 | 337.6 |
| D | 8 | 195 | 5113712 | 14543.52 | 1450 | 1403 | 351.5 |
| D | 1 | 52 | 656527 | 1863.7 | 1450 | 1403 | 351.5 |
| D | 12 | 233 | 117186 | 329.38 | 1450 | 1403 | 351.5 |
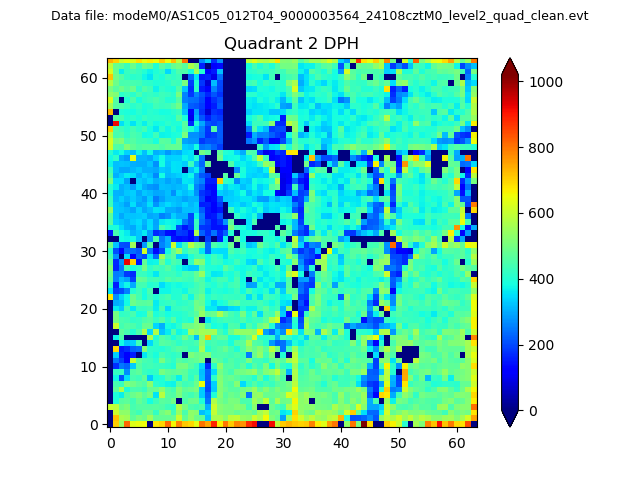
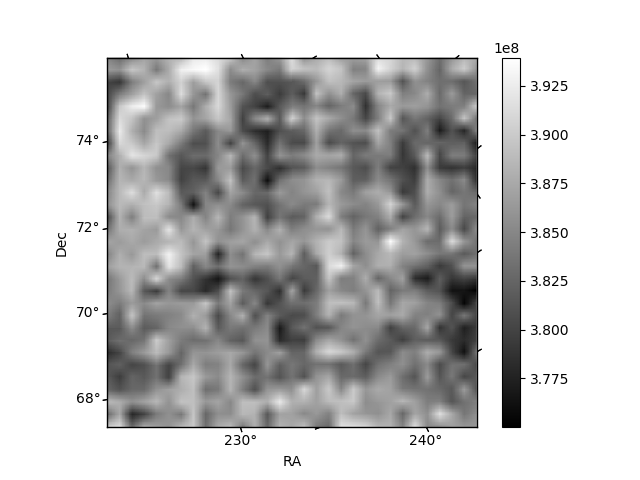
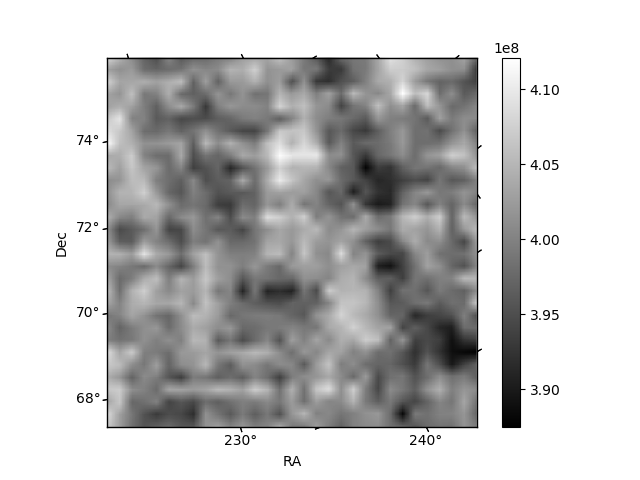
Histogram calculated using DETX and DETY for each event in the final _common_clean file
| Quadrant A | 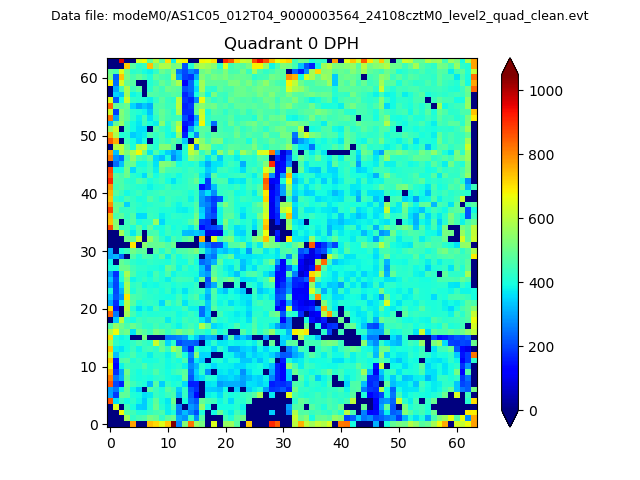 |
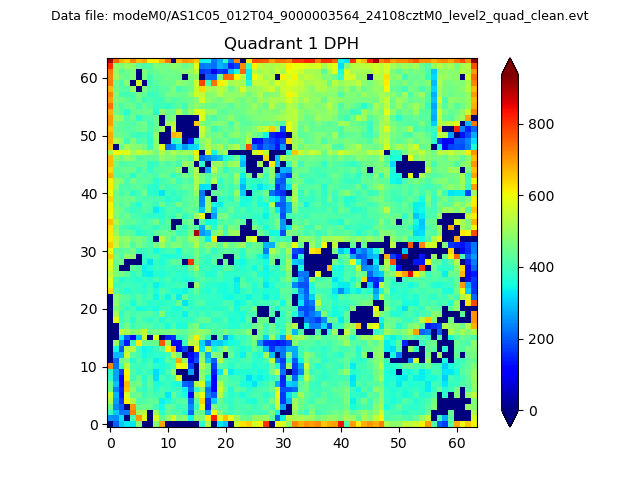 |
Quadrant B |
|---|---|---|---|
| Quadrant D | 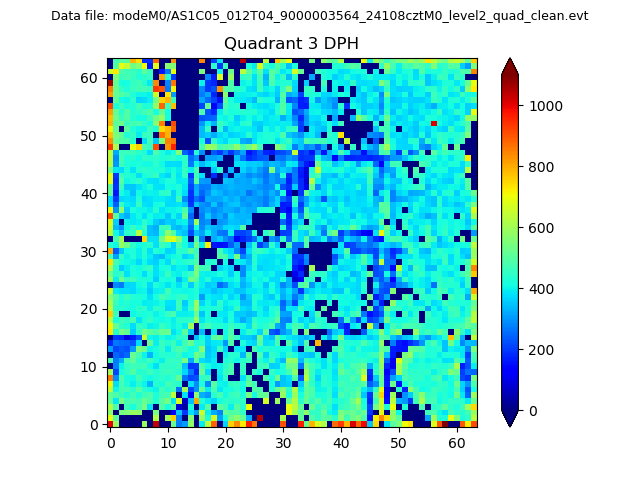 |
 |
Quadrant C |
| Plot type | Count rate plots | Images |
|---|---|---|
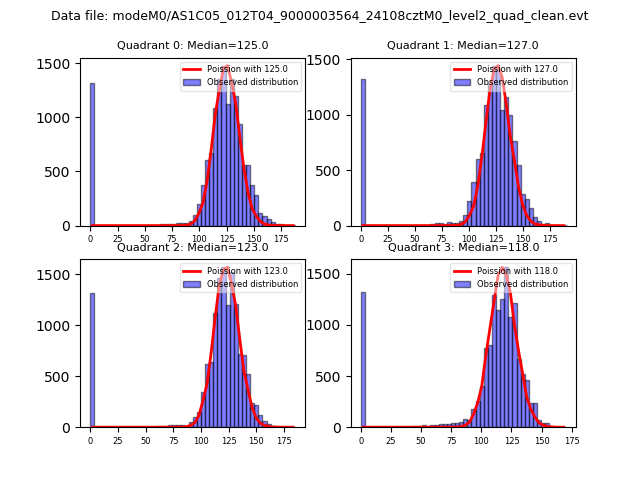
| Comparison with Poisson distribution Blue bars denote a histogram of data divided into 1 sec bins. Red curve is a Poisson curve with rate = median count rate of data. |
 |
 |
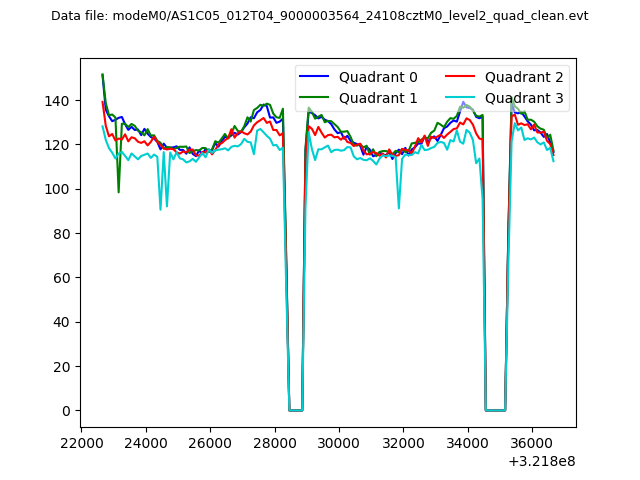
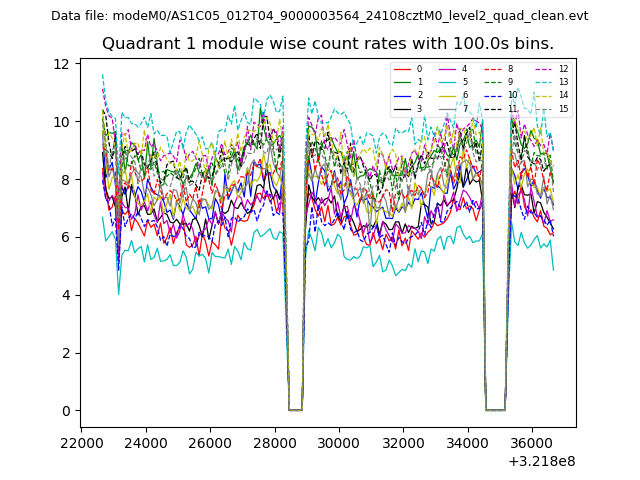
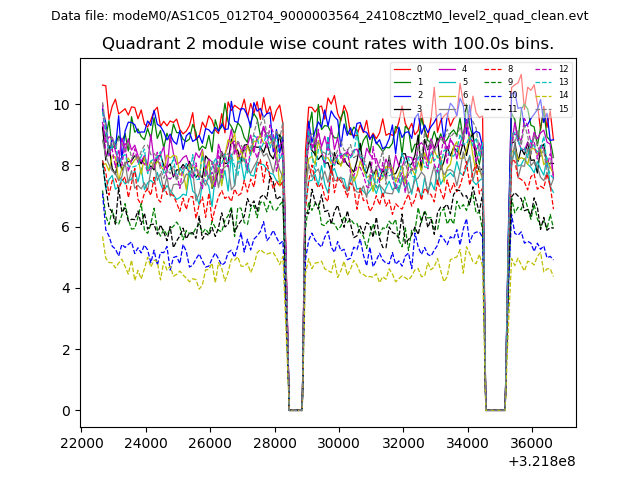
| Quadrant-wise count rates Data is divided into 100 sec bins |
 |
|
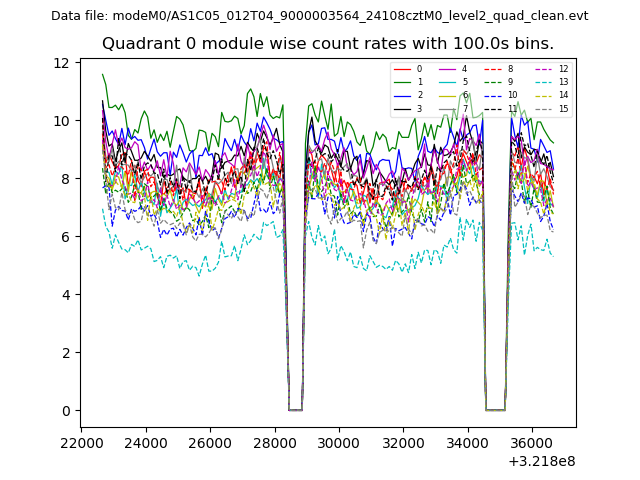
| Module-wise count rates for Quadrant A Data is divided into 100 sec bins |
 |
 |
| Module-wise count rates for Quadrant B Data is divided into 100 sec bins |
 |
 |
| Module-wise count rates for Quadrant C Data is divided into 100 sec bins |
 |
 |
| Module-wise count rates for Quadrant D Data is divided into 100 sec bins |
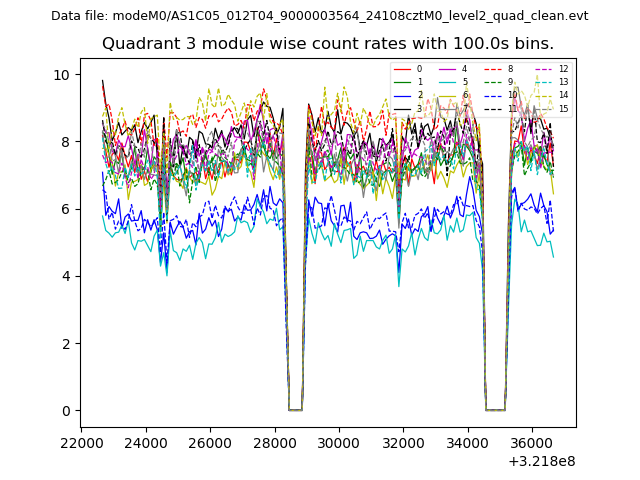 |
 |
| Parameter | Plot |
|---|---|
| CZT HV Monitor | 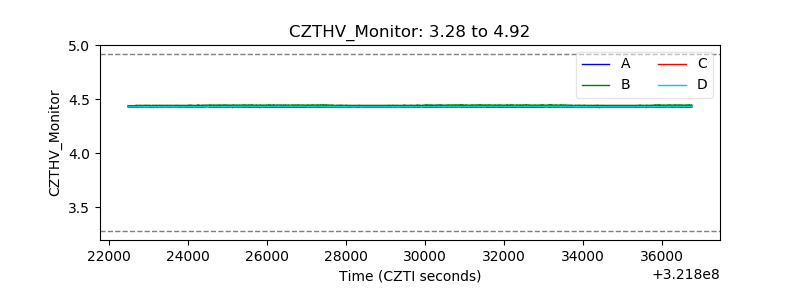 |
| D_VDD | 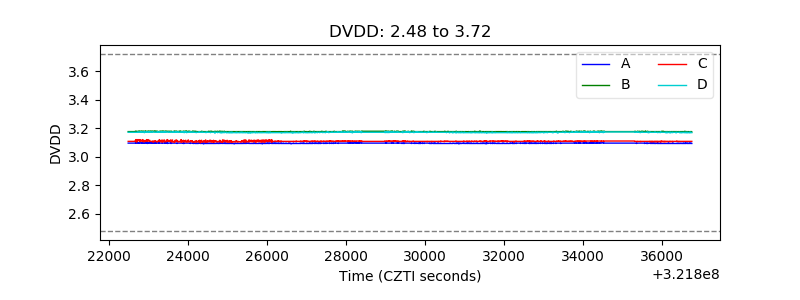 |
| Temperature 1 | 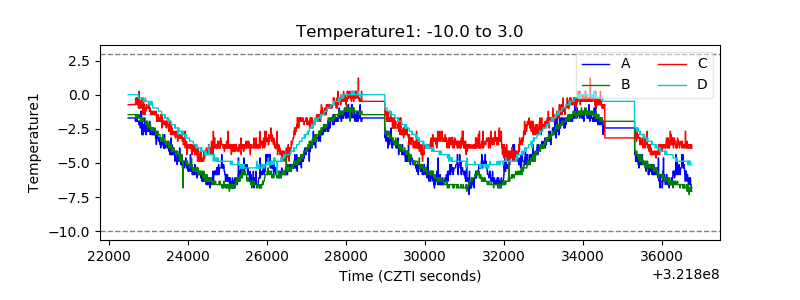 |
| Veto HV Monitor | 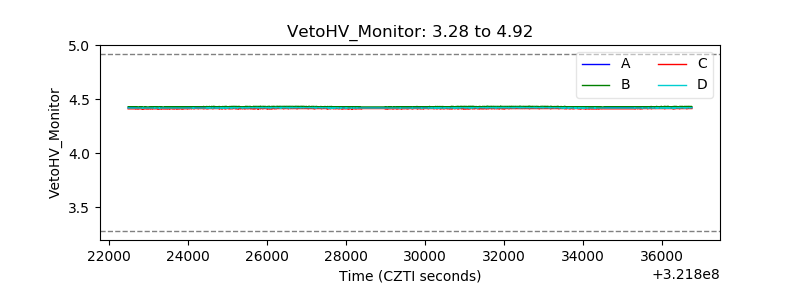 |
| Veto LLD | 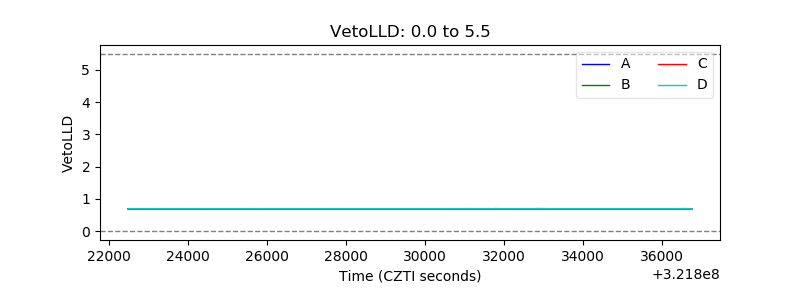 |
| Alpha Counter | 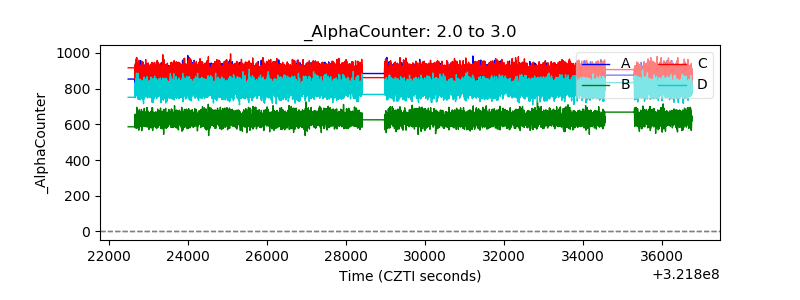 |
| _CPM_Rate |  |
| CZT Counter | 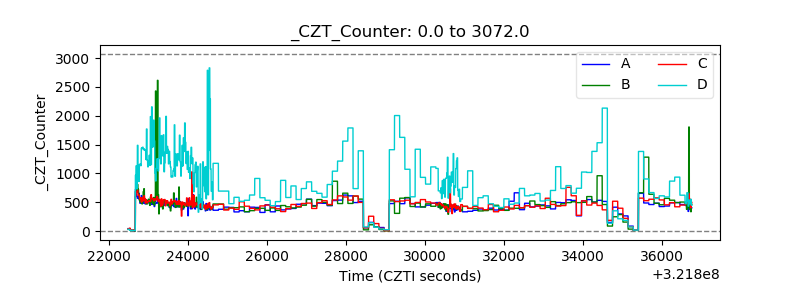 |
| +2.5 Volts monitor |  |
| +5 Volts monitor |  |
| _ROLL_ROT | 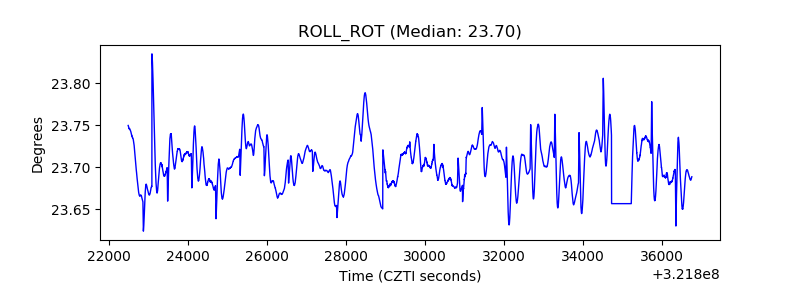 |
| _Roll_DEC | 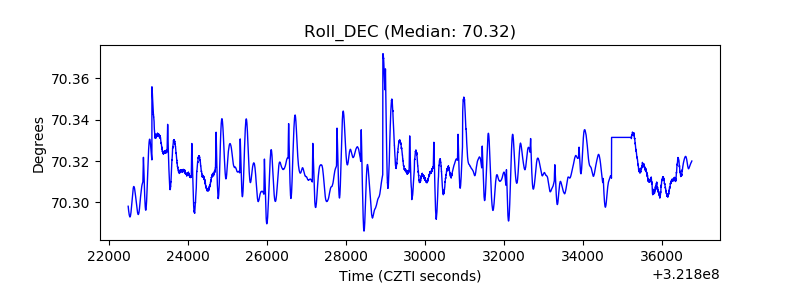 |
| _Roll_RA | 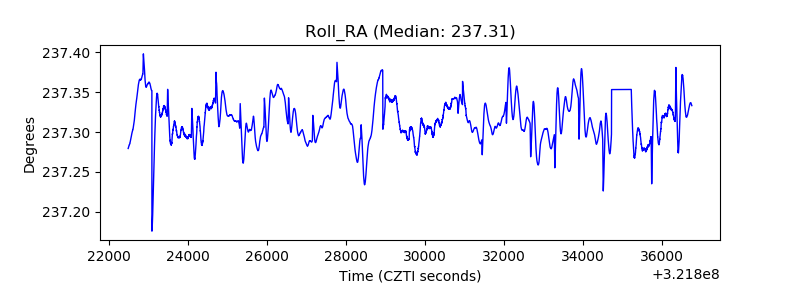 |
| Veto Counter | 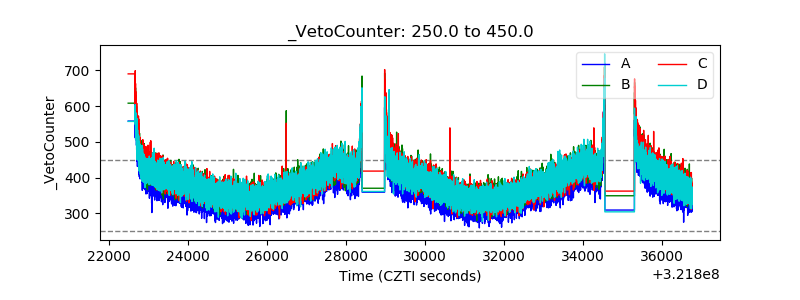 |