| Param | Original file | Final file |
|---|---|---|
| Filename | modeM0/AS1C05_012T04_9000003564_24109cztM0_level2.evt | modeM0/AS1C05_012T04_9000003564_24109cztM0_level2_quad_clean.evt |
| Size (bytes) | 544,124,160 | 125,524,800 |
| Size | 518.9 MB | 119.7 MB |
| Events in quadrant A | 3,084,498 | 858,187 |
| Events in quadrant B | 3,192,046 | 871,851 |
| Events in quadrant C | 3,234,552 | 843,200 |
| Events in quadrant D | 6,508,214 | 756,335 |
| Mode SS | |||
|---|---|---|---|
| Quadrant | BADHDUFLAG | Total packets | Discarded packets |
| A | 0 | 136 | 0 |
| B | 0 | 136 | 0 |
| C | 0 | 136 | 0 |
| D | 0 | 136 | 0 |
| Mode M0 | |||
|---|---|---|---|
| Quadrant | BADHDUFLAG | Total packets | Discarded packets |
| A | 0 | 13743 | 2 |
| B | 0 | 14005 | 2 |
| C | 0 | 14067 | 2 |
| D | 0 | 23985 | 2 |
| Mode M9 | |||
|---|---|---|---|
| Quadrant | BADHDUFLAG | Total packets | Discarded packets |
| A | 0 | 12 | 0 |
| B | 0 | 13 | 0 |
| C | 0 | 13 | 0 |
| D | 0 | 13 | 0 |
| Quadrant | Total seconds | Saturated seconds | Saturation percentage |
|---|---|---|---|
| A | 6778 | 14 | 0.206551% |
| B | 6778 | 28 | 0.413101% |
| C | 6778 | 68 | 1.003246% |
| D | 6778 | 864 | 12.747123% |
Noise dominated data is calculated using 1-second bins in cleaned event files. If a bin has >2000 counts, and if more than 50% of those come from <1% of pixels, then it is considered to be noise-dominated and hence unusable.
| Quadrant | # 1 sec bins | Bins with >0 counts | Bins with >2000 counts | High rate bins dominated by noise | Noise dominated (total time) | Noise dominated (detector-on time) | Marked lightcurve |
|---|---|---|---|---|---|---|---|
| A | 7698 | 6779 | 0 | 0 | 0.00% | 0.00% | 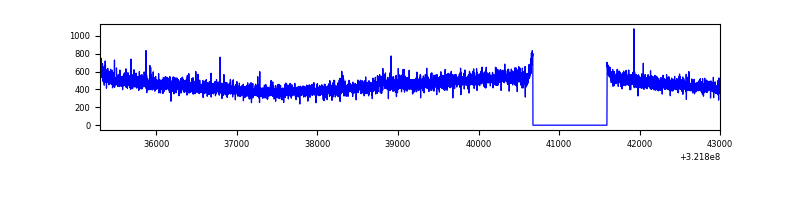 |
| B | 7698 | 6779 | 3 | 3 | 0.04% | 0.04% |  |
| C | 7698 | 6779 | 4 | 4 | 0.05% | 0.06% | 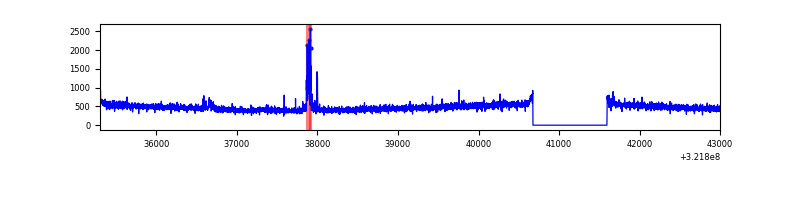 |
| D | 7698 | 6779 | 694 | 694 | 9.02% | 10.24% | 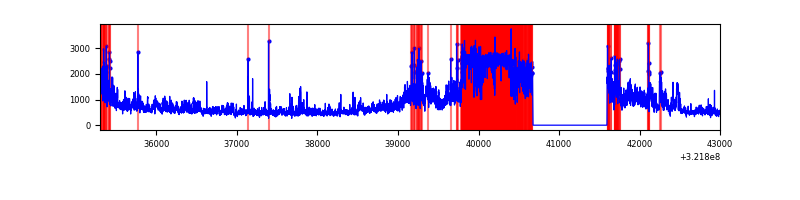 |
Top three noisy pixels from each quadrant. If the there are fewer than three noisy pixels in the level2.evt file, extra rows are filled as -1
| Pixel properties | Quadrant properties | ||||||
|---|---|---|---|---|---|---|---|
| Quadrant | DetID | PixID | Counts | Sigma | Mean | Median | Sigma |
| A | 2 | 250 | 17350 | 104.48 | 795 | 777 | 158.6 |
| A | 13 | 254 | 11743 | 69.13 | 795 | 777 | 158.6 |
| A | 3 | 137 | 7020 | 39.36 | 795 | 777 | 158.6 |
| B | 0 | 228 | 53438 | 348.29 | 795 | 776 | 151.2 |
| B | 12 | 111 | 18653 | 118.23 | 795 | 776 | 151.2 |
| B | 11 | 111 | 16029 | 100.88 | 795 | 776 | 151.2 |
| C | 14 | 238 | 123122 | 679.48 | 769 | 772 | 180.1 |
| C | 3 | 233 | 90422 | 497.87 | 769 | 772 | 180.1 |
| C | 7 | 247 | 20321 | 108.57 | 769 | 772 | 180.1 |
| D | 8 | 195 | 1978794 | 11227.54 | 718 | 696 | 176.2 |
| D | 12 | 233 | 1239551 | 7031.65 | 718 | 696 | 176.2 |
| D | 1 | 52 | 484307 | 2744.94 | 718 | 696 | 176.2 |
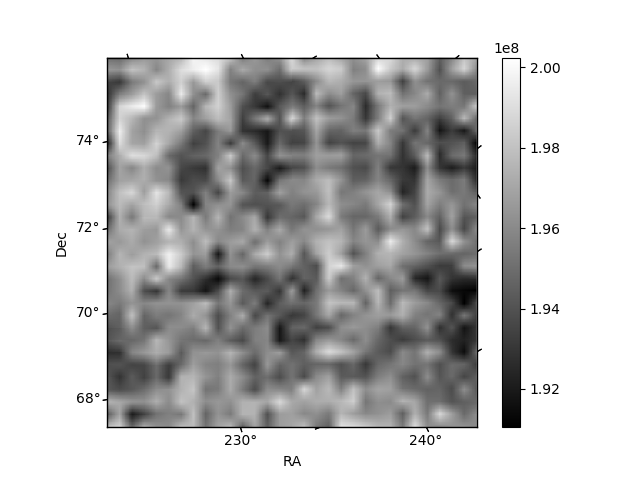
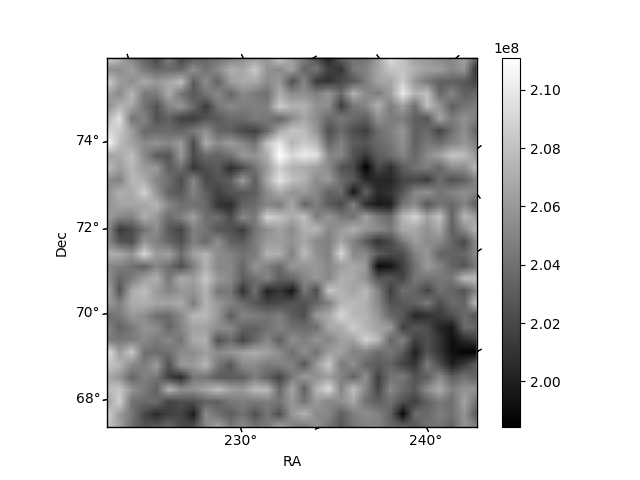
Histogram calculated using DETX and DETY for each event in the final _common_clean file
| Quadrant A | 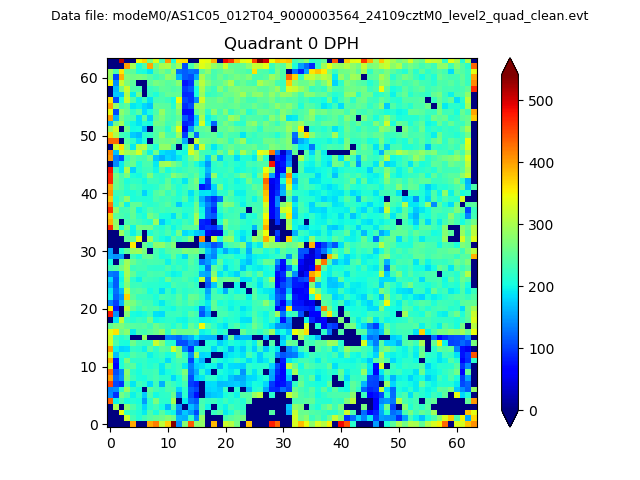 |
 |
Quadrant B |
|---|---|---|---|
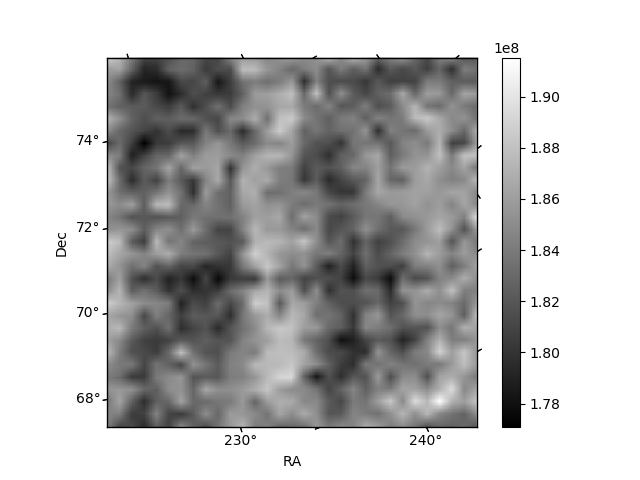
| Quadrant D |  |
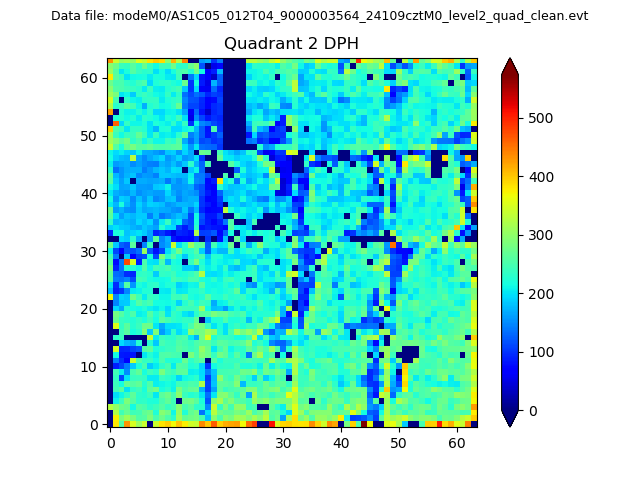 |
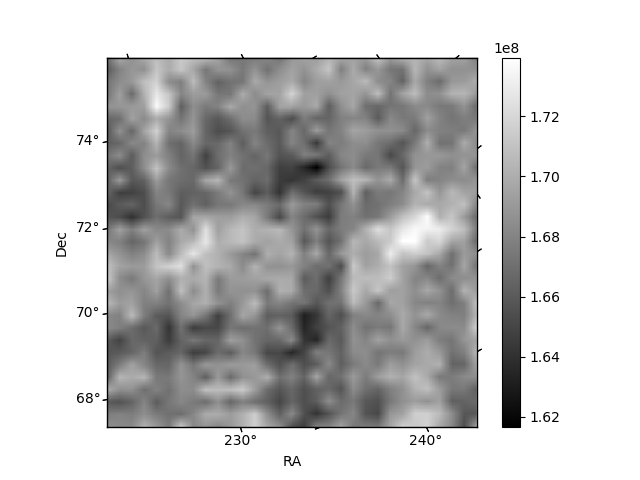
Quadrant C |
| Plot type | Count rate plots | Images |
|---|---|---|
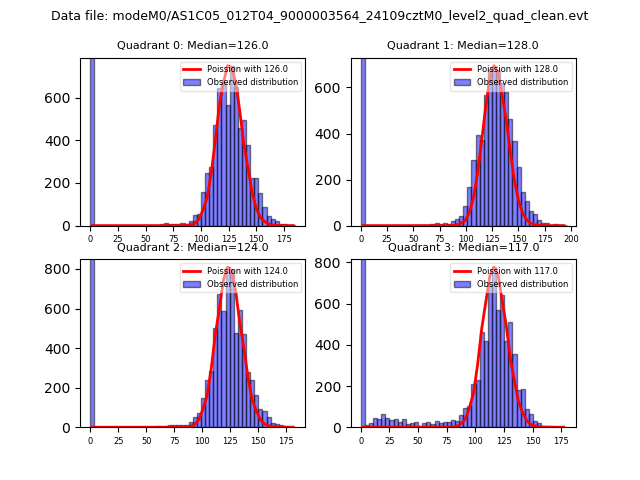
| Comparison with Poisson distribution Blue bars denote a histogram of data divided into 1 sec bins. Red curve is a Poisson curve with rate = median count rate of data. |
 |
 |
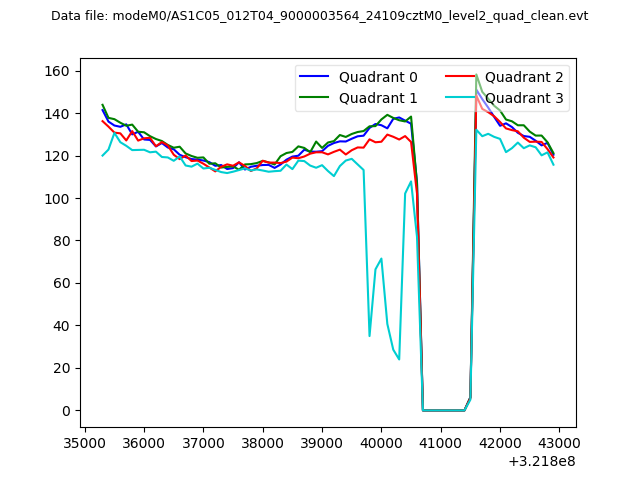
| Quadrant-wise count rates Data is divided into 100 sec bins |
 |
|
| Module-wise count rates for Quadrant A Data is divided into 100 sec bins |
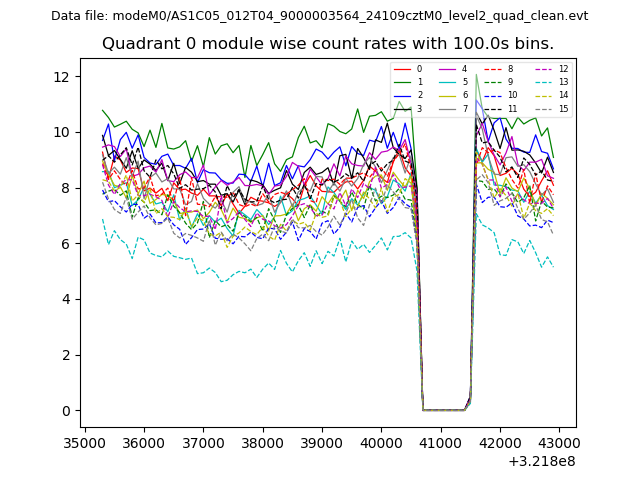 |
 |
| Module-wise count rates for Quadrant B Data is divided into 100 sec bins |
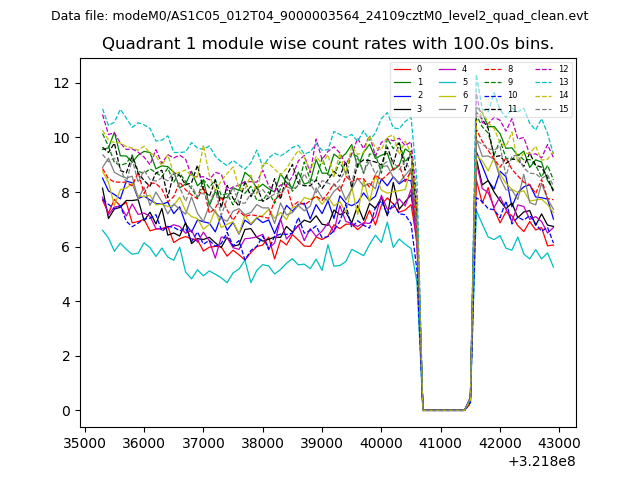 |
 |
| Module-wise count rates for Quadrant C Data is divided into 100 sec bins |
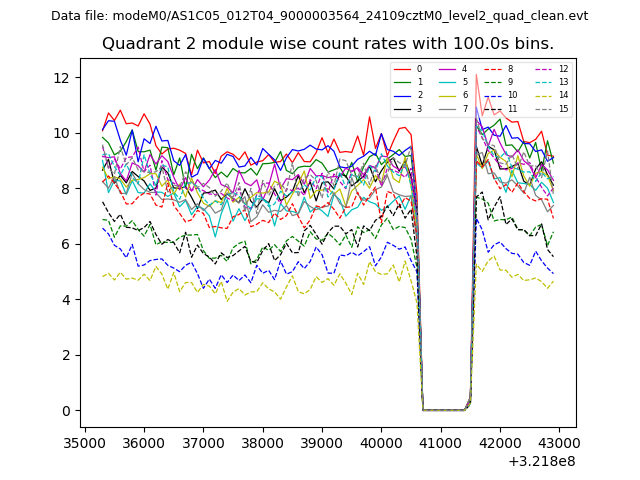 |
 |
| Module-wise count rates for Quadrant D Data is divided into 100 sec bins |
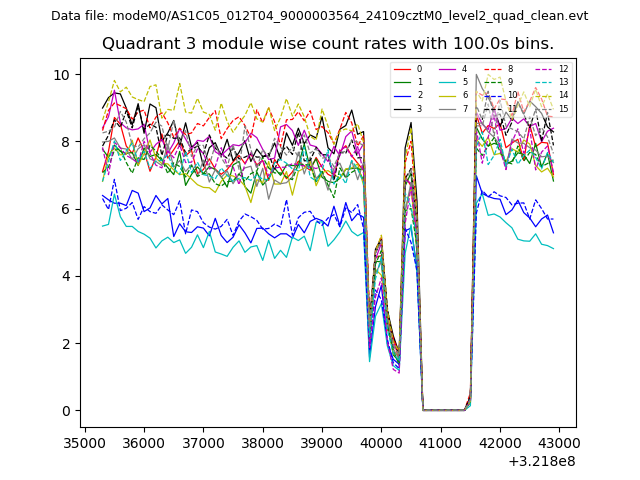 |
 |
| Parameter | Plot |
|---|---|
| CZT HV Monitor | 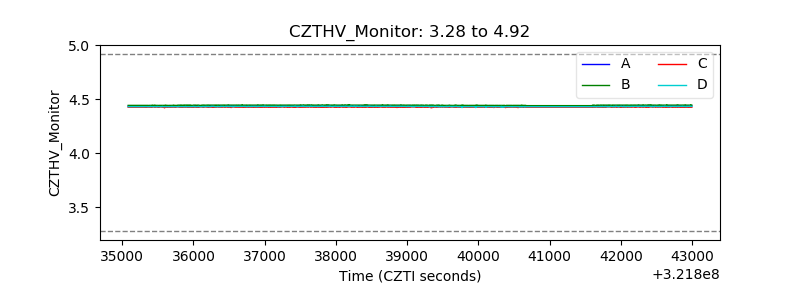 |
| D_VDD | 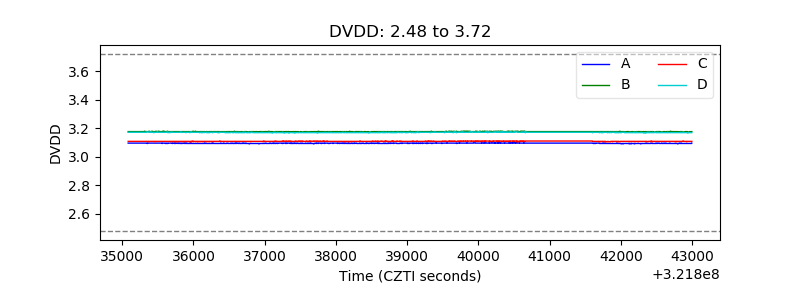 |
| Temperature 1 | 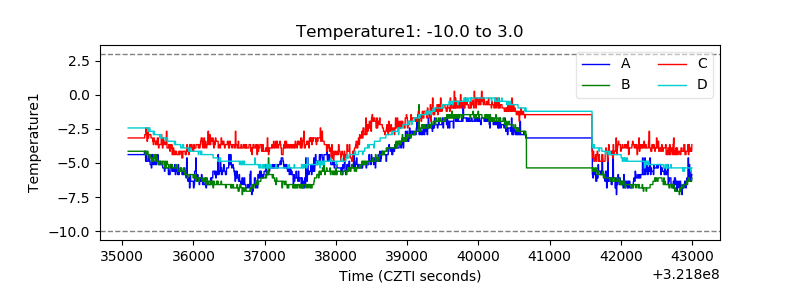 |
| Veto HV Monitor | 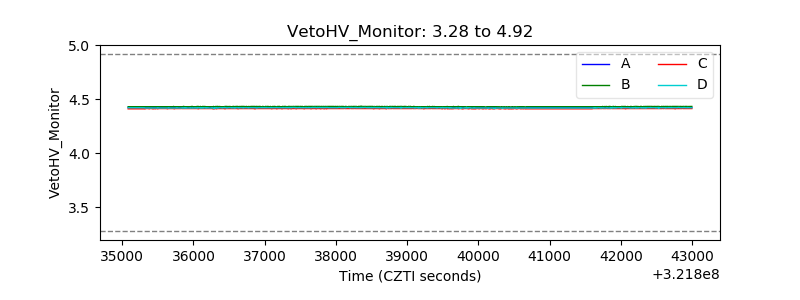 |
| Veto LLD | 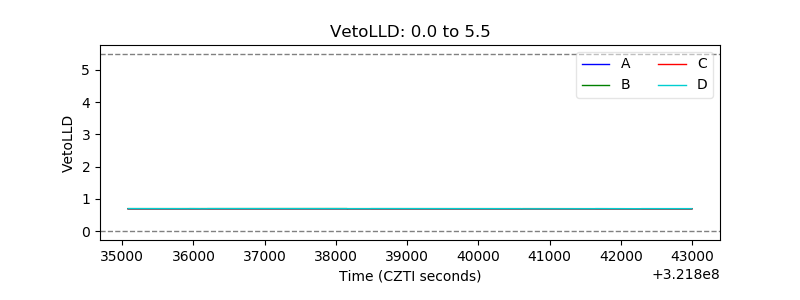 |
| Alpha Counter | 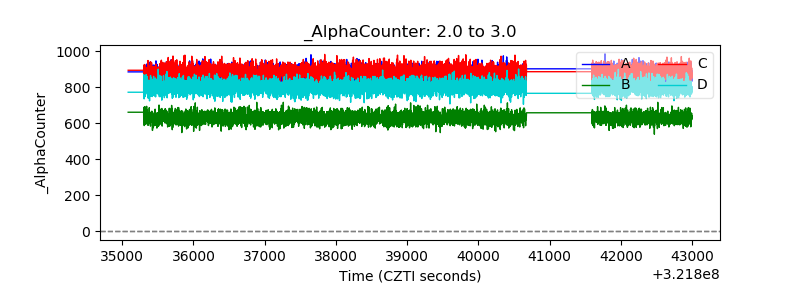 |
| _CPM_Rate | 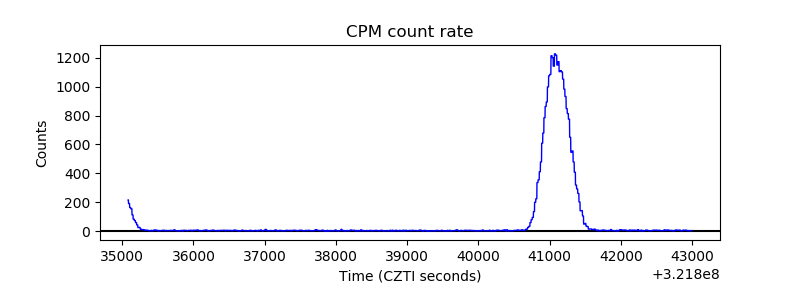 |
| CZT Counter | 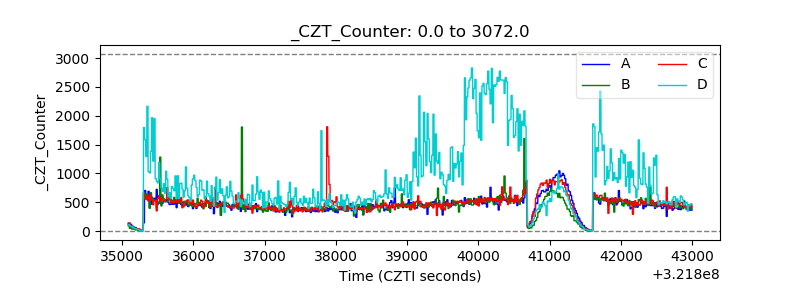 |
| +2.5 Volts monitor |  |
| +5 Volts monitor |  |
| _ROLL_ROT | 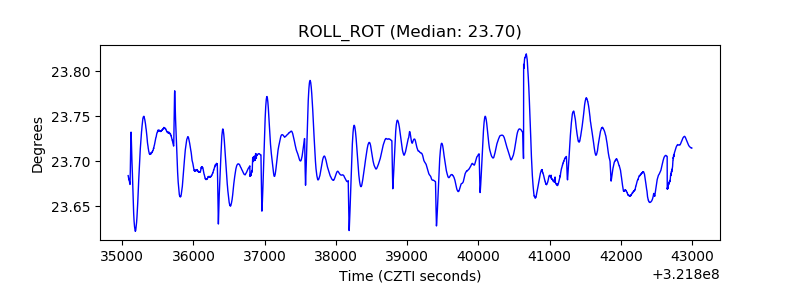 |
| _Roll_DEC | 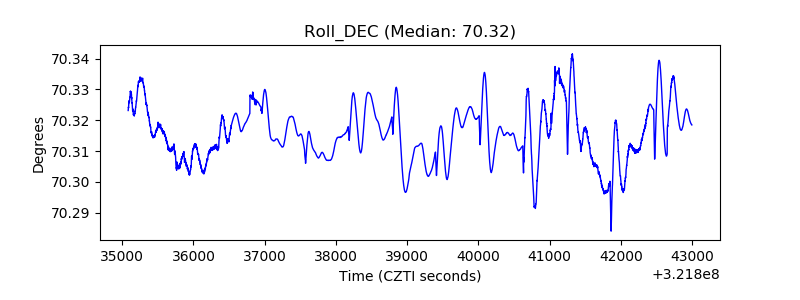 |
| _Roll_RA | 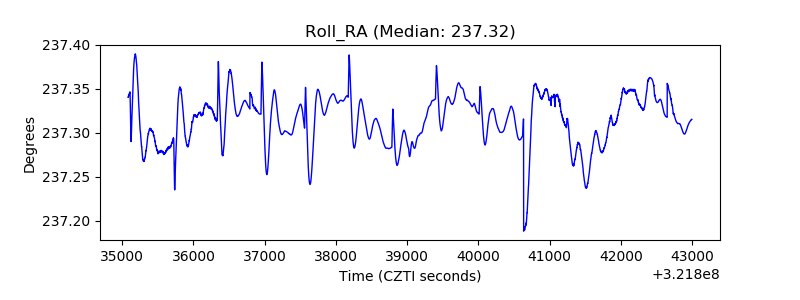 |
| Veto Counter | 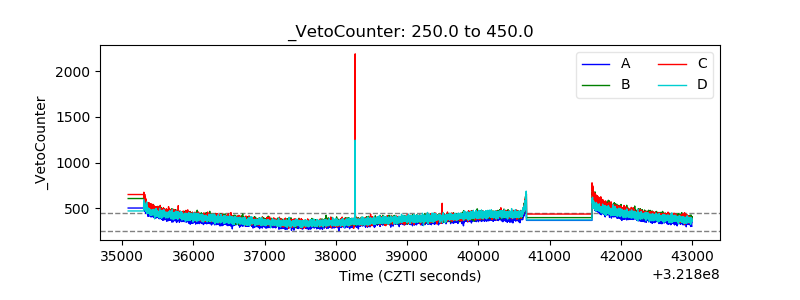 |