| Param | Original file | Final file |
|---|---|---|
| Filename | modeM0/AS1C05_012T04_9000003564_24110cztM0_level2.evt | modeM0/AS1C05_012T04_9000003564_24110cztM0_level2_quad_clean.evt |
| Size (bytes) | 550,607,040 | 129,214,080 |
| Size | 525.1 MB | 123.2 MB |
| Events in quadrant A | 3,257,141 | 885,198 |
| Events in quadrant B | 3,244,010 | 905,975 |
| Events in quadrant C | 3,188,650 | 870,138 |
| Events in quadrant D | 6,525,290 | 779,368 |
| Mode SS | |||
|---|---|---|---|
| Quadrant | BADHDUFLAG | Total packets | Discarded packets |
| A | 0 | 138 | 0 |
| B | 0 | 138 | 0 |
| C | 0 | 138 | 0 |
| D | 0 | 138 | 0 |
| Mode M0 | |||
|---|---|---|---|
| Quadrant | BADHDUFLAG | Total packets | Discarded packets |
| A | 0 | 14315 | 2 |
| B | 0 | 14108 | 2 |
| C | 0 | 13995 | 2 |
| D | 0 | 23996 | 2 |
| Mode M9 | |||
|---|---|---|---|
| Quadrant | BADHDUFLAG | Total packets | Discarded packets |
| A | 0 | 20 | 0 |
| B | 0 | 20 | 0 |
| C | 0 | 20 | 0 |
| D | 0 | 20 | 0 |
| Quadrant | Total seconds | Saturated seconds | Saturation percentage |
|---|---|---|---|
| A | 6786 | 17 | 0.250516% |
| B | 6787 | 52 | 0.766171% |
| C | 6787 | 72 | 1.060852% |
| D | 6787 | 1068 | 15.735966% |
Noise dominated data is calculated using 1-second bins in cleaned event files. If a bin has >2000 counts, and if more than 50% of those come from <1% of pixels, then it is considered to be noise-dominated and hence unusable.
| Quadrant | # 1 sec bins | Bins with >0 counts | Bins with >2000 counts | High rate bins dominated by noise | Noise dominated (total time) | Noise dominated (detector-on time) | Marked lightcurve |
|---|---|---|---|---|---|---|---|
| A | 8736 | 6788 | 0 | 0 | 0.00% | 0.00% | 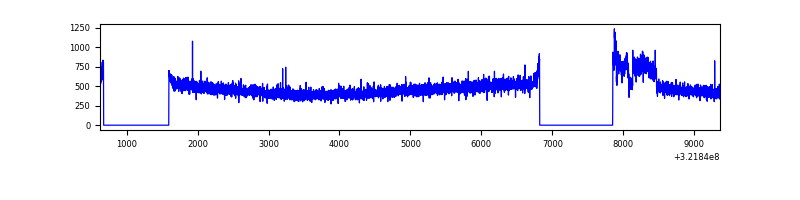 |
| B | 8737 | 6789 | 1 | 1 | 0.01% | 0.01% |  |
| C | 8737 | 6789 | 0 | 0 | 0.00% | 0.00% | 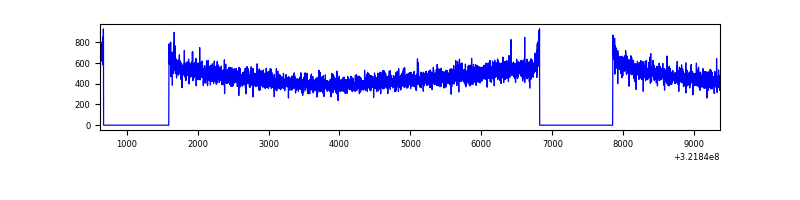 |
| D | 8737 | 6789 | 933 | 933 | 10.68% | 13.74% | 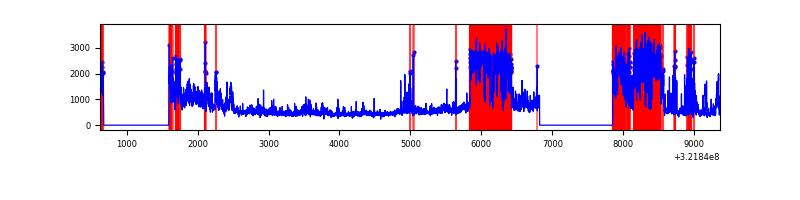 |
Top three noisy pixels from each quadrant. If the there are fewer than three noisy pixels in the level2.evt file, extra rows are filled as -1
| Pixel properties | Quadrant properties | ||||||
|---|---|---|---|---|---|---|---|
| Quadrant | DetID | PixID | Counts | Sigma | Mean | Median | Sigma |
| A | 0 | 23 | 115651 | 713.23 | 809 | 792 | 161.0 |
| A | 2 | 250 | 16162 | 95.44 | 809 | 792 | 161.0 |
| A | 0 | 226 | 13406 | 78.33 | 809 | 792 | 161.0 |
| B | 0 | 228 | 44044 | 283.68 | 811 | 791 | 152.5 |
| B | 12 | 111 | 18535 | 116.38 | 811 | 791 | 152.5 |
| B | 11 | 111 | 16332 | 101.93 | 811 | 791 | 152.5 |
| C | 14 | 238 | 125533 | 690.63 | 779 | 784 | 180.6 |
| C | 7 | 247 | 18933 | 100.48 | 779 | 784 | 180.6 |
| C | 3 | 233 | 5403 | 25.57 | 779 | 784 | 180.6 |
| D | 1 | 52 | 2630660 | 14714.59 | 735 | 712 | 178.7 |
| D | 8 | 195 | 973293 | 5441.6 | 735 | 712 | 178.7 |
| D | 12 | 233 | 60425 | 334.09 | 735 | 712 | 178.7 |
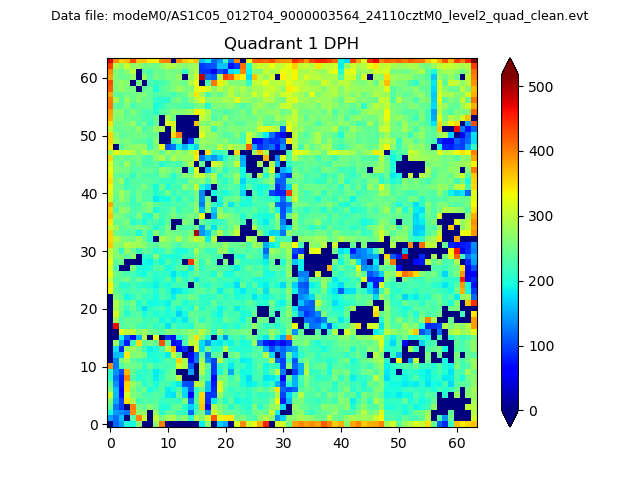
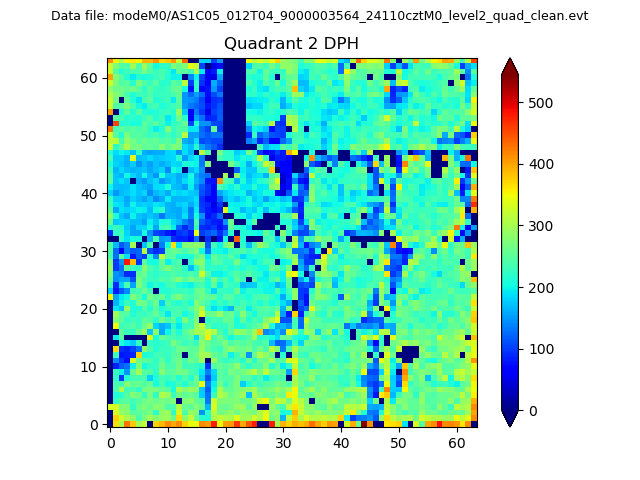
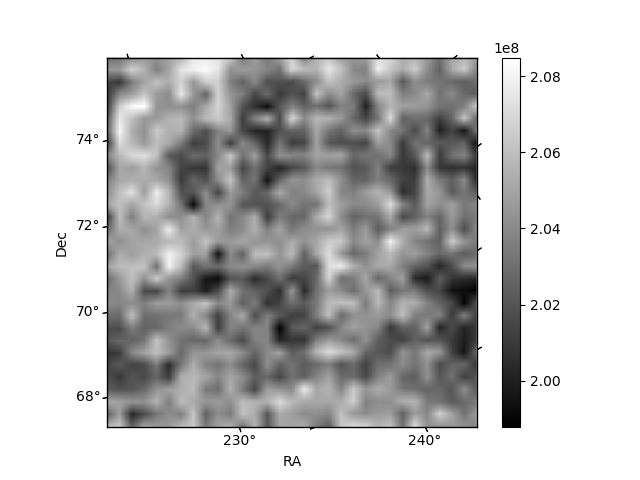
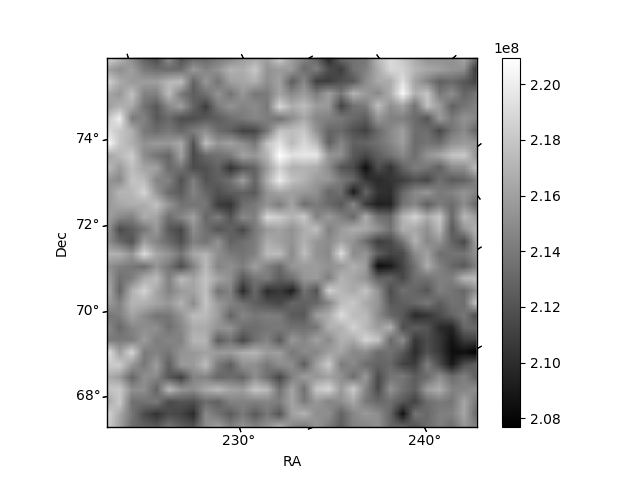
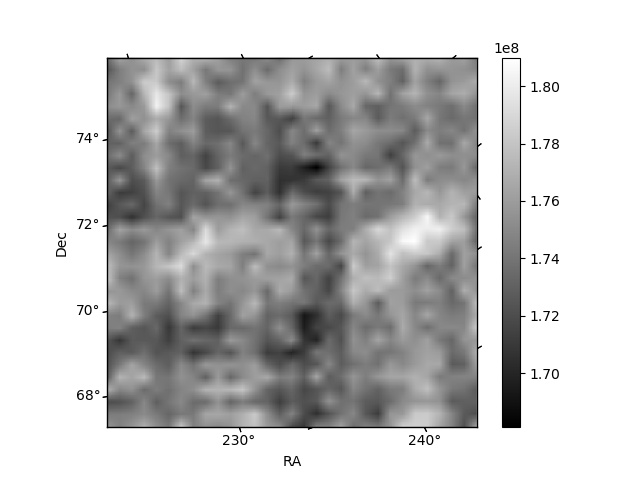
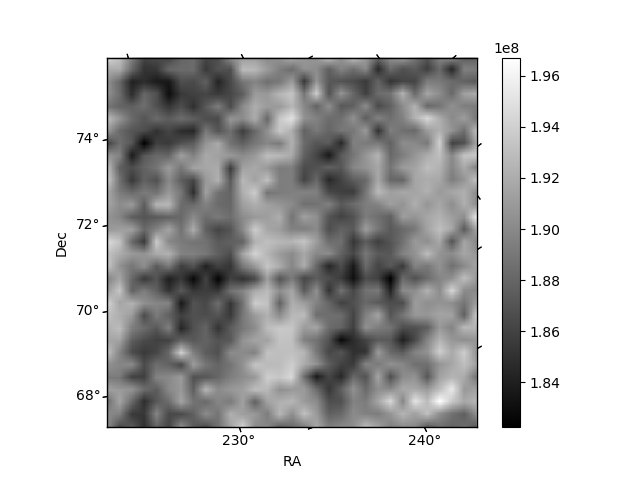
Histogram calculated using DETX and DETY for each event in the final _common_clean file
| Quadrant A | 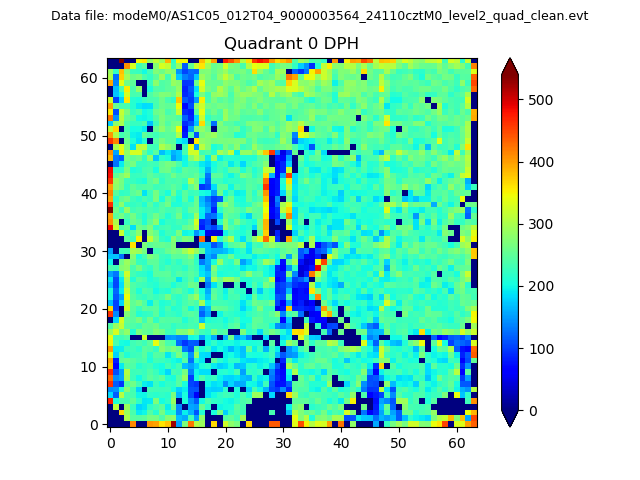 |
 |
Quadrant B |
|---|---|---|---|
| Quadrant D |  |
 |
Quadrant C |
| Plot type | Count rate plots | Images |
|---|---|---|
| Comparison with Poisson distribution Blue bars denote a histogram of data divided into 1 sec bins. Red curve is a Poisson curve with rate = median count rate of data. |
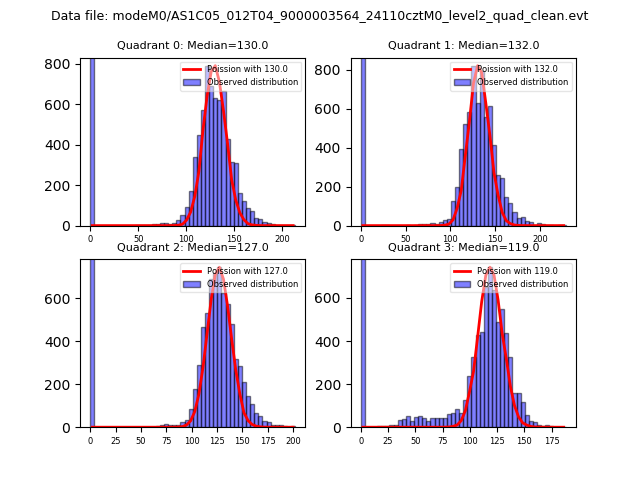 |
 |
| Quadrant-wise count rates Data is divided into 100 sec bins |
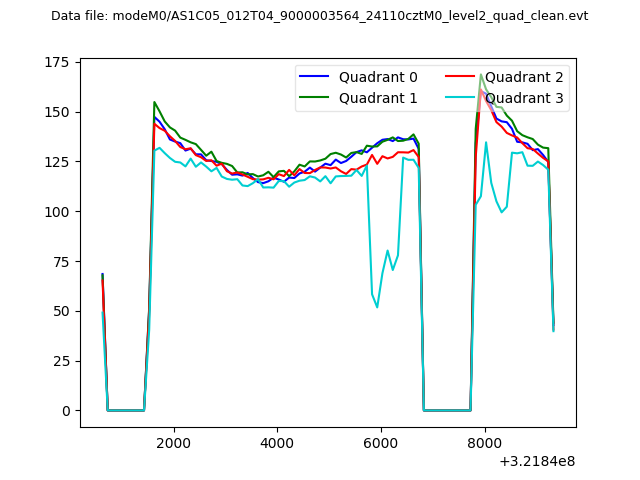 |
|
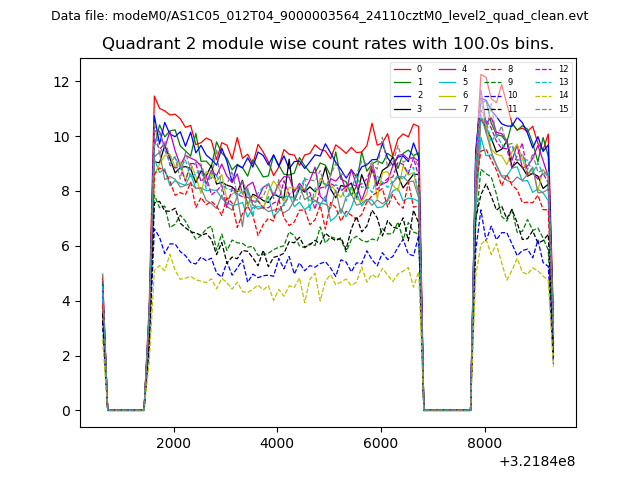
| Module-wise count rates for Quadrant A Data is divided into 100 sec bins |
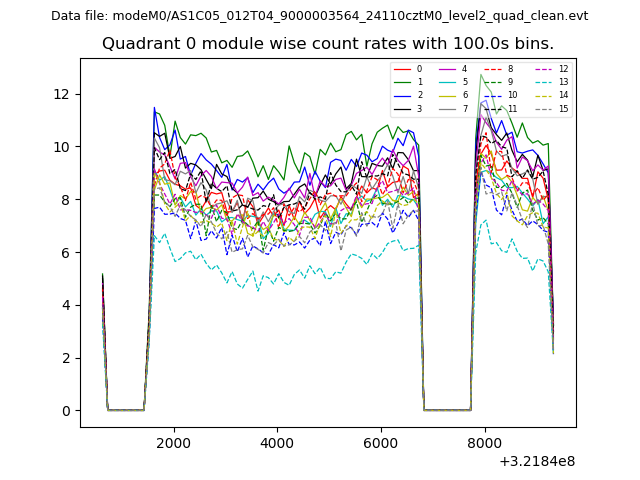 |
 |
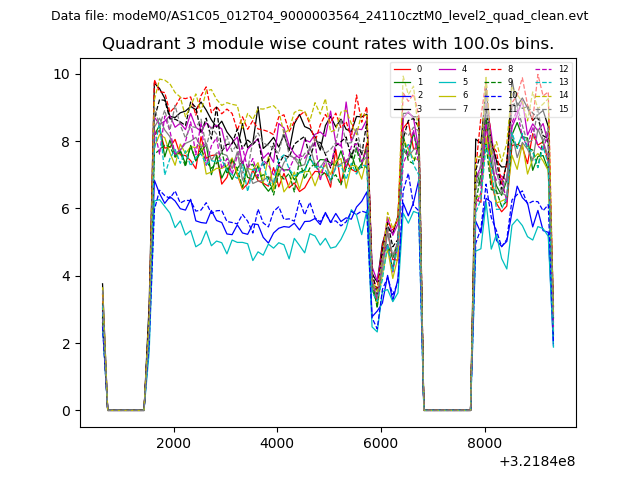
| Module-wise count rates for Quadrant B Data is divided into 100 sec bins |
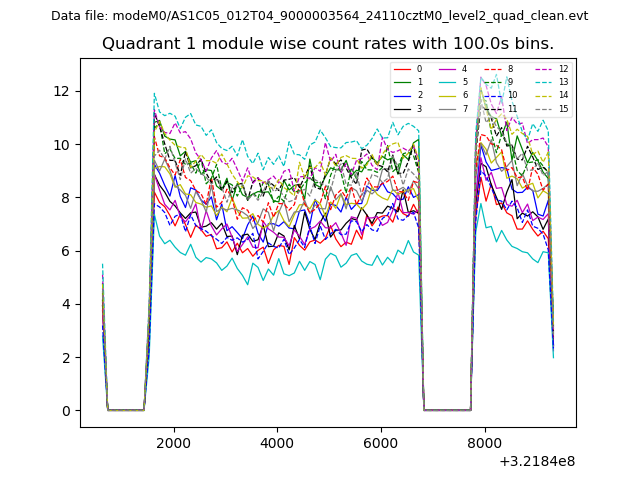 |
 |
| Module-wise count rates for Quadrant C Data is divided into 100 sec bins |
 |
 |
| Module-wise count rates for Quadrant D Data is divided into 100 sec bins |
 |
 |
| Parameter | Plot |
|---|---|
| CZT HV Monitor | 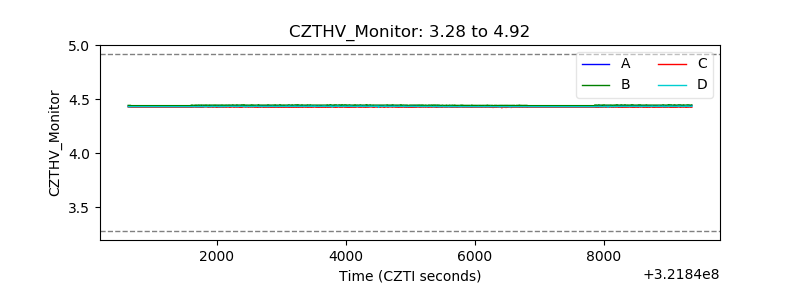 |
| D_VDD | 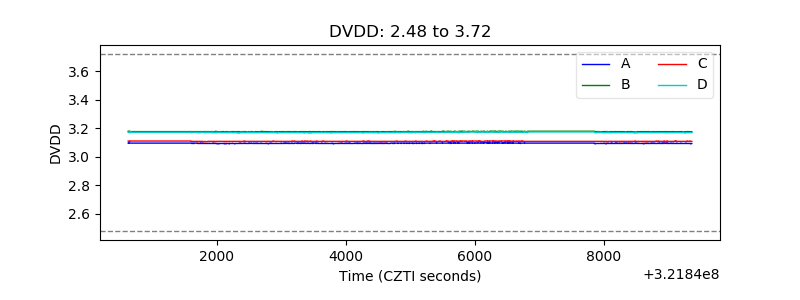 |
| Temperature 1 | 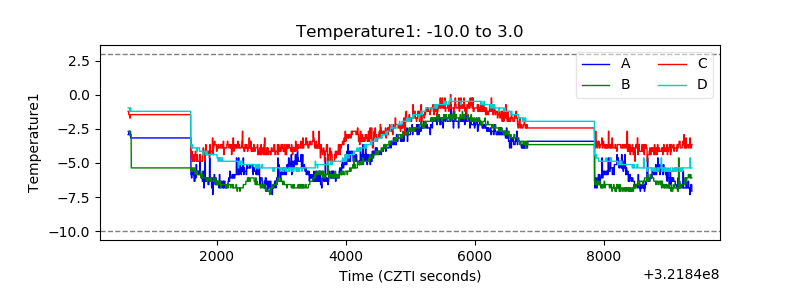 |
| Veto HV Monitor | 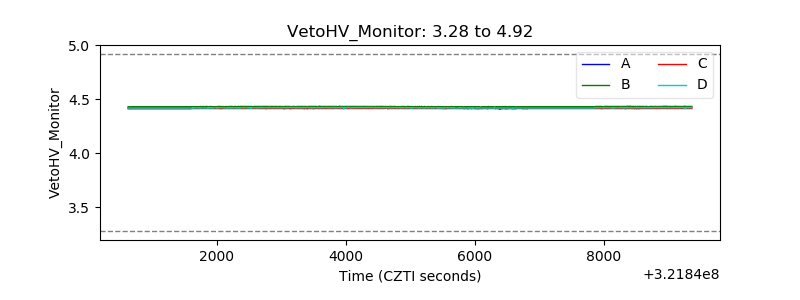 |
| Veto LLD | 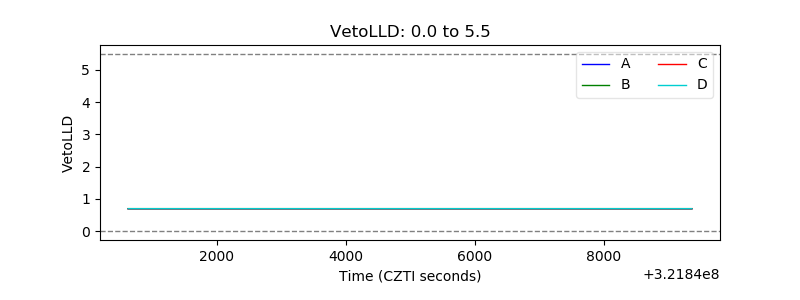 |
| Alpha Counter | 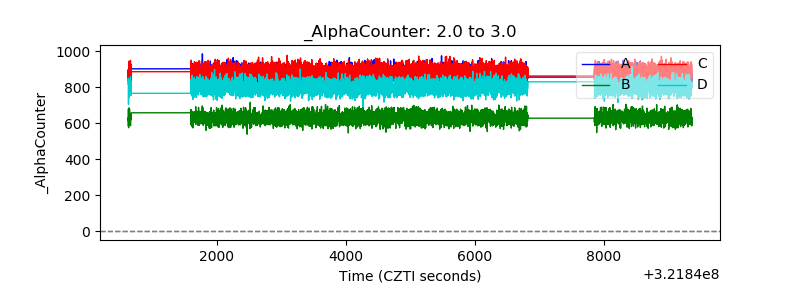 |
| _CPM_Rate | 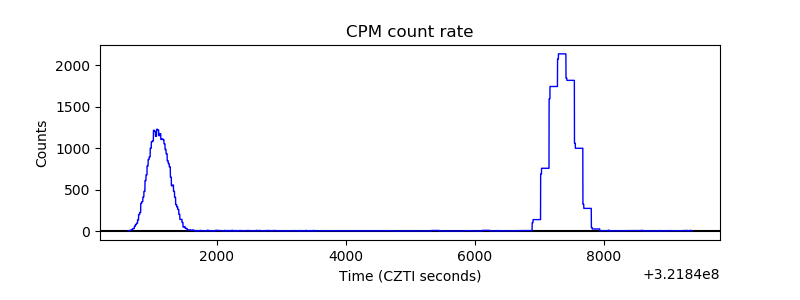 |
| CZT Counter | 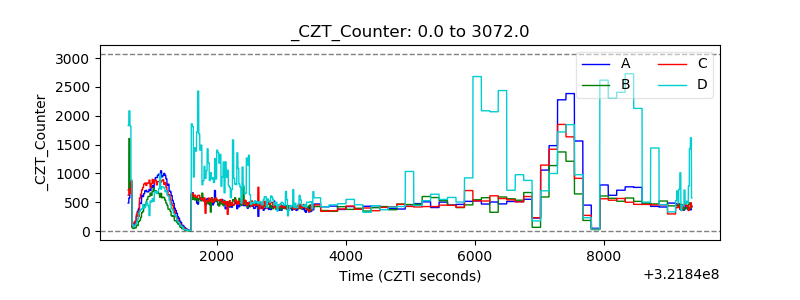 |
| +2.5 Volts monitor |  |
| +5 Volts monitor | 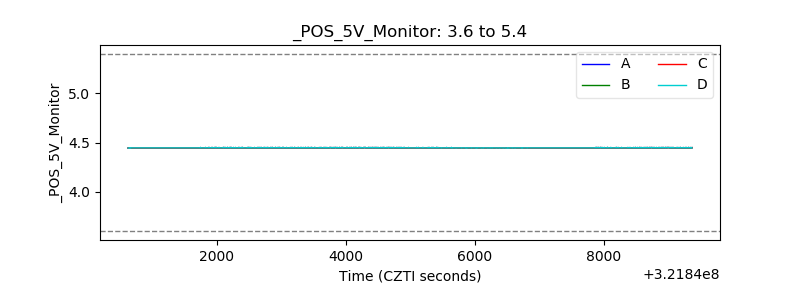 |
| _ROLL_ROT | 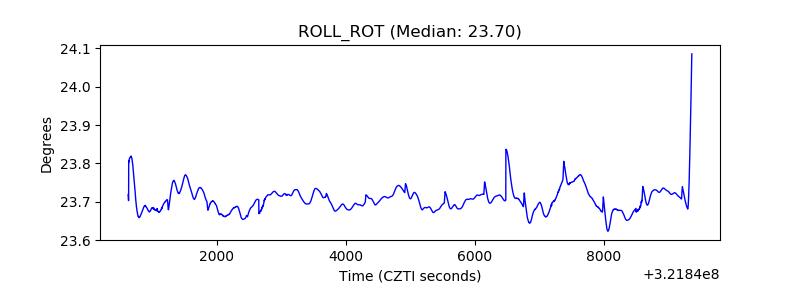 |
| _Roll_DEC | 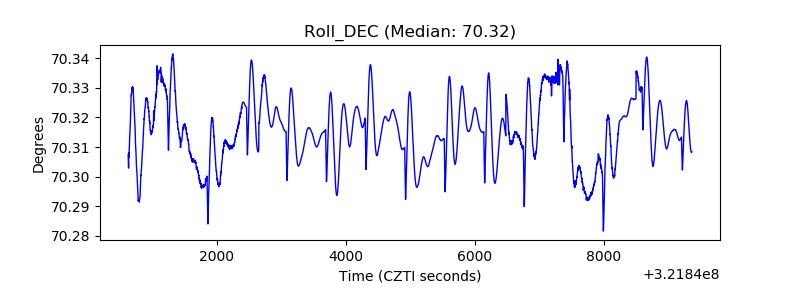 |
| _Roll_RA | 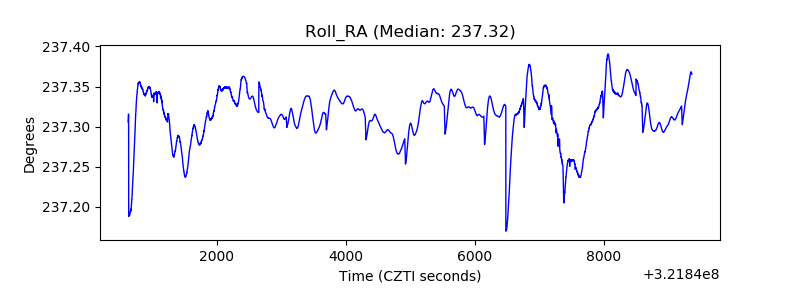 |
| Veto Counter | 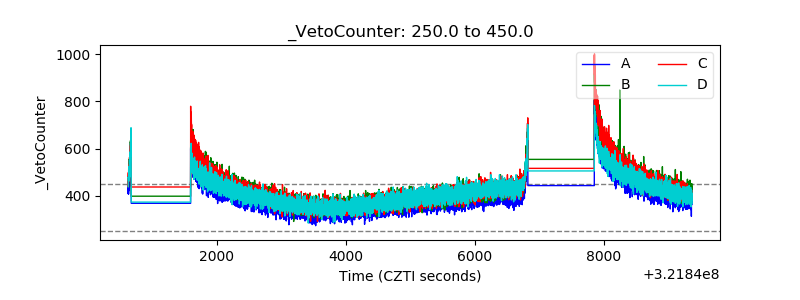 |