| Param | Original file | Final file |
|---|---|---|
| Filename | modeM0/AS1C05_012T04_9000003564_24112cztM0_level2.evt | modeM0/AS1C05_012T04_9000003564_24112cztM0_level2_quad_clean.evt |
| Size (bytes) | 614,986,560 | 128,946,240 |
| Size | 586.5 MB | 123.0 MB |
| Events in quadrant A | 3,217,905 | 904,204 |
| Events in quadrant B | 3,205,059 | 922,323 |
| Events in quadrant C | 3,123,052 | 878,142 |
| Events in quadrant D | 8,635,452 | 743,699 |
| Mode SS | |||
|---|---|---|---|
| Quadrant | BADHDUFLAG | Total packets | Discarded packets |
| A | 0 | 132 | 0 |
| B | 0 | 132 | 0 |
| C | 0 | 132 | 0 |
| D | 0 | 132 | 0 |
| Mode M0 | |||
|---|---|---|---|
| Quadrant | BADHDUFLAG | Total packets | Discarded packets |
| A | 0 | 13909 | 2 |
| B | 0 | 13753 | 2 |
| C | 0 | 13528 | 2 |
| D | 0 | 30163 | 2 |
| Mode M9 | |||
|---|---|---|---|
| Quadrant | BADHDUFLAG | Total packets | Discarded packets |
| A | 0 | 13 | 0 |
| B | 0 | 14 | 0 |
| C | 0 | 14 | 0 |
| D | 0 | 14 | 0 |
| Quadrant | Total seconds | Saturated seconds | Saturation percentage |
|---|---|---|---|
| A | 6547 | 11 | 0.168016% |
| B | 6547 | 30 | 0.458225% |
| C | 6547 | 48 | 0.733160% |
| D | 6546 | 1915 | 29.254507% |
Noise dominated data is calculated using 1-second bins in cleaned event files. If a bin has >2000 counts, and if more than 50% of those come from <1% of pixels, then it is considered to be noise-dominated and hence unusable.
| Quadrant | # 1 sec bins | Bins with >0 counts | Bins with >2000 counts | High rate bins dominated by noise | Noise dominated (total time) | Noise dominated (detector-on time) | Marked lightcurve |
|---|---|---|---|---|---|---|---|
| A | 7727 | 6548 | 0 | 0 | 0.00% | 0.00% | 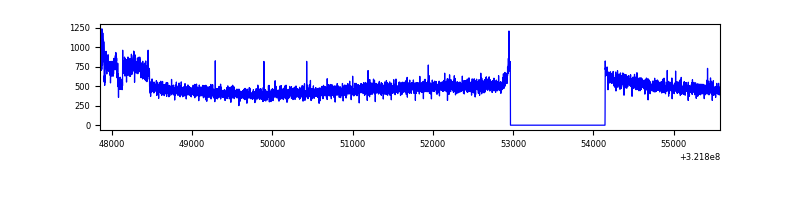 |
| B | 7727 | 6548 | 3 | 3 | 0.04% | 0.05% | 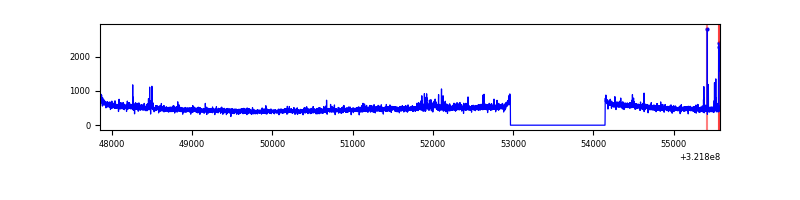 |
| C | 7727 | 6547 | 0 | 0 | 0.00% | 0.00% | 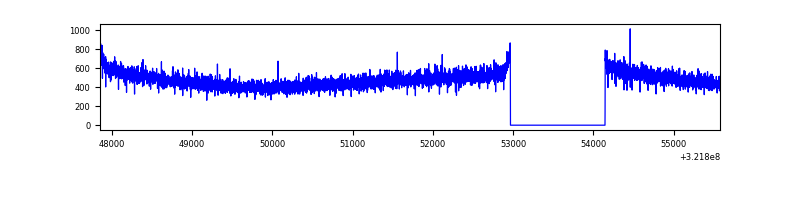 |
| D | 7726 | 6546 | 1768 | 1768 | 22.88% | 27.01% | 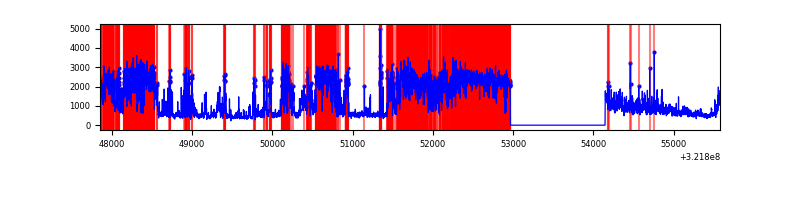 |
Top three noisy pixels from each quadrant. If the there are fewer than three noisy pixels in the level2.evt file, extra rows are filled as -1
| Pixel properties | Quadrant properties | ||||||
|---|---|---|---|---|---|---|---|
| Quadrant | DetID | PixID | Counts | Sigma | Mean | Median | Sigma |
| A | 0 | 23 | 115876 | 720.06 | 802 | 788 | 159.8 |
| A | 0 | 226 | 13310 | 78.35 | 802 | 788 | 159.8 |
| A | 13 | 254 | 10525 | 60.92 | 802 | 788 | 159.8 |
| B | 0 | 228 | 32898 | 216.31 | 800 | 782 | 148.5 |
| B | 15 | 32 | 26717 | 174.68 | 800 | 782 | 148.5 |
| B | 12 | 111 | 17914 | 115.39 | 800 | 782 | 148.5 |
| C | 14 | 238 | 124490 | 699.94 | 764 | 768 | 176.8 |
| C | 7 | 247 | 13103 | 69.78 | 764 | 768 | 176.8 |
| C | 10 | 91 | 6877 | 34.56 | 764 | 768 | 176.8 |
| D | 1 | 52 | 5243561 | 31472.21 | 692 | 672 | 166.6 |
| D | 8 | 195 | 669982 | 4017.76 | 692 | 672 | 166.6 |
| D | 12 | 233 | 50188 | 297.24 | 692 | 672 | 166.6 |
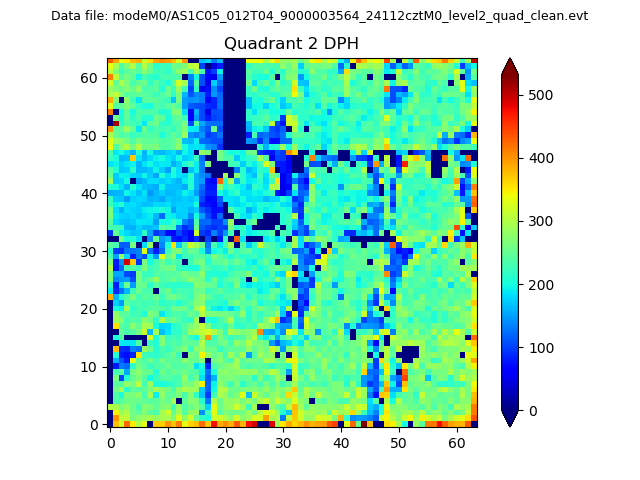
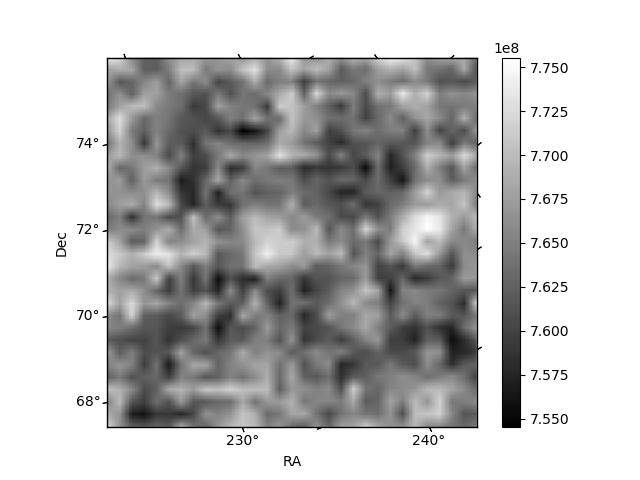
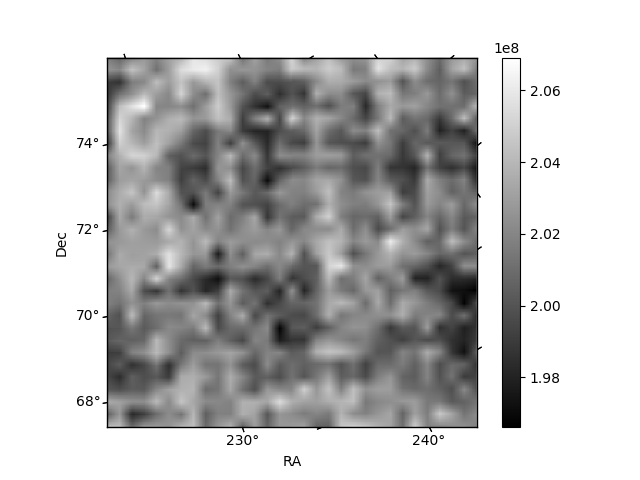
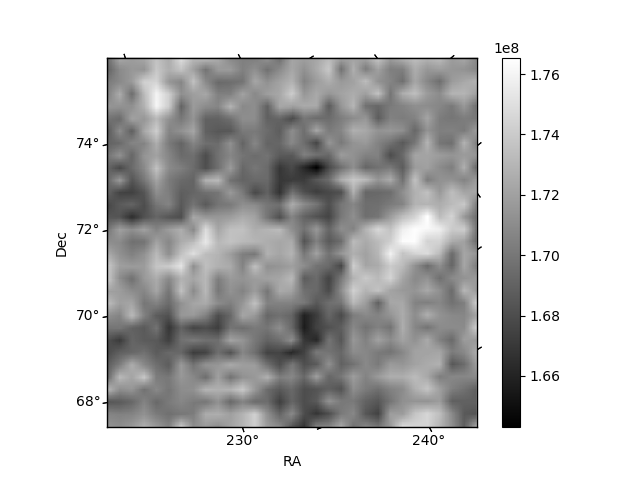
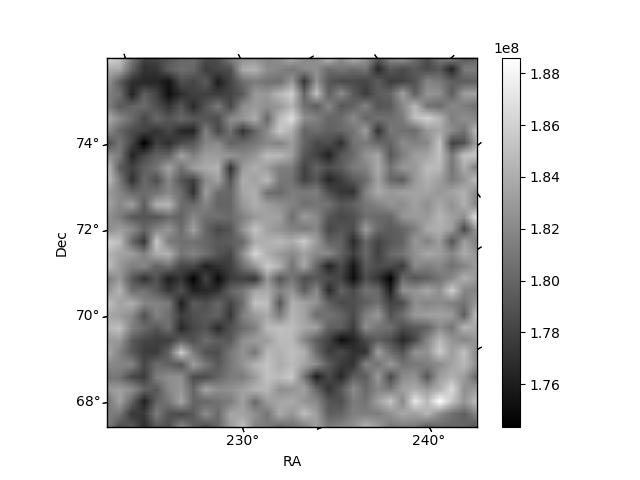
Histogram calculated using DETX and DETY for each event in the final _common_clean file
| Quadrant A | 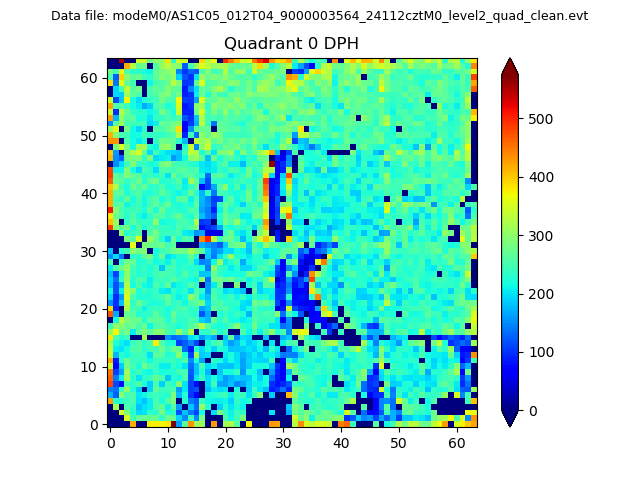 |
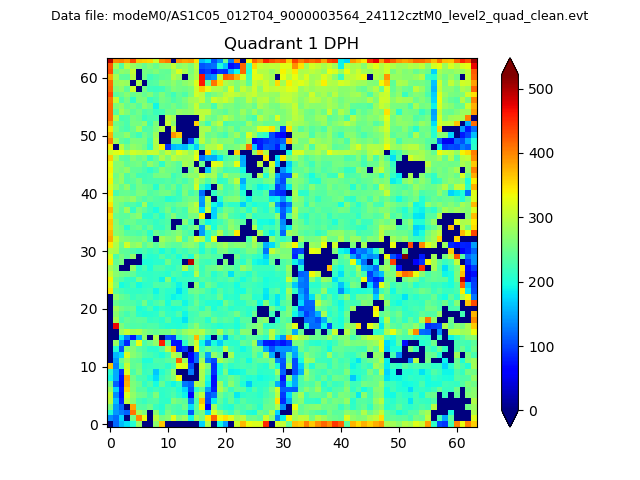 |
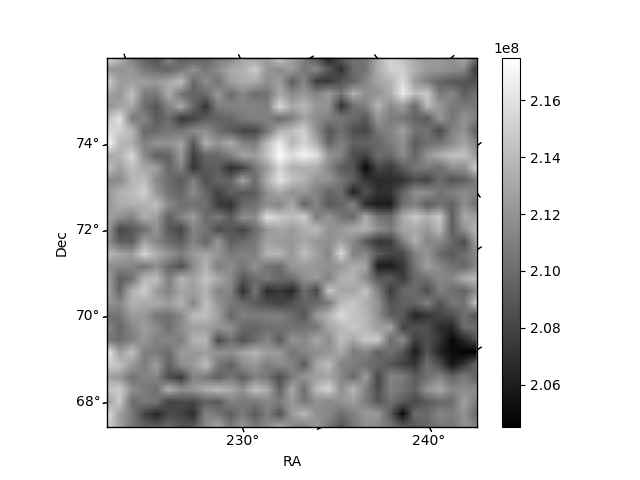
Quadrant B |
|---|---|---|---|
| Quadrant D | 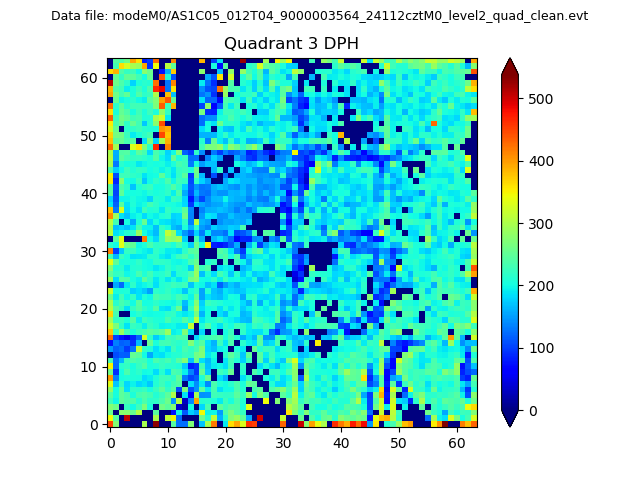 |
 |
Quadrant C |
| Plot type | Count rate plots | Images |
|---|---|---|
| Comparison with Poisson distribution Blue bars denote a histogram of data divided into 1 sec bins. Red curve is a Poisson curve with rate = median count rate of data. |
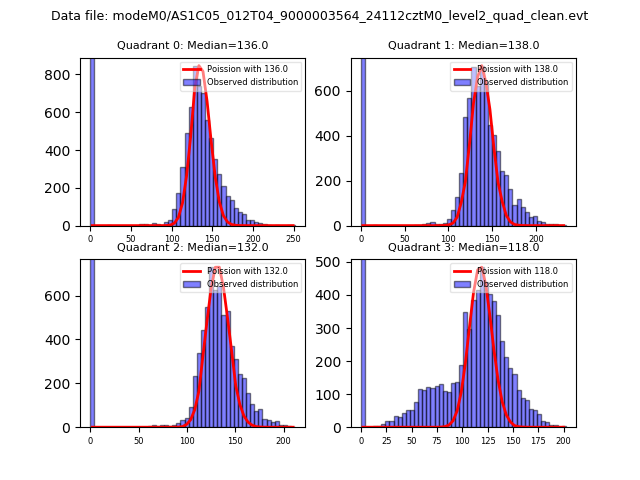 |
 |
| Quadrant-wise count rates Data is divided into 100 sec bins |
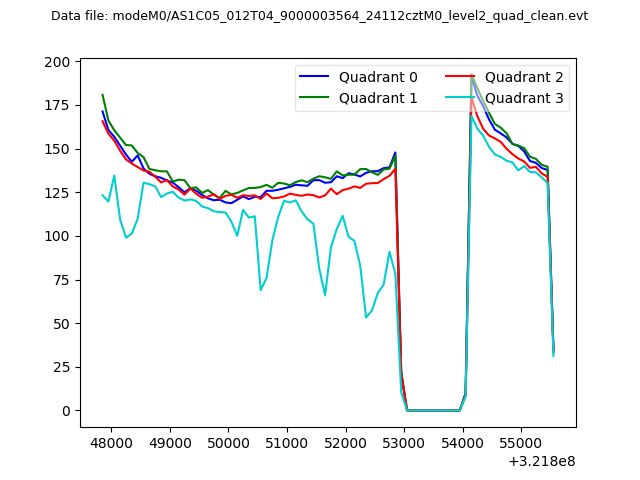 |
|
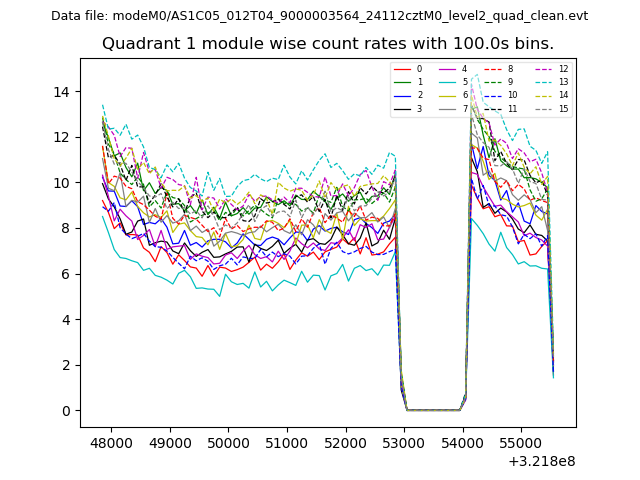
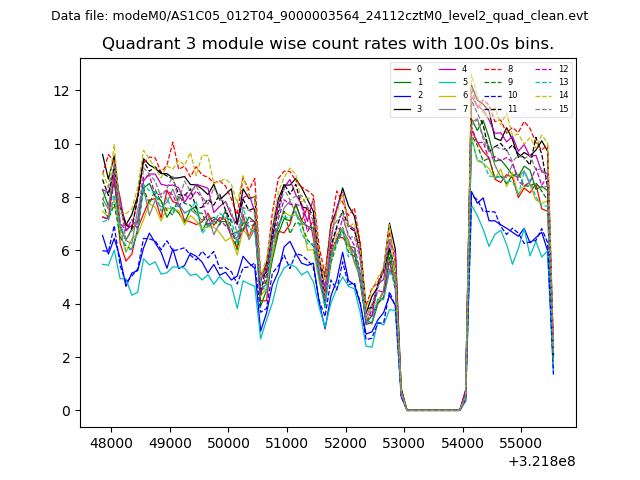
| Module-wise count rates for Quadrant A Data is divided into 100 sec bins |
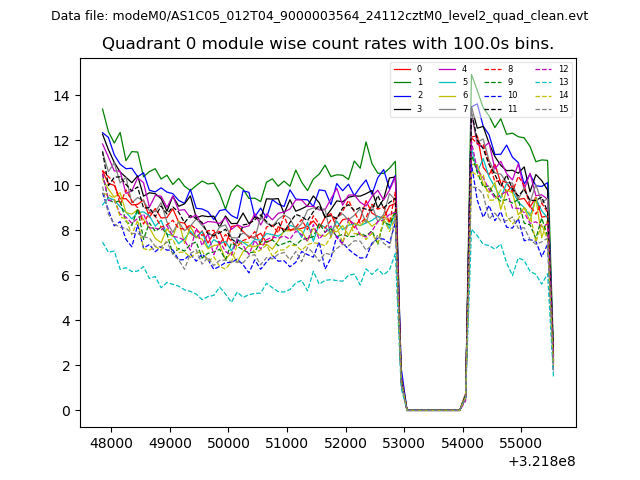 |
 |
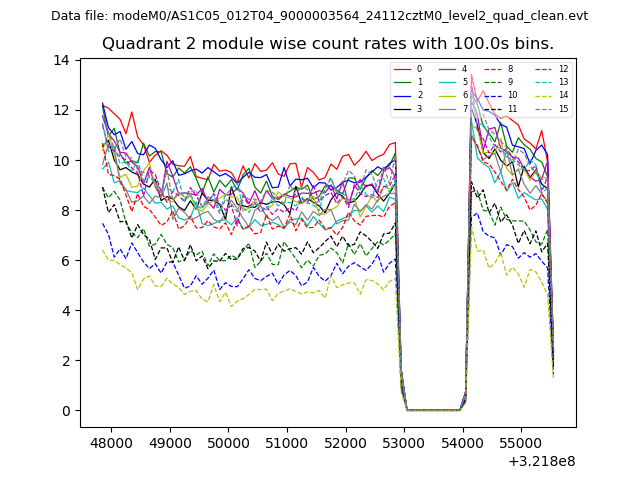
| Module-wise count rates for Quadrant B Data is divided into 100 sec bins |
 |
 |
| Module-wise count rates for Quadrant C Data is divided into 100 sec bins |
 |
 |
| Module-wise count rates for Quadrant D Data is divided into 100 sec bins |
 |
 |
| Parameter | Plot |
|---|---|
| CZT HV Monitor | 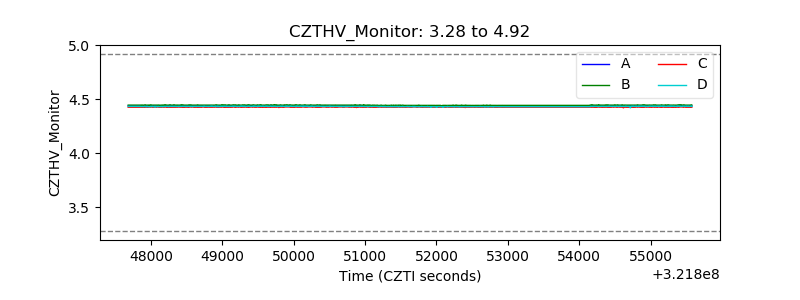 |
| D_VDD | 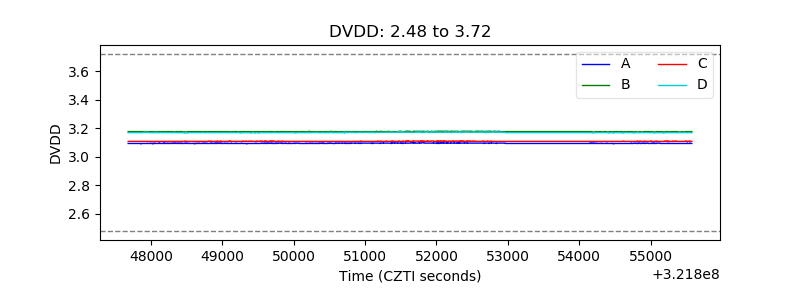 |
| Temperature 1 |  |
| Veto HV Monitor | 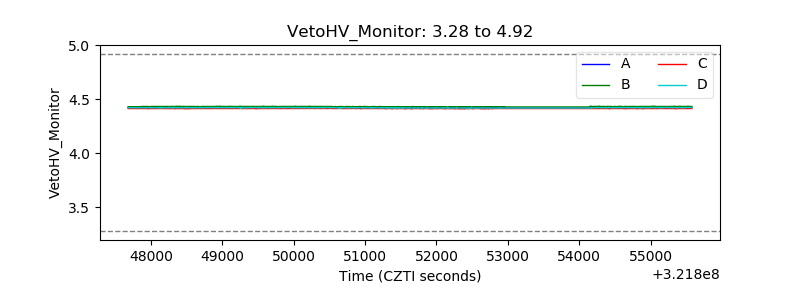 |
| Veto LLD |  |
| Alpha Counter | 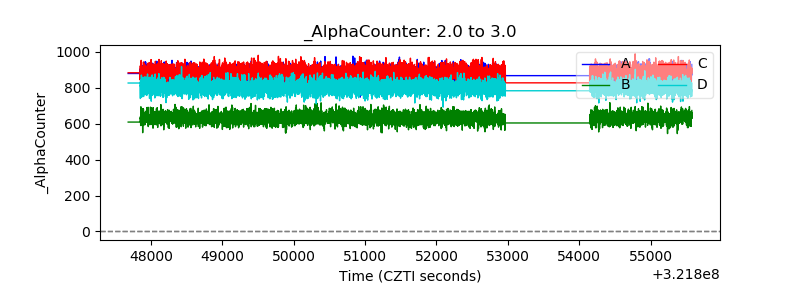 |
| _CPM_Rate | 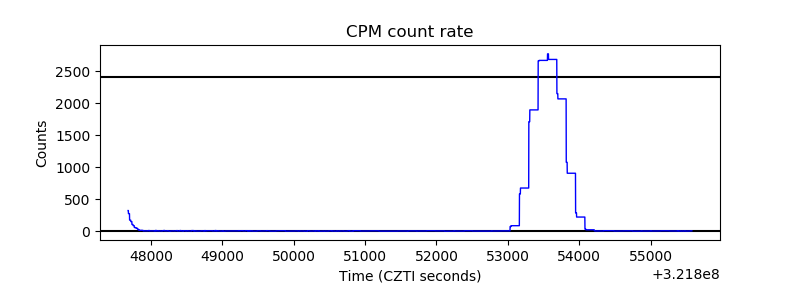 |
| CZT Counter | 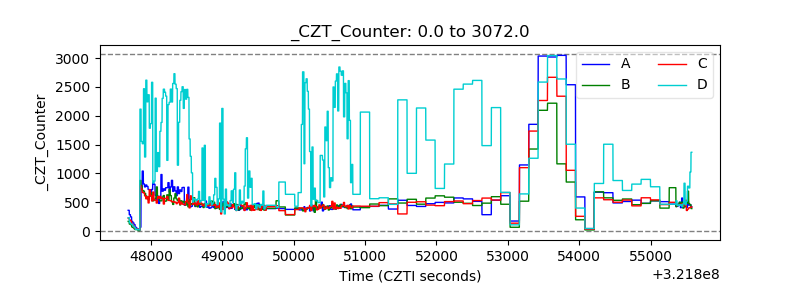 |
| +2.5 Volts monitor |  |
| +5 Volts monitor |  |
| _ROLL_ROT | 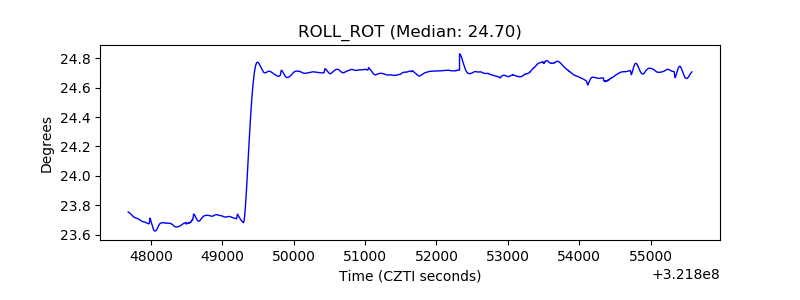 |
| _Roll_DEC | 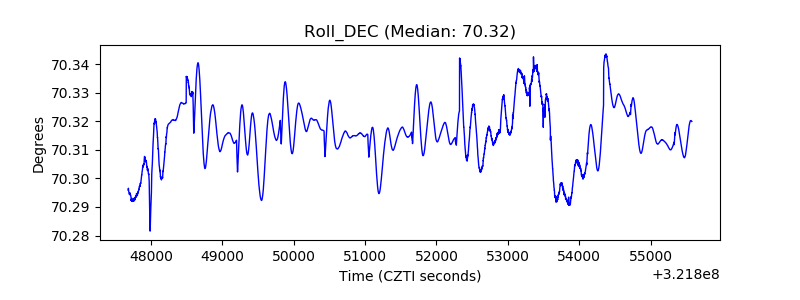 |
| _Roll_RA | 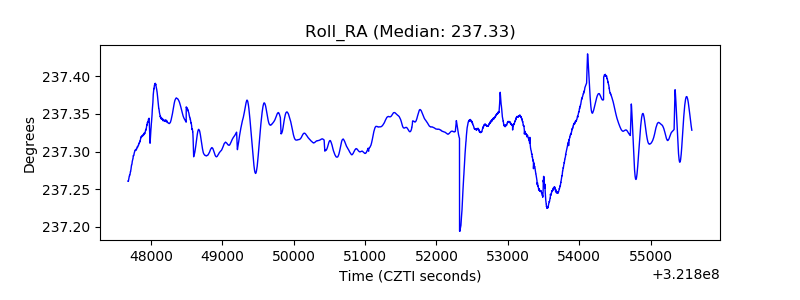 |
| Veto Counter | 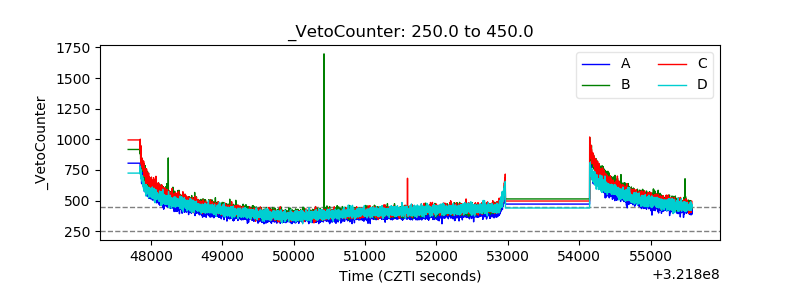 |