| Param | Original file | Final file |
|---|---|---|
| Filename | modeM0/AS1C05_012T04_9000003564_24113cztM0_level2.evt | modeM0/AS1C05_012T04_9000003564_24113cztM0_level2_quad_clean.evt |
| Size (bytes) | 502,963,200 | 102,024,000 |
| Size | 479.7 MB | 97.3 MB |
| Events in quadrant A | 2,503,481 | 738,598 |
| Events in quadrant B | 2,560,763 | 742,752 |
| Events in quadrant C | 2,443,709 | 694,754 |
| Events in quadrant D | 7,382,628 | 560,221 |
| Mode SS | |||
|---|---|---|---|
| Quadrant | BADHDUFLAG | Total packets | Discarded packets |
| A | 0 | 125 | 23 |
| B | 0 | 121 | 19 |
| C | 0 | 121 | 17 |
| D | 0 | 122 | 16 |
| Mode M0 | |||
|---|---|---|---|
| Quadrant | BADHDUFLAG | Total packets | Discarded packets |
| A | 0 | 12355 | 1837 |
| B | 0 | 12650 | 1982 |
| C | 0 | 12362 | 1948 |
| D | 0 | 29151 | 3774 |
| Mode M9 | |||
|---|---|---|---|
| Quadrant | BADHDUFLAG | Total packets | Discarded packets |
| A | 0 | 13 | 0 |
| B | 0 | 13 | 0 |
| C | 0 | 14 | 1 |
| D | 0 | 13 | 0 |
| Quadrant | Total seconds | Saturated seconds | Saturation percentage |
|---|---|---|---|
| A | 5071 | 23 | 0.453559% |
| B | 5045 | 44 | 0.872151% |
| C | 5034 | 41 | 0.814462% |
| D | 4955 | 1735 | 35.015136% |
Noise dominated data is calculated using 1-second bins in cleaned event files. If a bin has >2000 counts, and if more than 50% of those come from <1% of pixels, then it is considered to be noise-dominated and hence unusable.
| Quadrant | # 1 sec bins | Bins with >0 counts | Bins with >2000 counts | High rate bins dominated by noise | Noise dominated (total time) | Noise dominated (detector-on time) | Marked lightcurve |
|---|---|---|---|---|---|---|---|
| A | 7113 | 5205 | 0 | 0 | 0.00% | 0.00% | 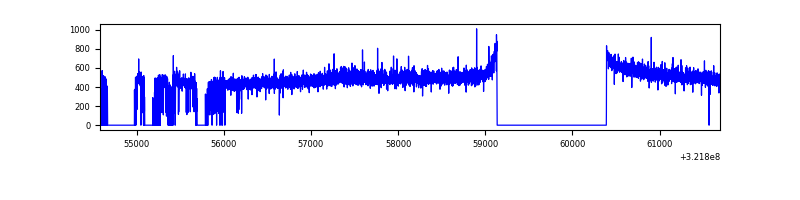 |
| B | 7102 | 5189 | 8 | 8 | 0.11% | 0.15% | 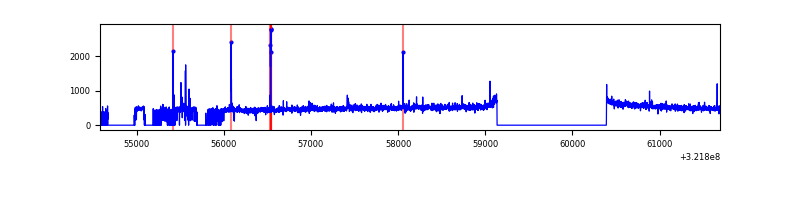 |
| C | 7097 | 5162 | 0 | 0 | 0.00% | 0.00% |  |
| D | 7076 | 5093 | 1629 | 1629 | 23.02% | 31.99% | 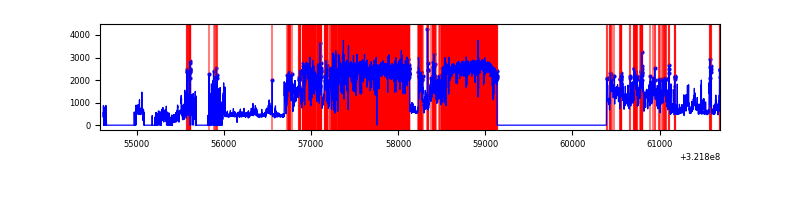 |
Top three noisy pixels from each quadrant. If the there are fewer than three noisy pixels in the level2.evt file, extra rows are filled as -1
| Pixel properties | Quadrant properties | ||||||
|---|---|---|---|---|---|---|---|
| Quadrant | DetID | PixID | Counts | Sigma | Mean | Median | Sigma |
| A | 2 | 250 | 10091 | 73.89 | 644 | 632 | 128.0 |
| A | 4 | 2 | 10057 | 73.62 | 644 | 632 | 128.0 |
| A | 13 | 254 | 8452 | 61.08 | 644 | 632 | 128.0 |
| B | 0 | 228 | 34530 | 287.2 | 633 | 619 | 118.1 |
| B | 10 | 247 | 15922 | 129.6 | 633 | 619 | 118.1 |
| B | 12 | 111 | 13348 | 107.8 | 633 | 619 | 118.1 |
| C | 14 | 238 | 98324 | 713.07 | 599 | 604 | 137.0 |
| C | 7 | 247 | 7305 | 48.9 | 599 | 604 | 137.0 |
| C | 13 | 61 | 4143 | 25.82 | 599 | 604 | 137.0 |
| D | 1 | 52 | 4488141 | 35833.95 | 519 | 502 | 125.2 |
| D | 8 | 195 | 769091 | 6137.21 | 519 | 502 | 125.2 |
| D | 12 | 233 | 101829 | 809.1 | 519 | 502 | 125.2 |
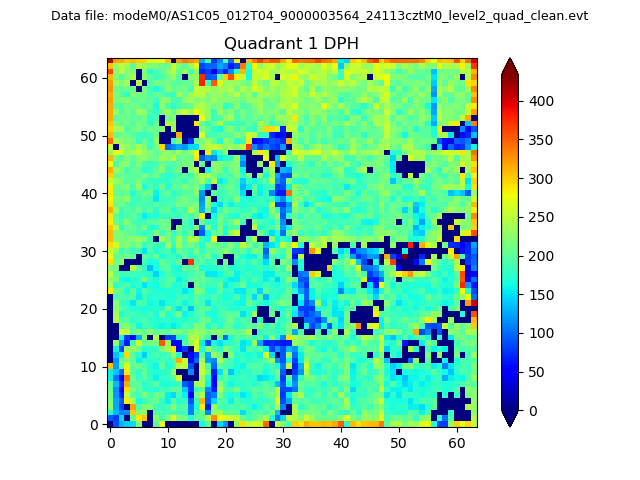
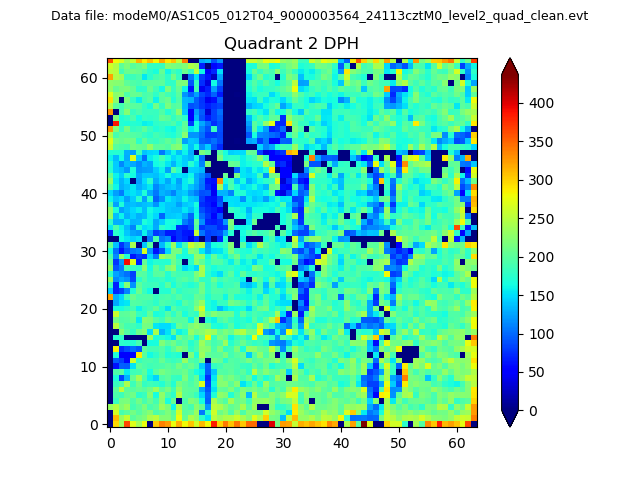
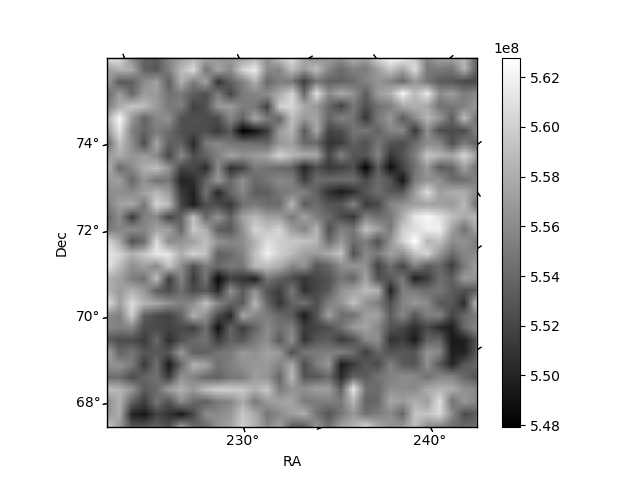
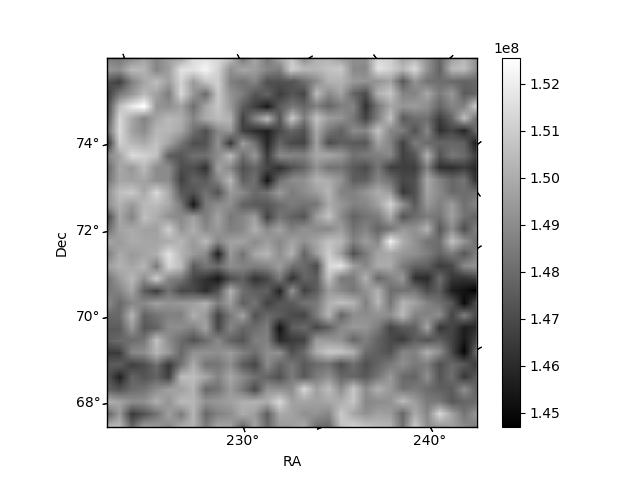
Histogram calculated using DETX and DETY for each event in the final _common_clean file
| Quadrant A | 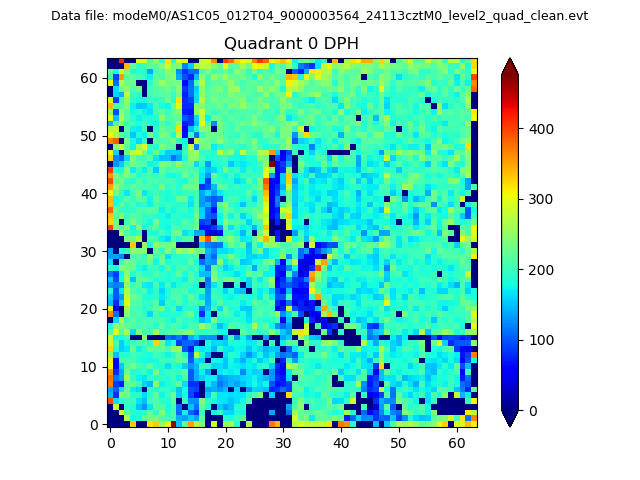 |
 |
Quadrant B |
|---|---|---|---|
| Quadrant D | 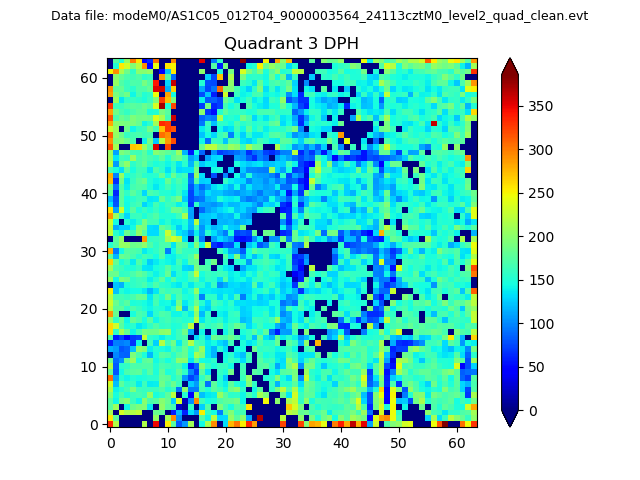 |
 |
Quadrant C |
| Plot type | Count rate plots | Images |
|---|---|---|
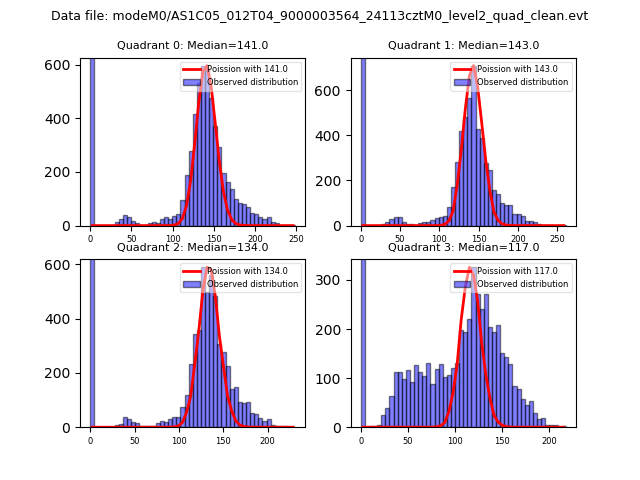
| Comparison with Poisson distribution Blue bars denote a histogram of data divided into 1 sec bins. Red curve is a Poisson curve with rate = median count rate of data. |
 |
 |
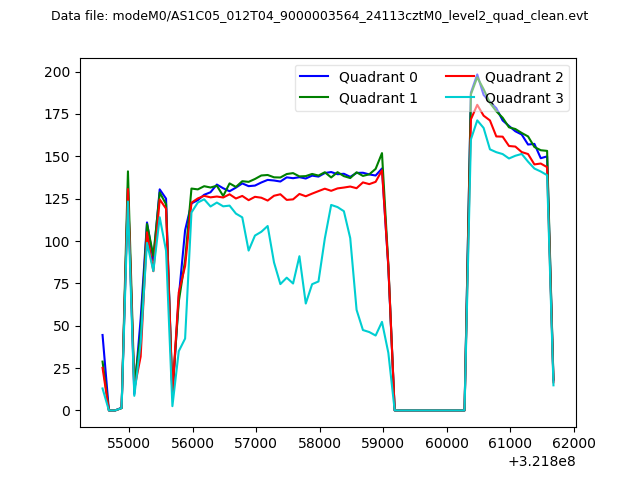
| Quadrant-wise count rates Data is divided into 100 sec bins |
 |
|
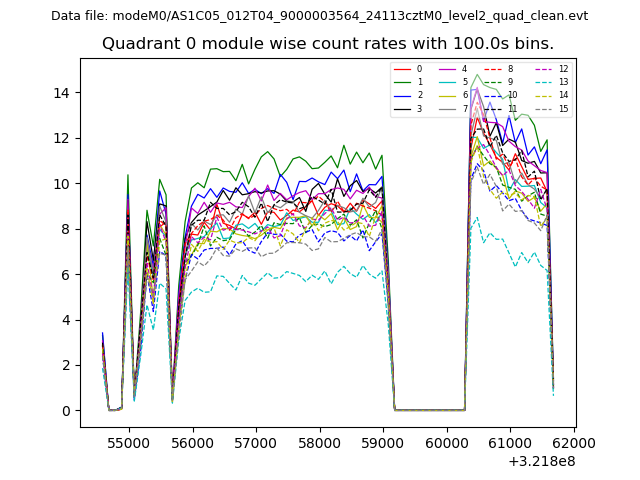
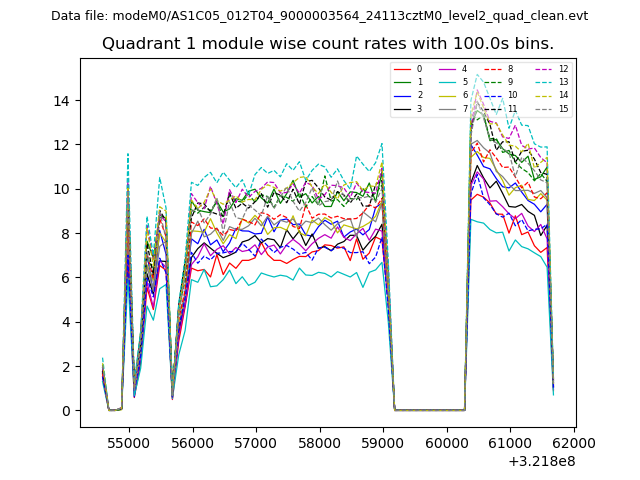
| Module-wise count rates for Quadrant A Data is divided into 100 sec bins |
 |
 |
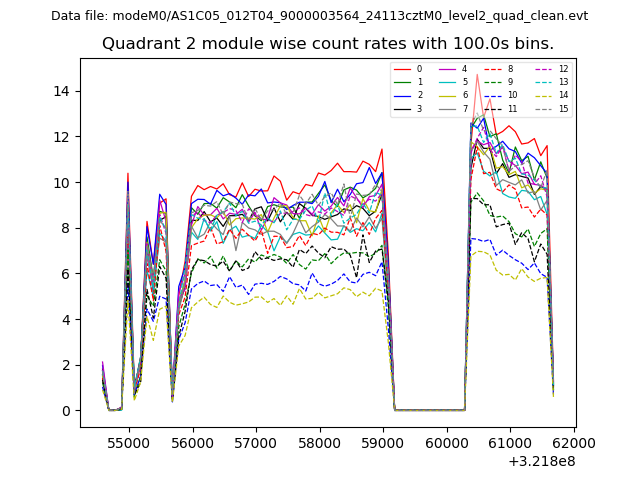
| Module-wise count rates for Quadrant B Data is divided into 100 sec bins |
 |
 |
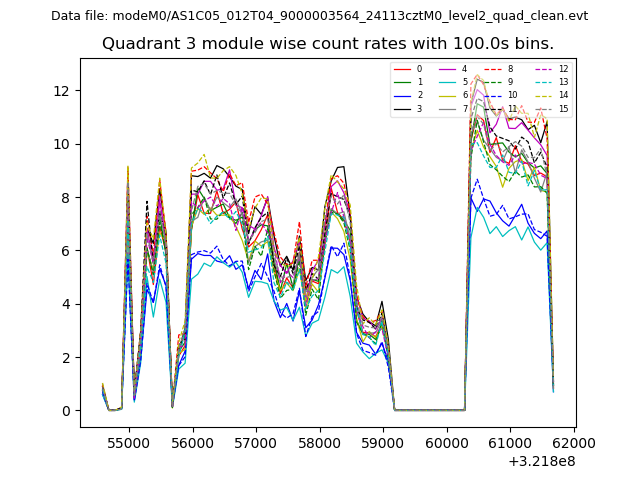
| Module-wise count rates for Quadrant C Data is divided into 100 sec bins |
 |
 |
| Module-wise count rates for Quadrant D Data is divided into 100 sec bins |
 |
 |
| Parameter | Plot |
|---|---|
| CZT HV Monitor | 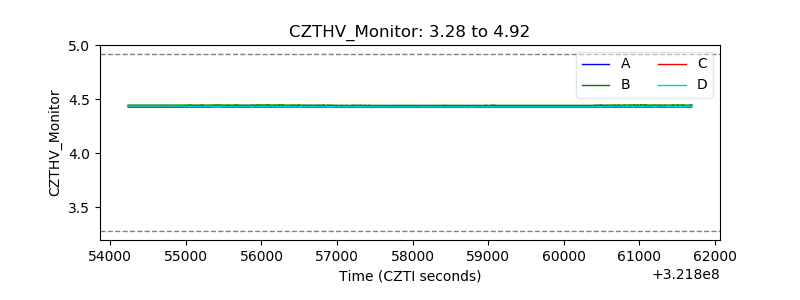 |
| D_VDD | 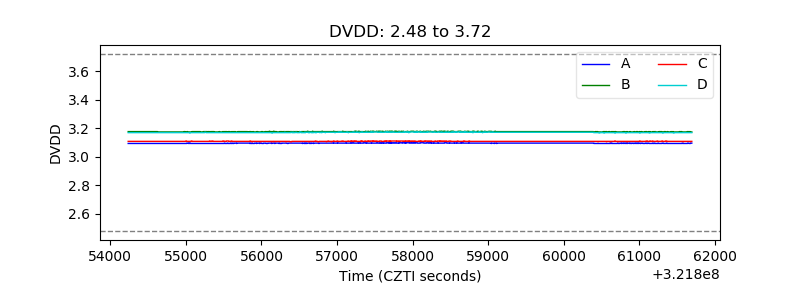 |
| Temperature 1 | 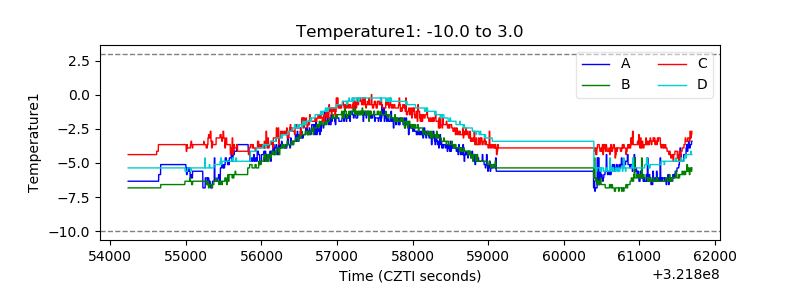 |
| Veto HV Monitor | 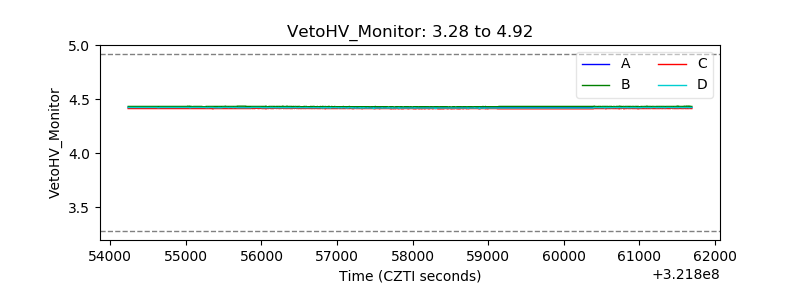 |
| Veto LLD | 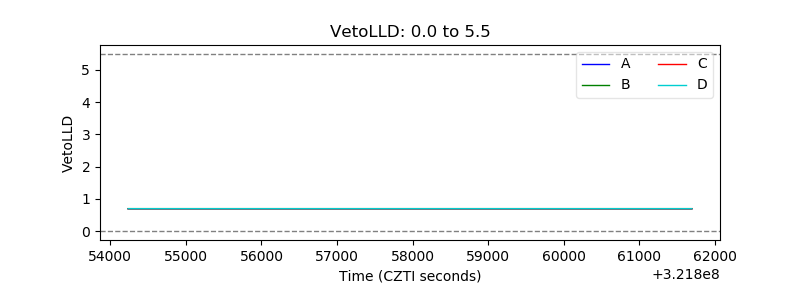 |
| Alpha Counter | 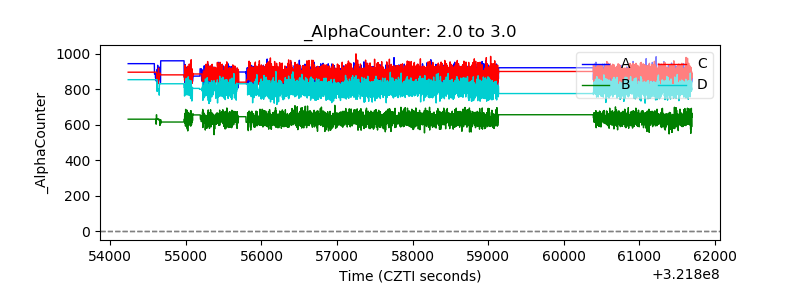 |
| _CPM_Rate | 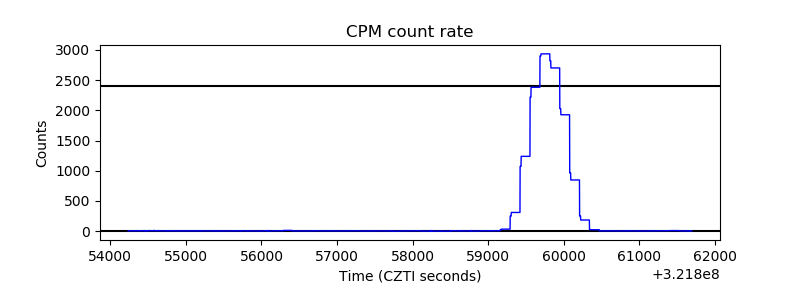 |
| CZT Counter | 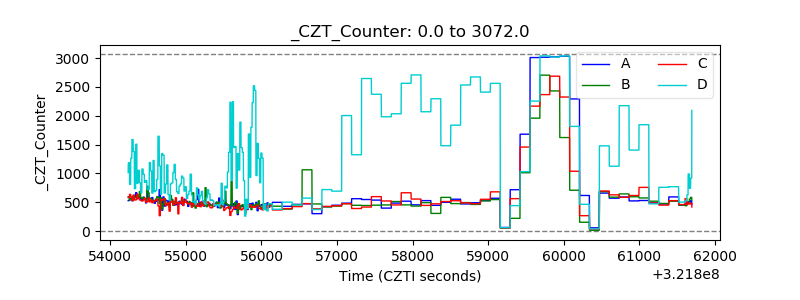 |
| +2.5 Volts monitor |  |
| +5 Volts monitor |  |
| _ROLL_ROT | 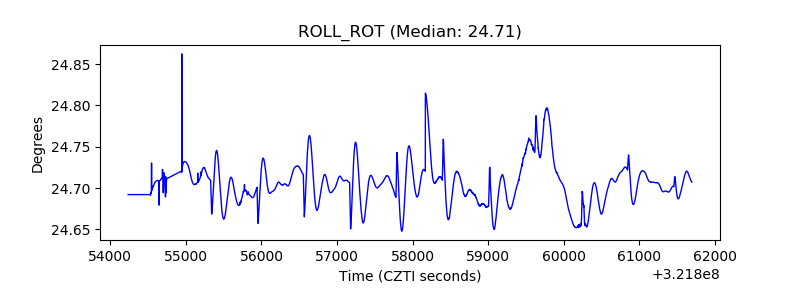 |
| _Roll_DEC | 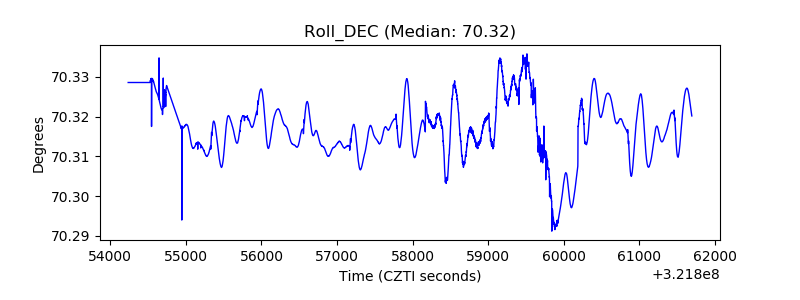 |
| _Roll_RA | 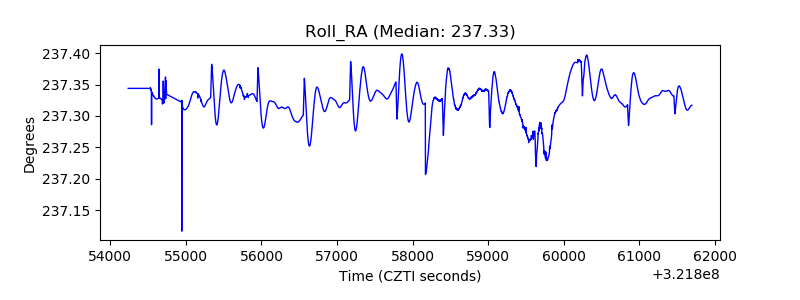 |
| Veto Counter | 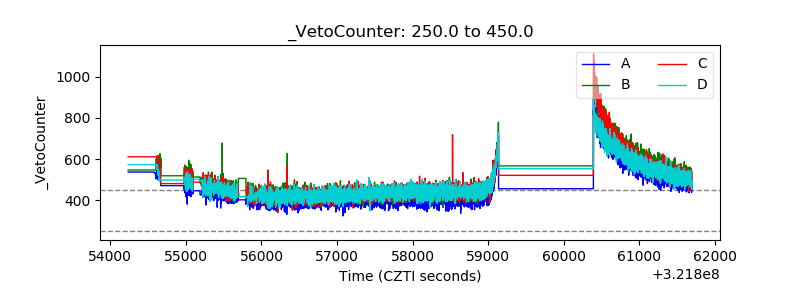 |