| Param | Original file | Final file |
|---|---|---|
| Filename | modeM0/AS1C05_012T04_9000003564_24114cztM0_level2.evt | modeM0/AS1C05_012T04_9000003564_24114cztM0_level2_quad_clean.evt |
| Size (bytes) | 925,937,280 | 214,868,160 |
| Size | 883.0 MB | 204.9 MB |
| Events in quadrant A | 5,124,522 | 1,525,445 |
| Events in quadrant B | 5,276,830 | 1,535,177 |
| Events in quadrant C | 5,050,993 | 1,439,811 |
| Events in quadrant D | 11,892,859 | 1,292,720 |
| Mode SS | |||
|---|---|---|---|
| Quadrant | BADHDUFLAG | Total packets | Discarded packets |
| A | 0 | 210 | 0 |
| B | 0 | 210 | 0 |
| C | 0 | 210 | 0 |
| D | 0 | 210 | 0 |
| Mode M0 | |||
|---|---|---|---|
| Quadrant | BADHDUFLAG | Total packets | Discarded packets |
| A | 0 | 21437 | 2 |
| B | 0 | 21850 | 2 |
| C | 0 | 21383 | 2 |
| D | 0 | 42614 | 2 |
| Mode M9 | |||
|---|---|---|---|
| Quadrant | BADHDUFLAG | Total packets | Discarded packets |
| A | 0 | 26 | 0 |
| B | 0 | 26 | 0 |
| C | 0 | 26 | 0 |
| D | 0 | 26 | 0 |
| Quadrant | Total seconds | Saturated seconds | Saturation percentage |
|---|---|---|---|
| A | 10319 | 55 | 0.532997% |
| B | 10320 | 91 | 0.881783% |
| C | 10320 | 76 | 0.736434% |
| D | 10320 | 1840 | 17.829457% |
Noise dominated data is calculated using 1-second bins in cleaned event files. If a bin has >2000 counts, and if more than 50% of those come from <1% of pixels, then it is considered to be noise-dominated and hence unusable.
| Quadrant | # 1 sec bins | Bins with >0 counts | Bins with >2000 counts | High rate bins dominated by noise | Noise dominated (total time) | Noise dominated (detector-on time) | Marked lightcurve |
|---|---|---|---|---|---|---|---|
| A | 12899 | 10321 | 0 | 0 | 0.00% | 0.00% | 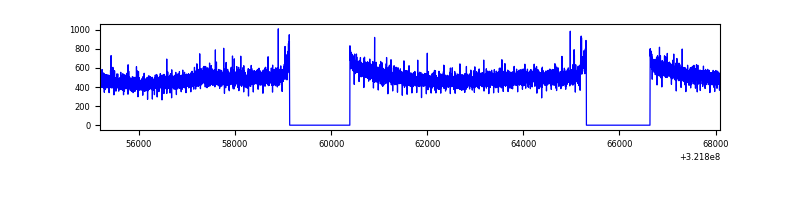 |
| B | 12900 | 10322 | 18 | 18 | 0.14% | 0.17% | 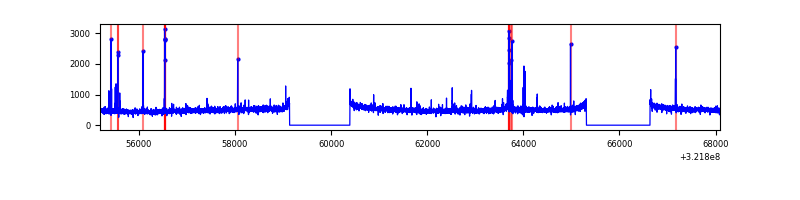 |
| C | 12900 | 10322 | 0 | 0 | 0.00% | 0.00% | 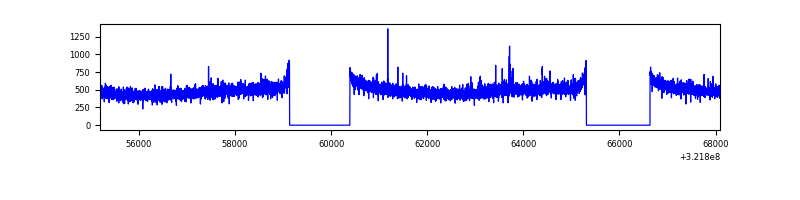 |
| D | 12900 | 10321 | 1764 | 1764 | 13.67% | 17.09% | 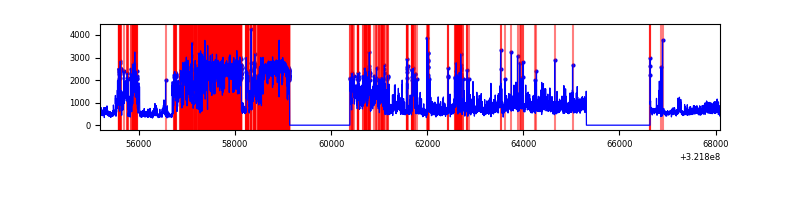 |
Top three noisy pixels from each quadrant. If the there are fewer than three noisy pixels in the level2.evt file, extra rows are filled as -1
| Pixel properties | Quadrant properties | ||||||
|---|---|---|---|---|---|---|---|
| Quadrant | DetID | PixID | Counts | Sigma | Mean | Median | Sigma |
| A | 13 | 254 | 16857 | 60.1 | 1322 | 1302 | 258.8 |
| A | 2 | 250 | 13571 | 47.4 | 1322 | 1302 | 258.8 |
| A | 0 | 226 | 11481 | 39.33 | 1322 | 1302 | 258.8 |
| B | 0 | 228 | 60001 | 244.96 | 1300 | 1273 | 239.7 |
| B | 5 | 172 | 49732 | 202.13 | 1300 | 1273 | 239.7 |
| B | 10 | 247 | 30586 | 122.27 | 1300 | 1273 | 239.7 |
| C | 14 | 238 | 202666 | 721.19 | 1233 | 1243 | 279.3 |
| C | 0 | 239 | 23570 | 79.94 | 1233 | 1243 | 279.3 |
| C | 7 | 247 | 12280 | 39.52 | 1233 | 1243 | 279.3 |
| D | 1 | 52 | 5152643 | 18505.5 | 1175 | 1140 | 278.4 |
| D | 8 | 195 | 1983804 | 7122.23 | 1175 | 1140 | 278.4 |
| D | 12 | 233 | 128226 | 456.53 | 1175 | 1140 | 278.4 |
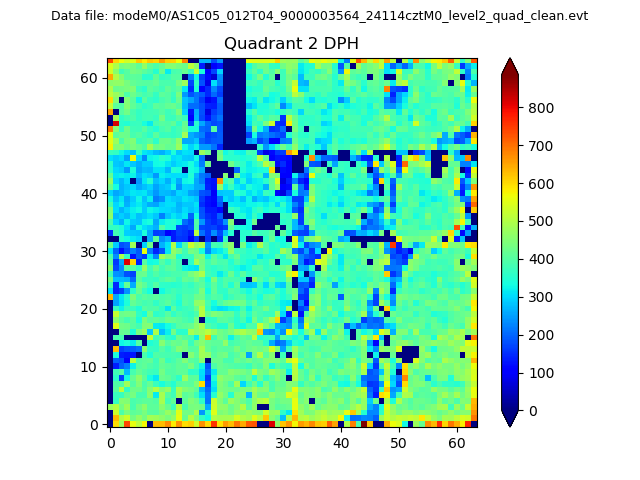
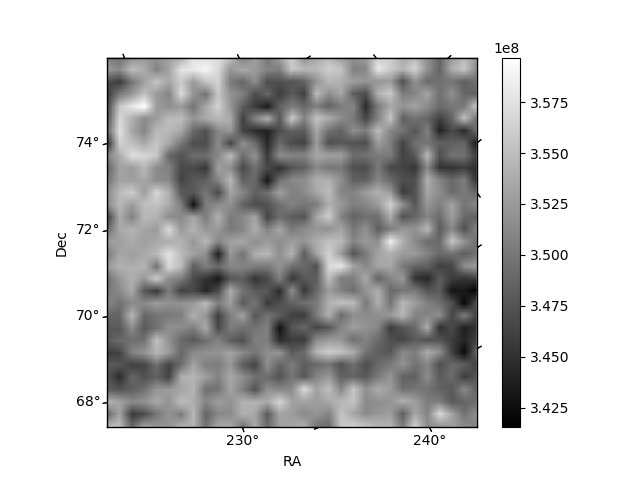
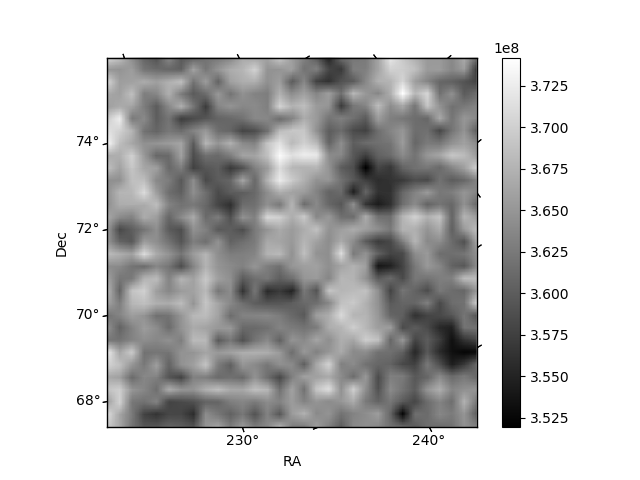
Histogram calculated using DETX and DETY for each event in the final _common_clean file
| Quadrant A | 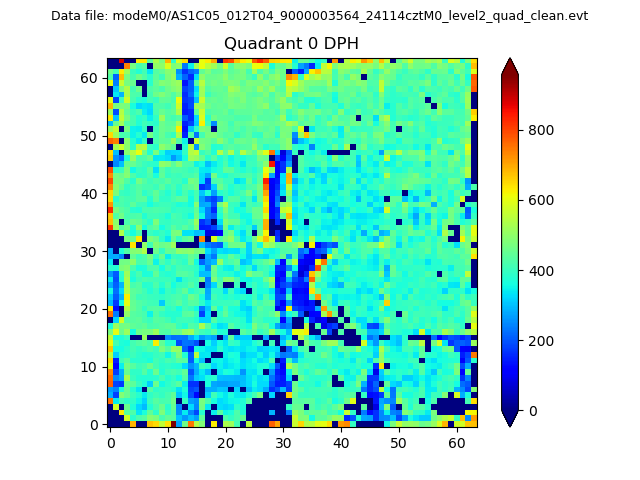 |
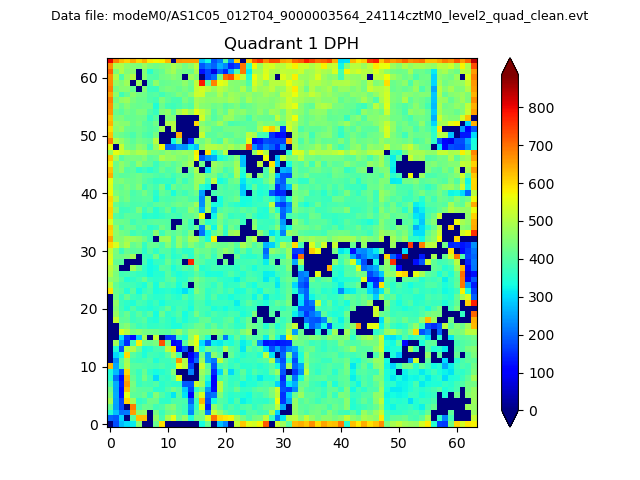 |
Quadrant B |
|---|---|---|---|
| Quadrant D | 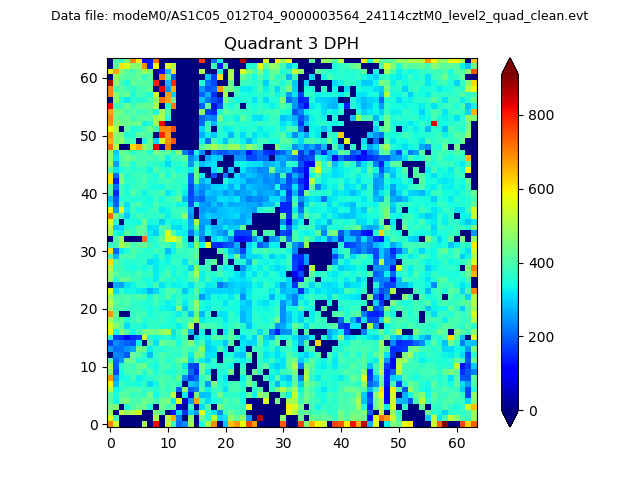 |
 |
Quadrant C |
| Plot type | Count rate plots | Images |
|---|---|---|
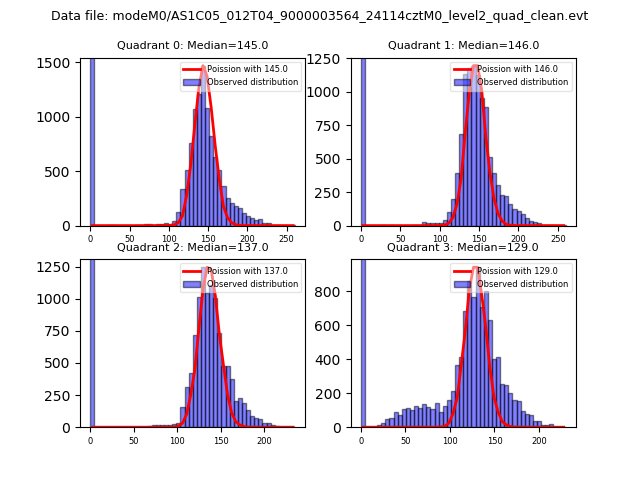
| Comparison with Poisson distribution Blue bars denote a histogram of data divided into 1 sec bins. Red curve is a Poisson curve with rate = median count rate of data. |
 |
 |
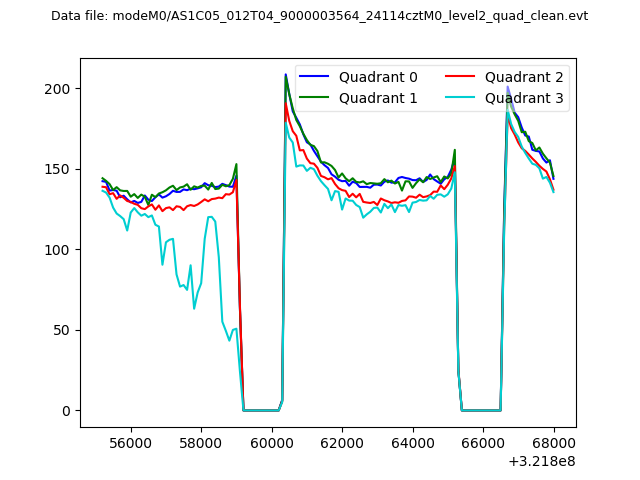
| Quadrant-wise count rates Data is divided into 100 sec bins |
 |
|
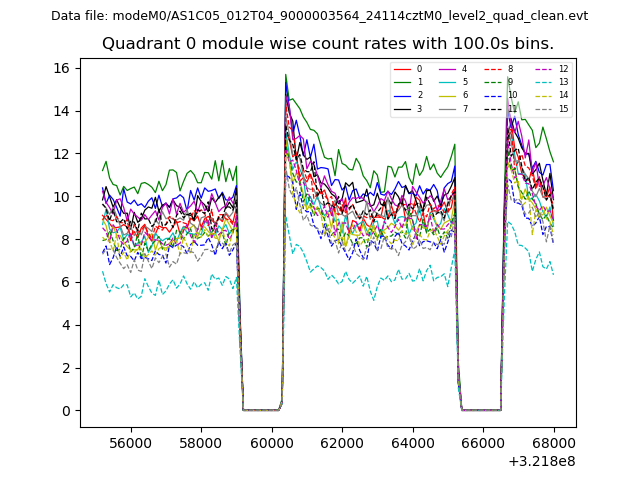
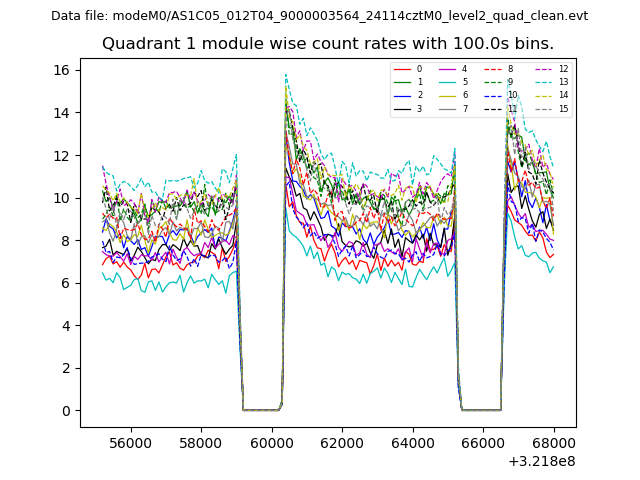
| Module-wise count rates for Quadrant A Data is divided into 100 sec bins |
 |
 |
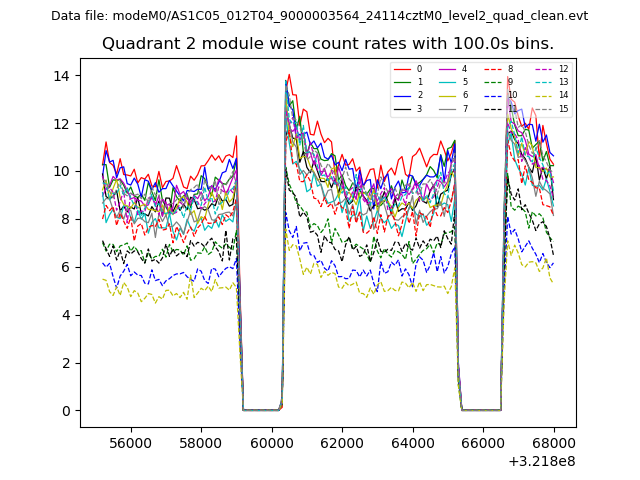
| Module-wise count rates for Quadrant B Data is divided into 100 sec bins |
 |
 |
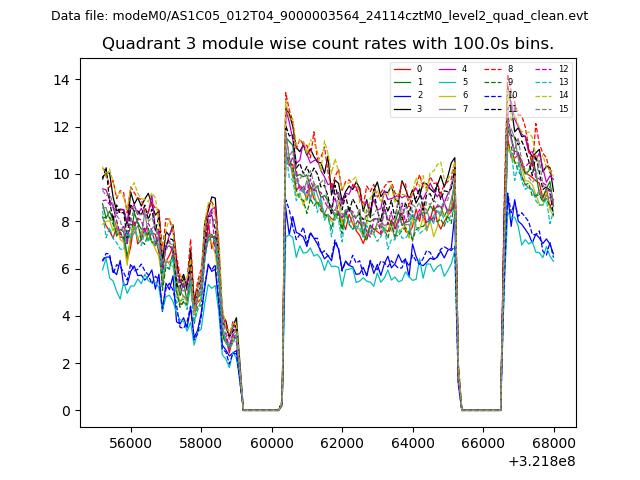
| Module-wise count rates for Quadrant C Data is divided into 100 sec bins |
 |
 |
| Module-wise count rates for Quadrant D Data is divided into 100 sec bins |
 |
 |
| Parameter | Plot |
|---|---|
| CZT HV Monitor | 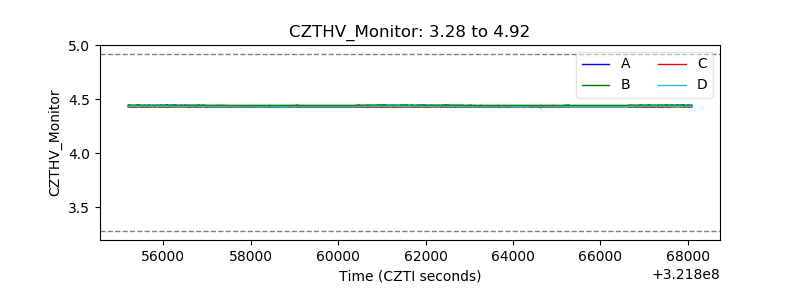 |
| D_VDD | 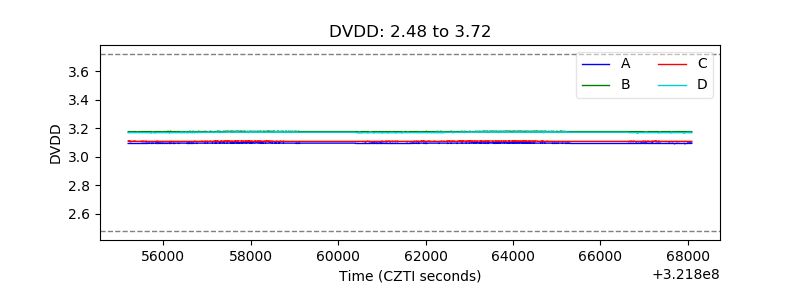 |
| Temperature 1 | 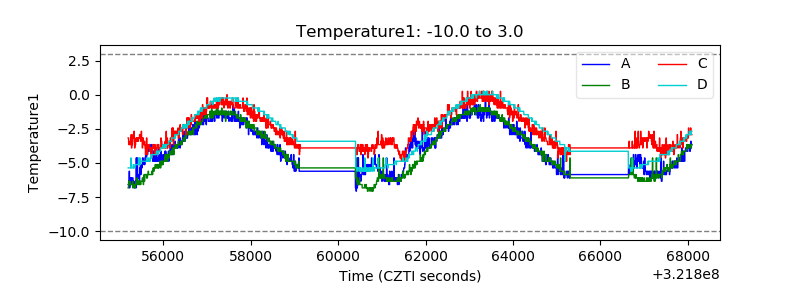 |
| Veto HV Monitor | 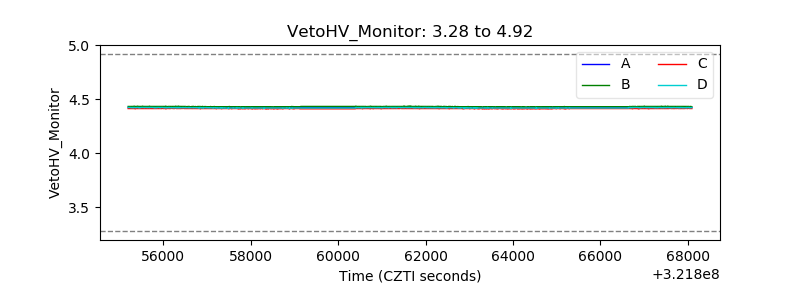 |
| Veto LLD | 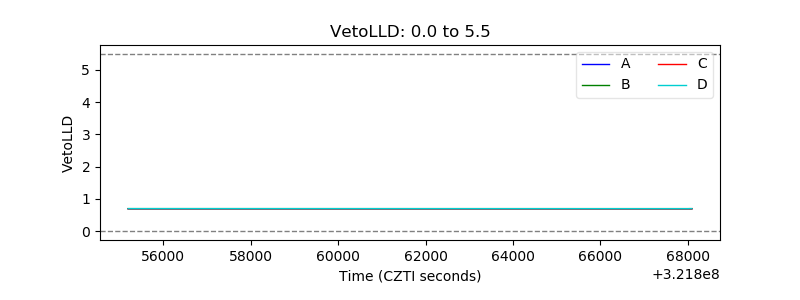 |
| Alpha Counter | 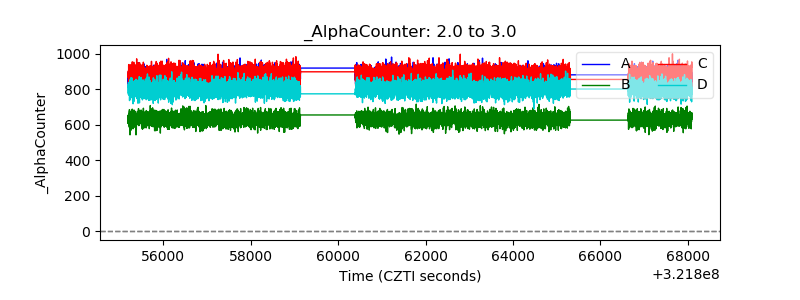 |
| _CPM_Rate | 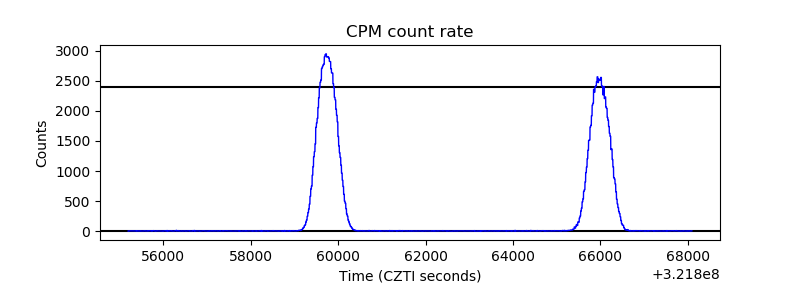 |
| CZT Counter | 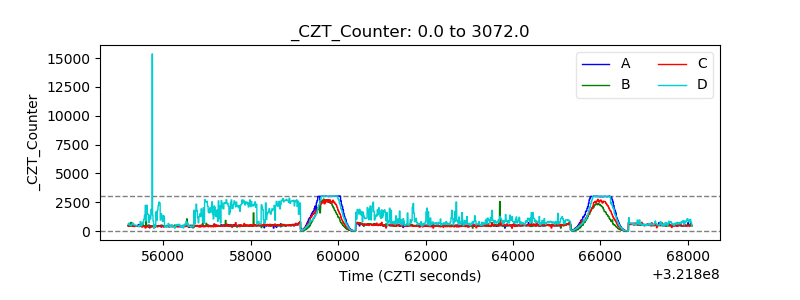 |
| +2.5 Volts monitor |  |
| +5 Volts monitor |  |
| _ROLL_ROT | 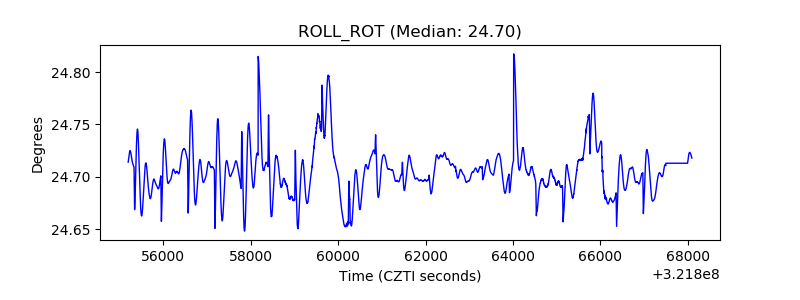 |
| _Roll_DEC |  |
| _Roll_RA | 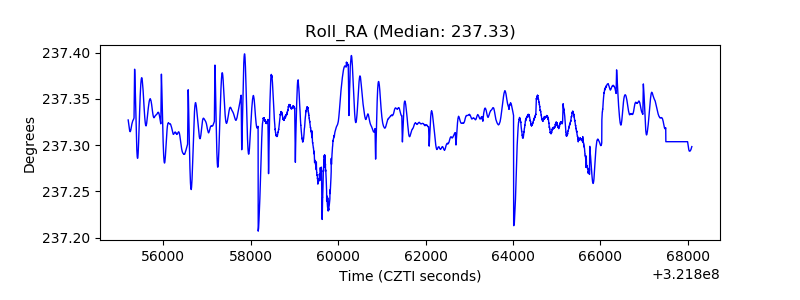 |
| Veto Counter | 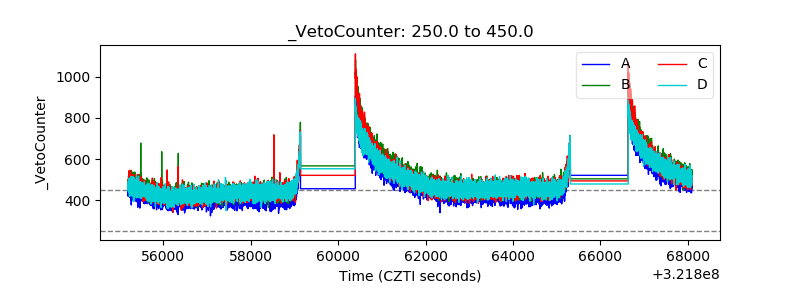 |