| Param | Original file | Final file |
|---|---|---|
| Filename | modeM0/AS1C05_012T04_9000003564_24115cztM0_level2.evt | modeM0/AS1C05_012T04_9000003564_24115cztM0_level2_quad_clean.evt |
| Size (bytes) | 269,256,960 | 77,448,960 |
| Size | 256.8 MB | 73.9 MB |
| Events in quadrant A | 1,783,000 | 541,881 |
| Events in quadrant B | 1,814,129 | 546,383 |
| Events in quadrant C | 1,736,981 | 506,536 |
| Events in quadrant D | 2,578,179 | 499,651 |
| Mode SS | |||
|---|---|---|---|
| Quadrant | BADHDUFLAG | Total packets | Discarded packets |
| A | 0 | 78 | 2 |
| B | 0 | 78 | 4 |
| C | 0 | 79 | 3 |
| D | 0 | 80 | 6 |
| Mode M0 | |||
|---|---|---|---|
| Quadrant | BADHDUFLAG | Total packets | Discarded packets |
| A | 0 | 7576 | 306 |
| B | 0 | 7669 | 294 |
| C | 0 | 7632 | 363 |
| D | 0 | 10352 | 392 |
| Mode M9 | |||
|---|---|---|---|
| Quadrant | BADHDUFLAG | Total packets | Discarded packets |
| A | 0 | 12 | 1 |
| B | 0 | 12 | 1 |
| C | 0 | 12 | 1 |
| D | 0 | 12 | 1 |
| Quadrant | Total seconds | Saturated seconds | Saturation percentage |
|---|---|---|---|
| A | 3535 | 40 | 1.131542% |
| B | 3543 | 59 | 1.665255% |
| C | 3530 | 42 | 1.189802% |
| D | 3538 | 100 | 2.826456% |
Noise dominated data is calculated using 1-second bins in cleaned event files. If a bin has >2000 counts, and if more than 50% of those come from <1% of pixels, then it is considered to be noise-dominated and hence unusable.
| Quadrant | # 1 sec bins | Bins with >0 counts | Bins with >2000 counts | High rate bins dominated by noise | Noise dominated (total time) | Noise dominated (detector-on time) | Marked lightcurve |
|---|---|---|---|---|---|---|---|
| A | 6985 | 3551 | 0 | 0 | 0.00% | 0.00% | 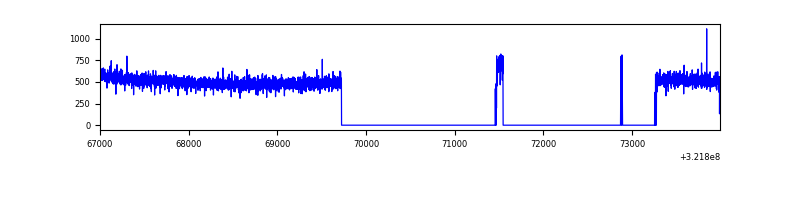 |
| B | 6986 | 3553 | 1 | 1 | 0.01% | 0.03% | 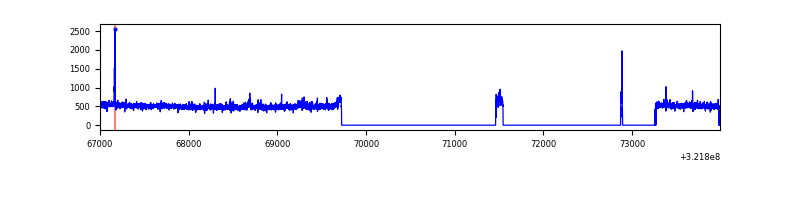 |
| C | 6988 | 3548 | 0 | 0 | 0.00% | 0.00% | 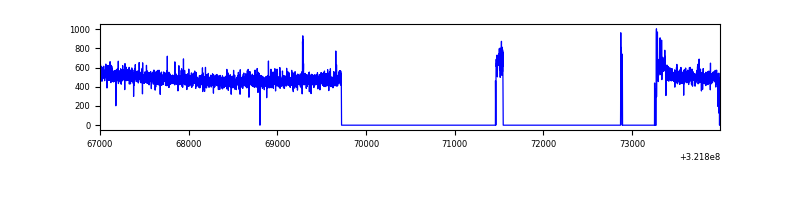 |
| D | 6986 | 3560 | 47 | 47 | 0.67% | 1.32% | 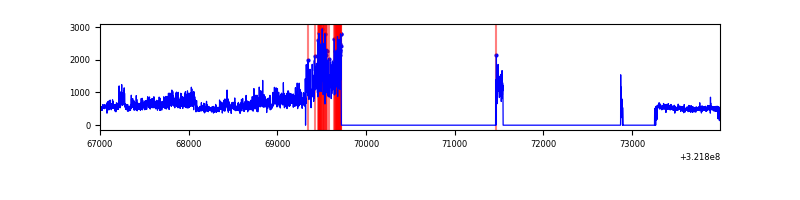 |
Top three noisy pixels from each quadrant. If the there are fewer than three noisy pixels in the level2.evt file, extra rows are filled as -1
| Pixel properties | Quadrant properties | ||||||
|---|---|---|---|---|---|---|---|
| Quadrant | DetID | PixID | Counts | Sigma | Mean | Median | Sigma |
| A | 13 | 254 | 5211 | 51.26 | 462 | 455 | 92.8 |
| A | 0 | 226 | 4141 | 39.73 | 462 | 455 | 92.8 |
| A | 3 | 137 | 3679 | 34.75 | 462 | 455 | 92.8 |
| B | 0 | 228 | 17042 | 196.49 | 449 | 440 | 84.5 |
| B | 5 | 172 | 13259 | 151.71 | 449 | 440 | 84.5 |
| B | 0 | 190 | 9837 | 111.21 | 449 | 440 | 84.5 |
| C | 14 | 238 | 70091 | 719.99 | 420 | 423 | 96.8 |
| C | 0 | 239 | 13880 | 139.07 | 420 | 423 | 96.8 |
| C | 7 | 247 | 8130 | 79.65 | 420 | 423 | 96.8 |
| D | 8 | 195 | 905253 | 8627.29 | 436 | 425 | 104.9 |
| D | 2 | 234 | 14284 | 132.14 | 436 | 425 | 104.9 |
| D | 1 | 52 | 13819 | 127.71 | 436 | 425 | 104.9 |
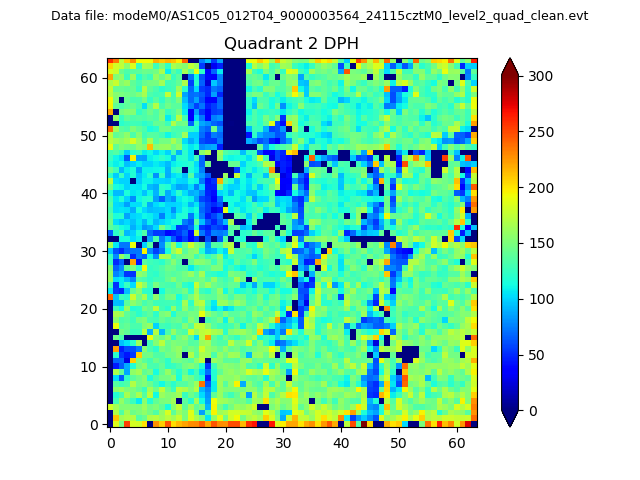
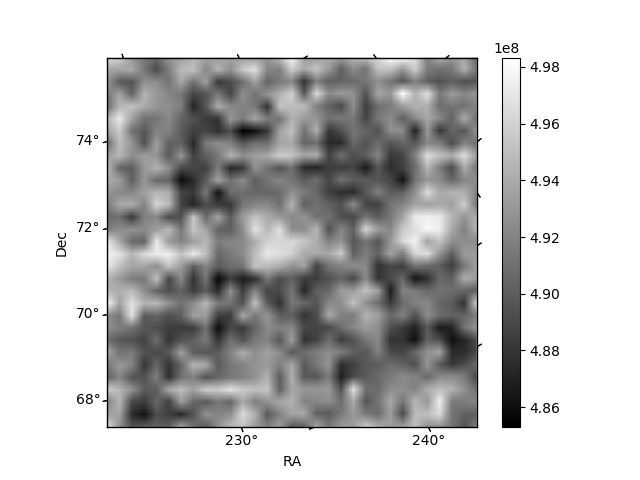
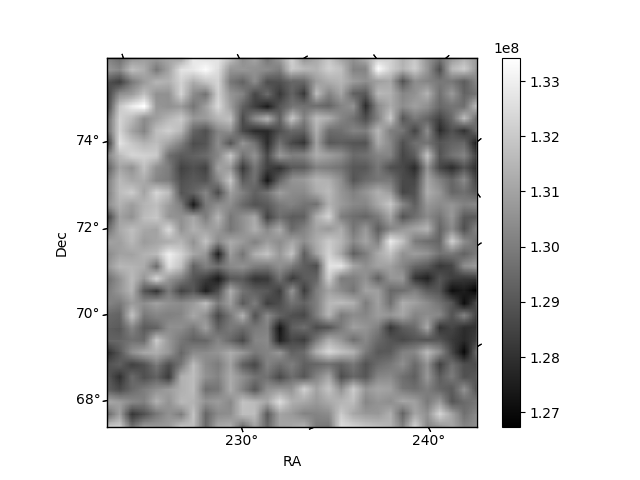
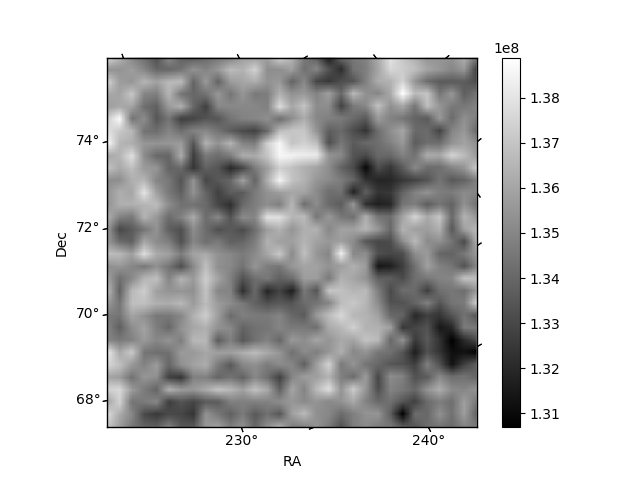
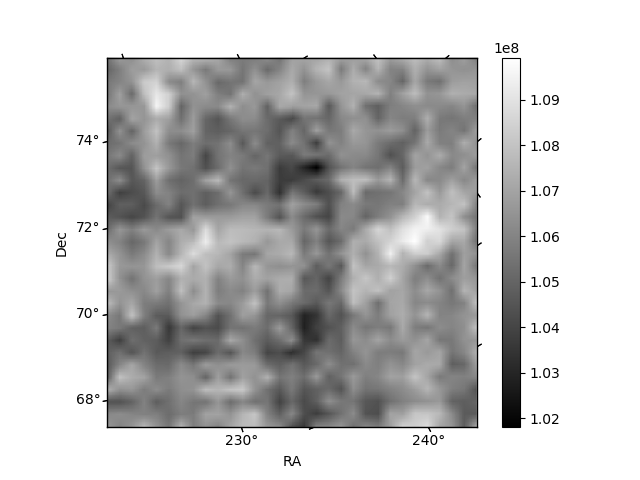
Histogram calculated using DETX and DETY for each event in the final _common_clean file
| Quadrant A | 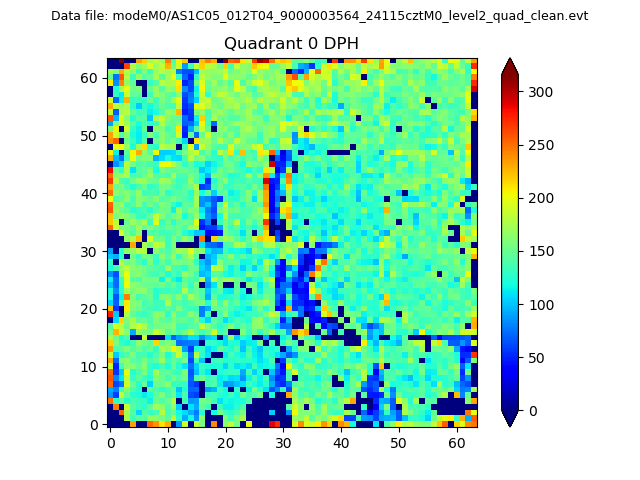 |
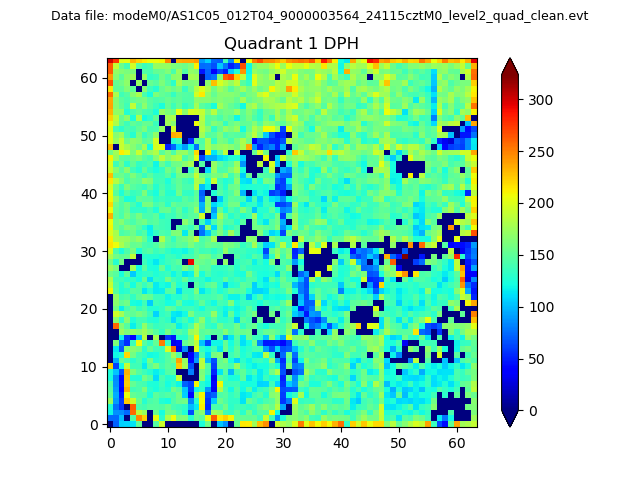 |
Quadrant B |
|---|---|---|---|
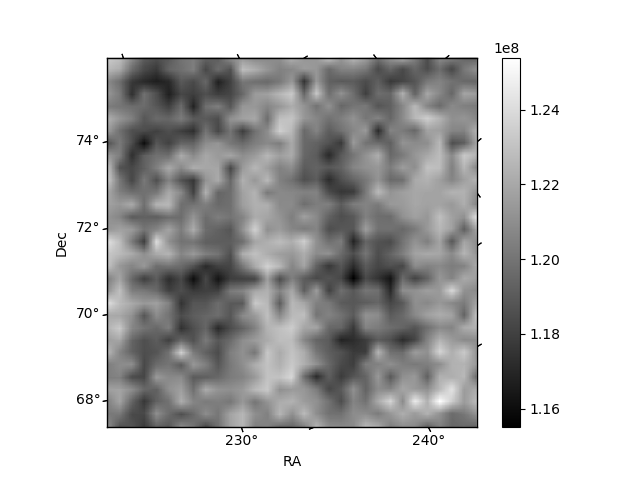
| Quadrant D | 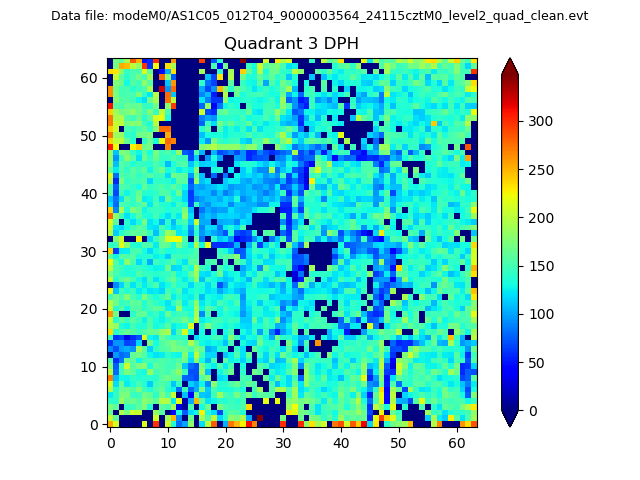 |
 |
Quadrant C |
| Plot type | Count rate plots | Images |
|---|---|---|
| Comparison with Poisson distribution Blue bars denote a histogram of data divided into 1 sec bins. Red curve is a Poisson curve with rate = median count rate of data. |
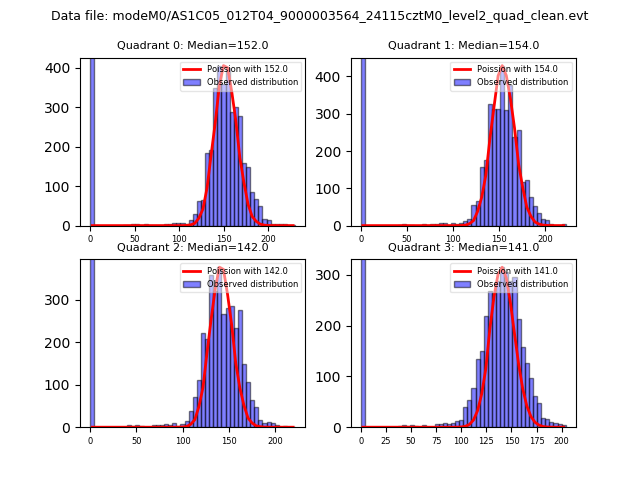 |
 |
| Quadrant-wise count rates Data is divided into 100 sec bins |
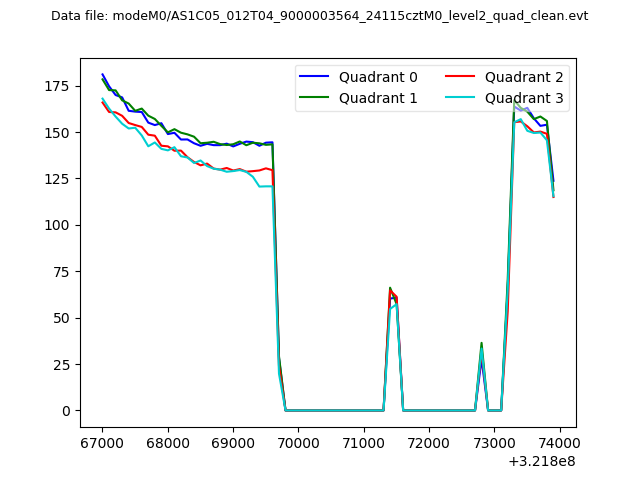 |
|
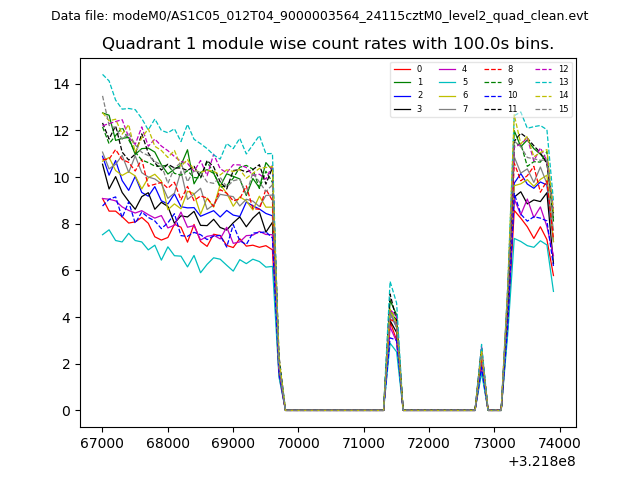
| Module-wise count rates for Quadrant A Data is divided into 100 sec bins |
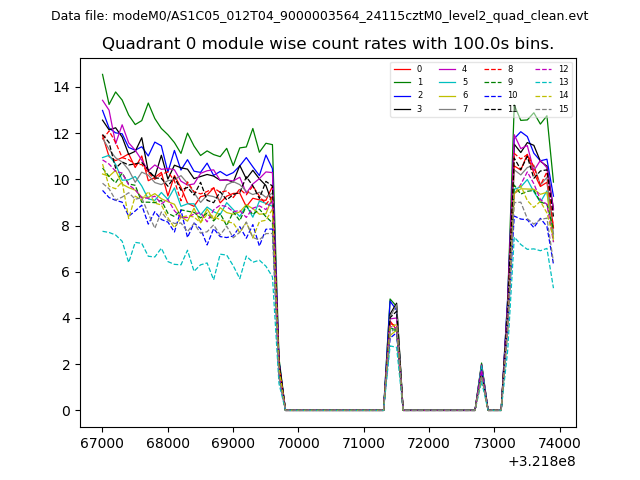 |
 |
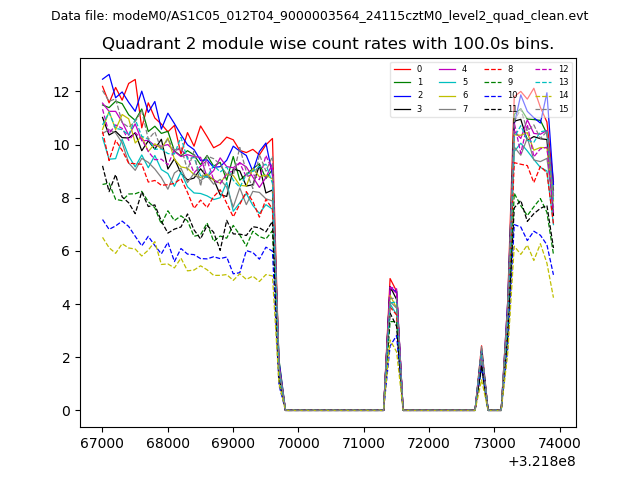
| Module-wise count rates for Quadrant B Data is divided into 100 sec bins |
 |
 |
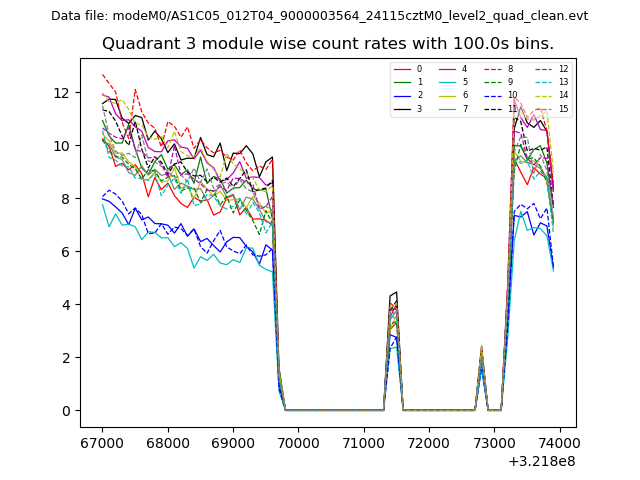
| Module-wise count rates for Quadrant C Data is divided into 100 sec bins |
 |
 |
| Module-wise count rates for Quadrant D Data is divided into 100 sec bins |
 |
 |
| Parameter | Plot |
|---|---|
| CZT HV Monitor | 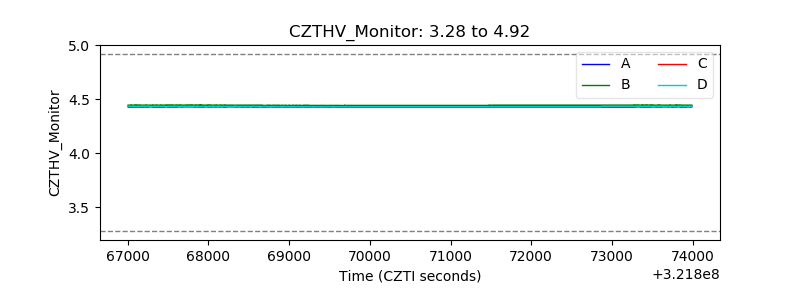 |
| D_VDD | 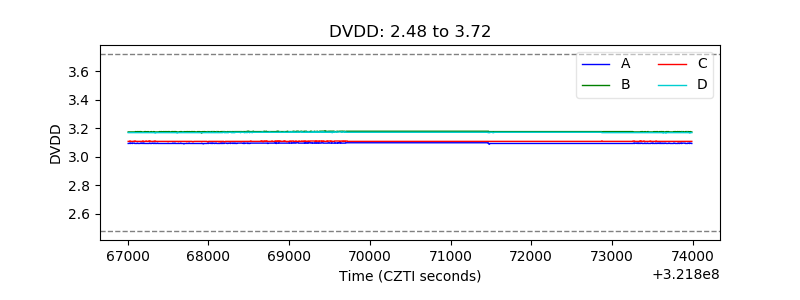 |
| Temperature 1 | 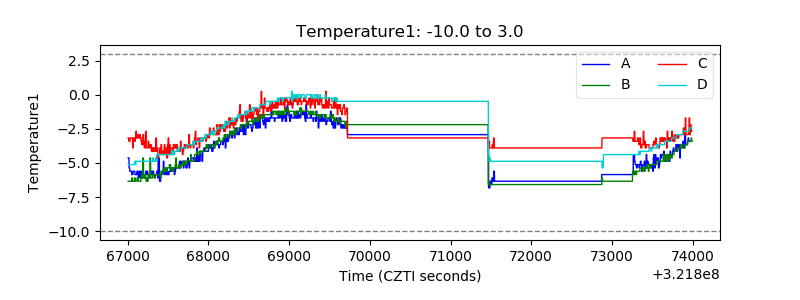 |
| Veto HV Monitor | 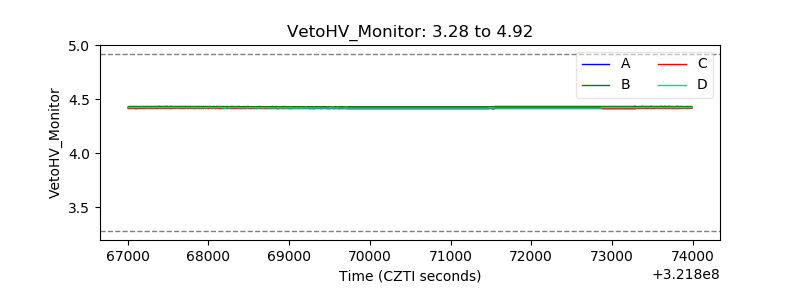 |
| Veto LLD | 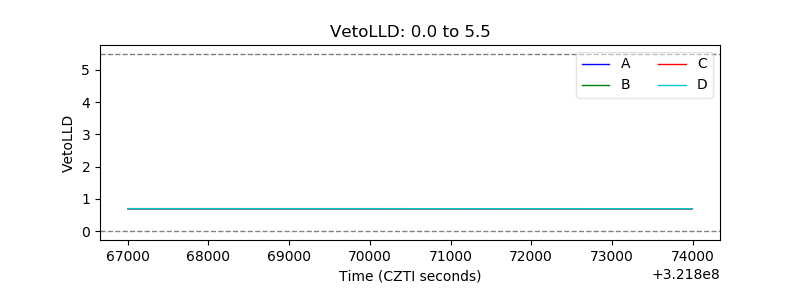 |
| Alpha Counter | 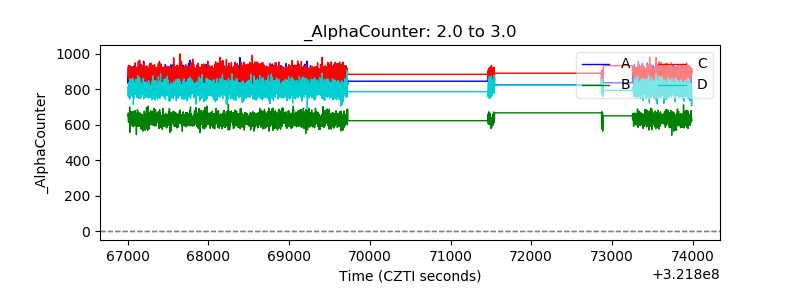 |
| _CPM_Rate | 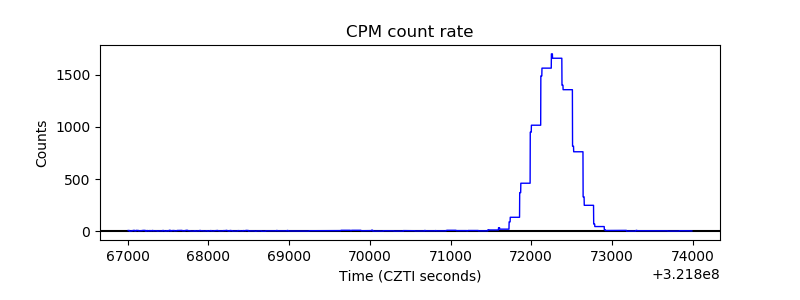 |
| CZT Counter | 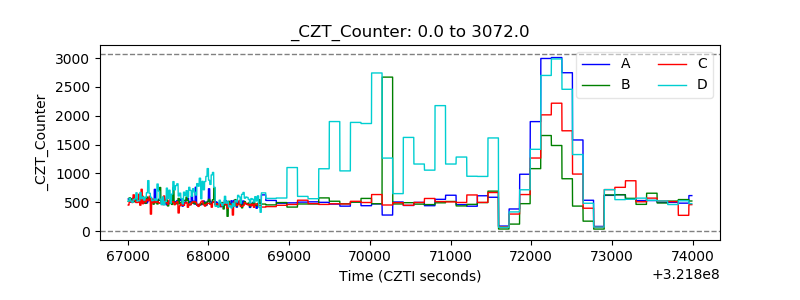 |
| +2.5 Volts monitor |  |
| +5 Volts monitor |  |
| _ROLL_ROT | 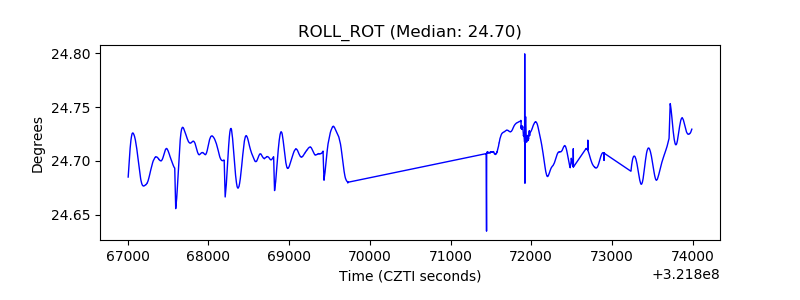 |
| _Roll_DEC | 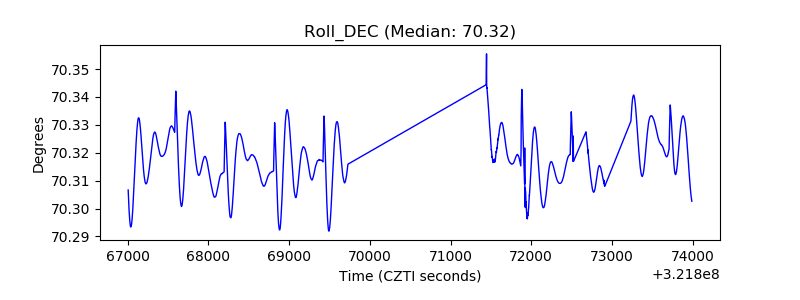 |
| _Roll_RA | 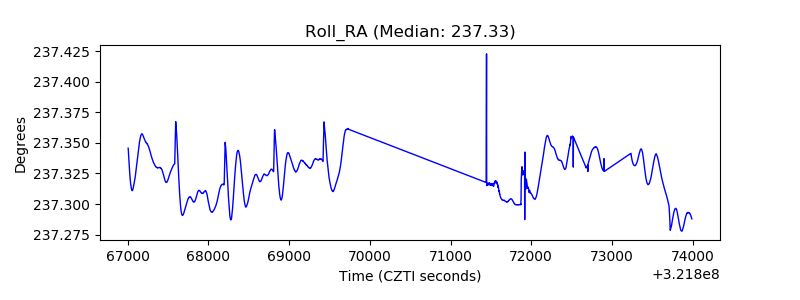 |
| Veto Counter | 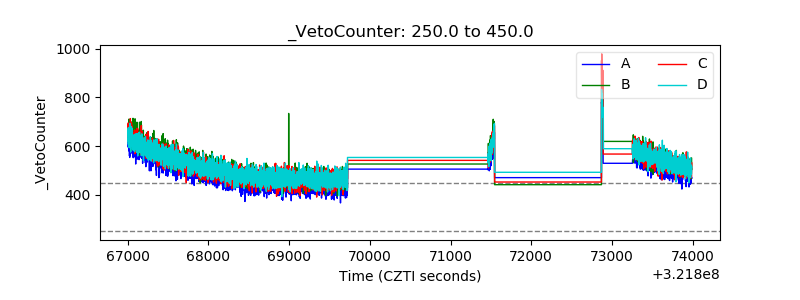 |