| Param | Original file | Final file |
|---|---|---|
| Filename | modeM0/AS1C05_012T04_9000003564_24116cztM0_level2.evt | modeM0/AS1C05_012T04_9000003564_24116cztM0_level2_quad_clean.evt |
| Size (bytes) | 830,865,600 | 215,202,240 |
| Size | 792.4 MB | 205.2 MB |
| Events in quadrant A | 5,079,667 | 1,508,483 |
| Events in quadrant B | 5,327,594 | 1,502,967 |
| Events in quadrant C | 5,147,454 | 1,416,196 |
| Events in quadrant D | 8,915,532 | 1,381,097 |
| Mode SS | |||
|---|---|---|---|
| Quadrant | BADHDUFLAG | Total packets | Discarded packets |
| A | 0 | 210 | 0 |
| B | 0 | 210 | 0 |
| C | 0 | 210 | 0 |
| D | 0 | 210 | 0 |
| Mode M0 | |||
|---|---|---|---|
| Quadrant | BADHDUFLAG | Total packets | Discarded packets |
| A | 0 | 21068 | 2 |
| B | 0 | 21722 | 2 |
| C | 0 | 21486 | 2 |
| D | 0 | 33287 | 2 |
| Mode M9 | |||
|---|---|---|---|
| Quadrant | BADHDUFLAG | Total packets | Discarded packets |
| A | 0 | 25 | 0 |
| B | 0 | 25 | 0 |
| C | 0 | 25 | 0 |
| D | 0 | 25 | 0 |
| Quadrant | Total seconds | Saturated seconds | Saturation percentage |
|---|---|---|---|
| A | 10240 | 123 | 1.201172% |
| B | 10241 | 190 | 1.855288% |
| C | 10241 | 186 | 1.816229% |
| D | 10241 | 573 | 5.595157% |
Noise dominated data is calculated using 1-second bins in cleaned event files. If a bin has >2000 counts, and if more than 50% of those come from <1% of pixels, then it is considered to be noise-dominated and hence unusable.
| Quadrant | # 1 sec bins | Bins with >0 counts | Bins with >2000 counts | High rate bins dominated by noise | Noise dominated (total time) | Noise dominated (detector-on time) | Marked lightcurve |
|---|---|---|---|---|---|---|---|
| A | 12785 | 10241 | 0 | 0 | 0.00% | 0.00% | 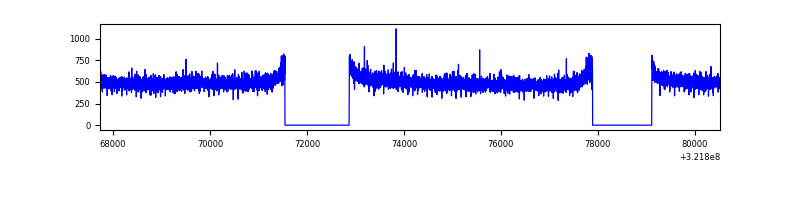 |
| B | 12786 | 10241 | 26 | 26 | 0.20% | 0.25% | 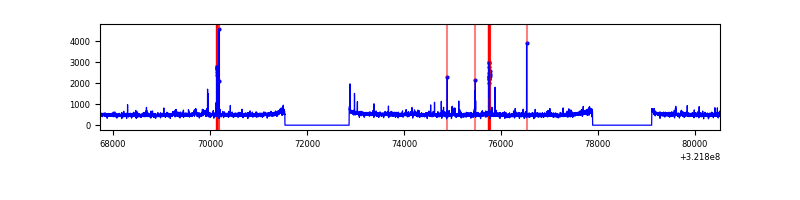 |
| C | 12786 | 10242 | 12 | 12 | 0.09% | 0.12% | 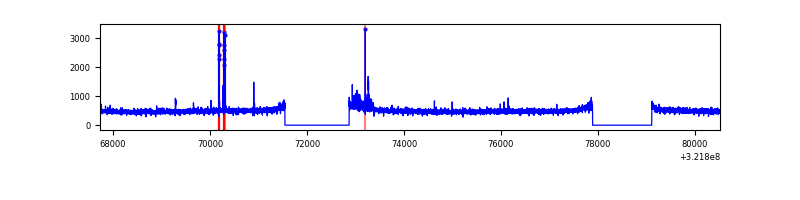 |
| D | 12786 | 10242 | 489 | 489 | 3.82% | 4.77% | 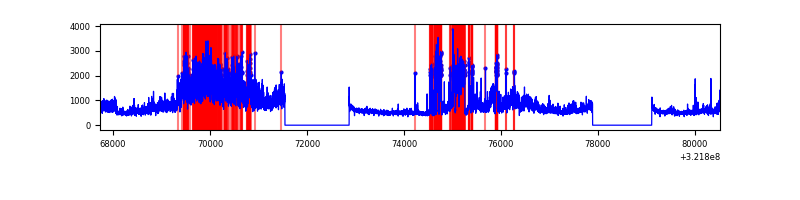 |
Top three noisy pixels from each quadrant. If the there are fewer than three noisy pixels in the level2.evt file, extra rows are filled as -1
| Pixel properties | Quadrant properties | ||||||
|---|---|---|---|---|---|---|---|
| Quadrant | DetID | PixID | Counts | Sigma | Mean | Median | Sigma |
| A | 13 | 254 | 16062 | 56.99 | 1316 | 1294 | 259.1 |
| A | 0 | 226 | 11703 | 40.17 | 1316 | 1294 | 259.1 |
| A | 3 | 137 | 10765 | 36.55 | 1316 | 1294 | 259.1 |
| B | 5 | 172 | 79219 | 332.09 | 1286 | 1260 | 234.8 |
| B | 4 | 171 | 38301 | 157.79 | 1286 | 1260 | 234.8 |
| B | 0 | 245 | 35522 | 145.95 | 1286 | 1260 | 234.8 |
| C | 14 | 238 | 201067 | 713.11 | 1229 | 1239 | 280.2 |
| C | 0 | 239 | 118462 | 418.33 | 1229 | 1239 | 280.2 |
| C | 7 | 247 | 21901 | 73.74 | 1229 | 1239 | 280.2 |
| D | 8 | 195 | 3144397 | 10495.56 | 1259 | 1223 | 299.5 |
| D | 1 | 52 | 900146 | 3001.65 | 1259 | 1223 | 299.5 |
| D | 12 | 233 | 44486 | 144.46 | 1259 | 1223 | 299.5 |
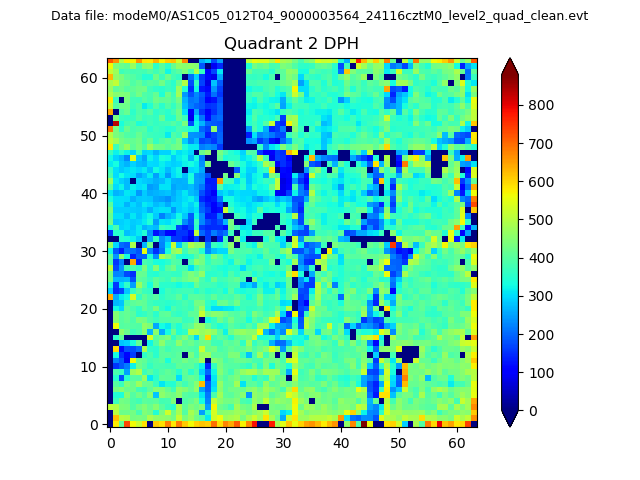
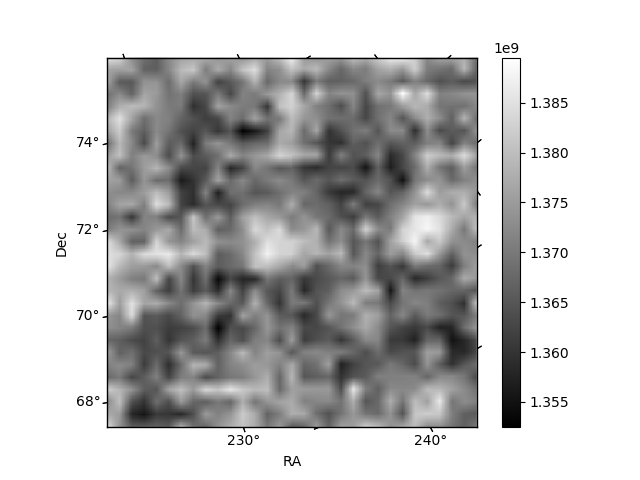
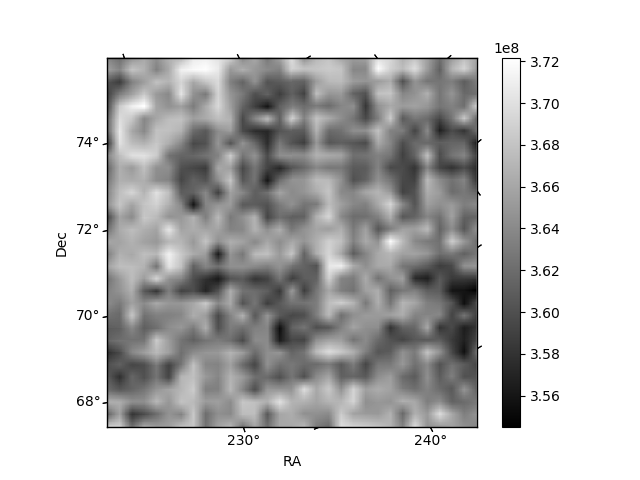
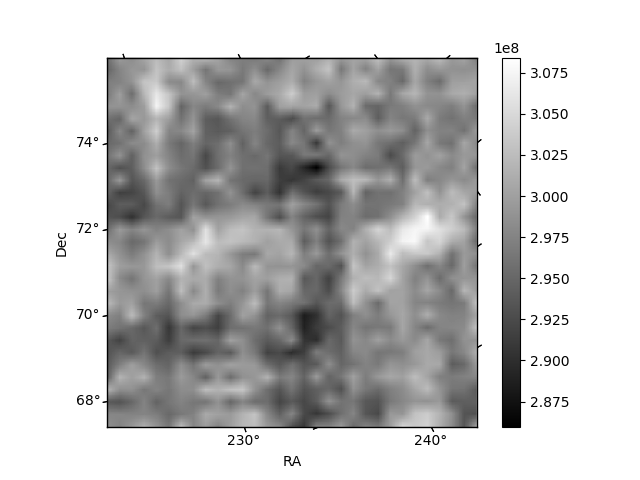
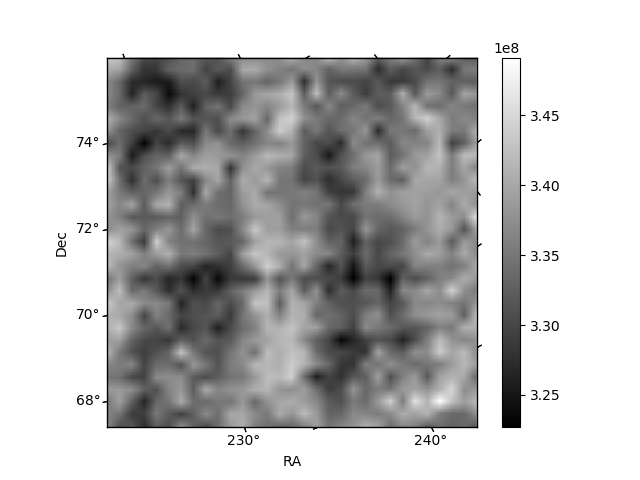
Histogram calculated using DETX and DETY for each event in the final _common_clean file
| Quadrant A | 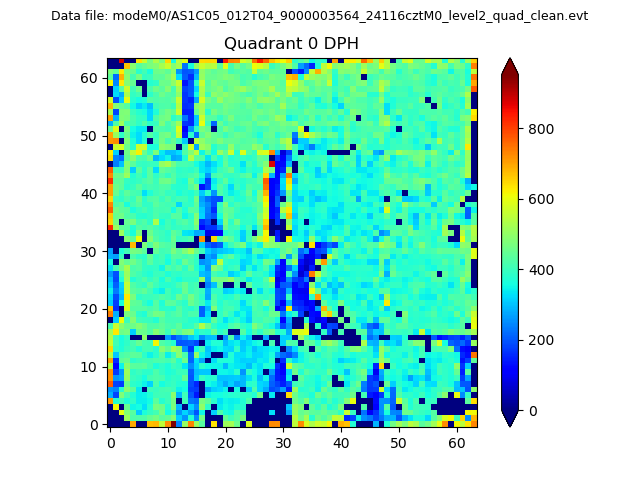 |
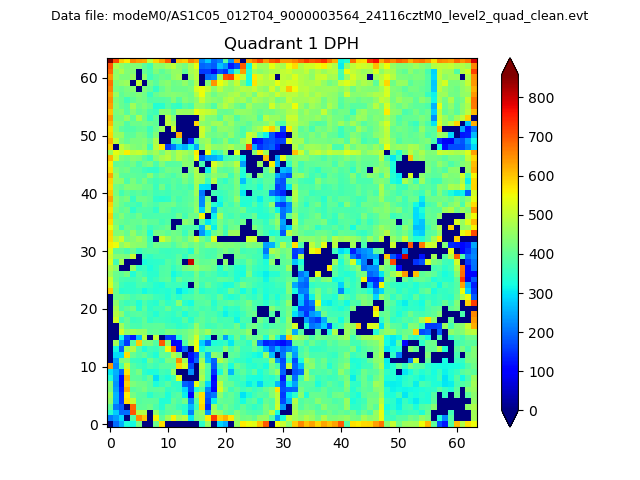 |
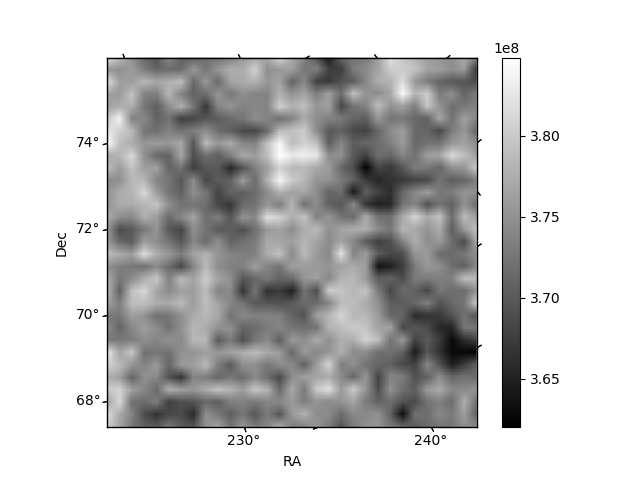
Quadrant B |
|---|---|---|---|
| Quadrant D | 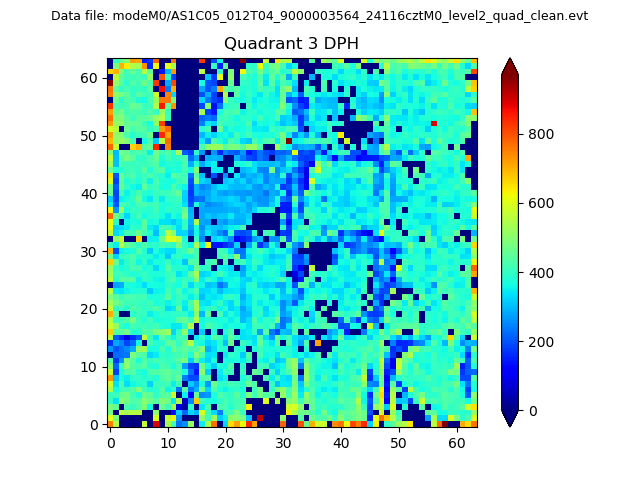 |
 |
Quadrant C |
| Plot type | Count rate plots | Images |
|---|---|---|
| Comparison with Poisson distribution Blue bars denote a histogram of data divided into 1 sec bins. Red curve is a Poisson curve with rate = median count rate of data. |
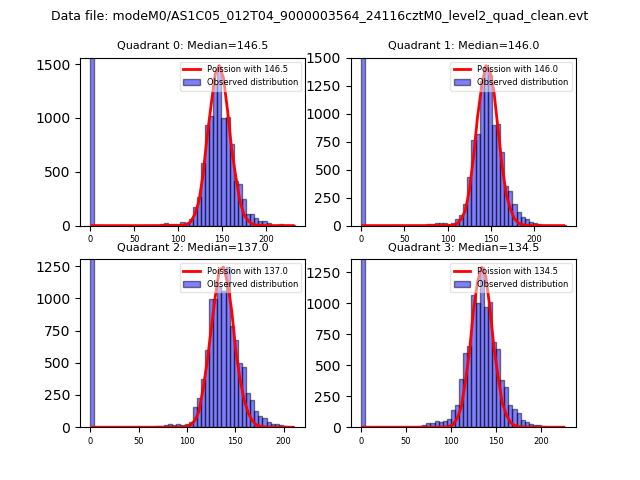 |
 |
| Quadrant-wise count rates Data is divided into 100 sec bins |
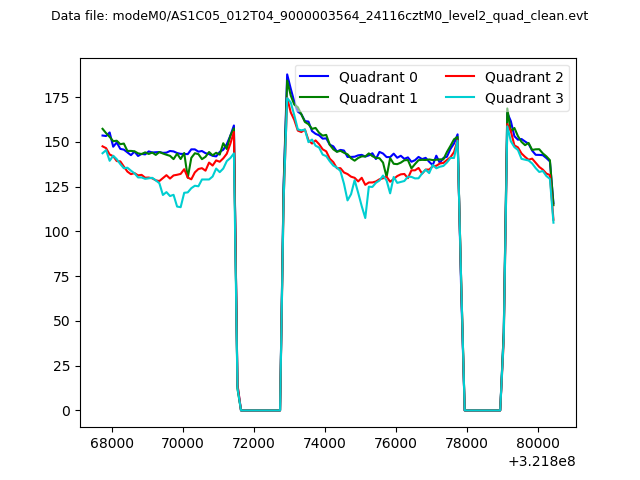 |
|
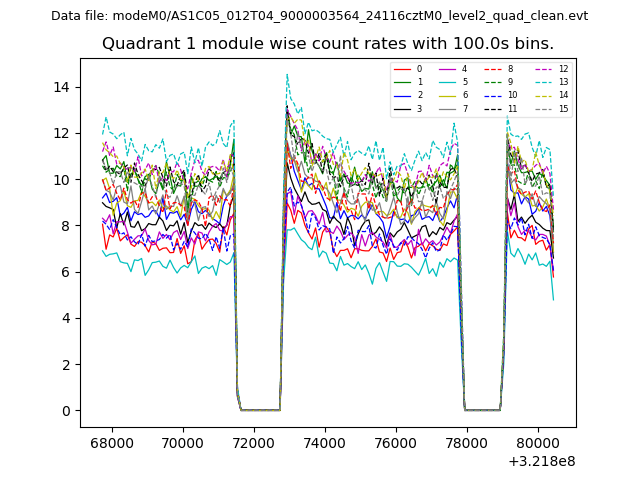
| Module-wise count rates for Quadrant A Data is divided into 100 sec bins |
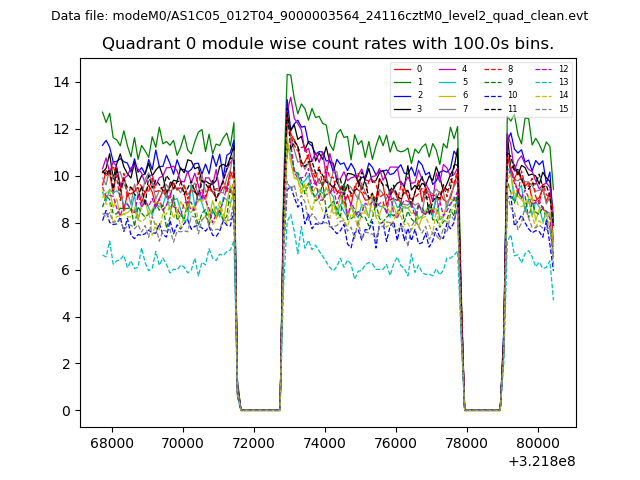 |
 |
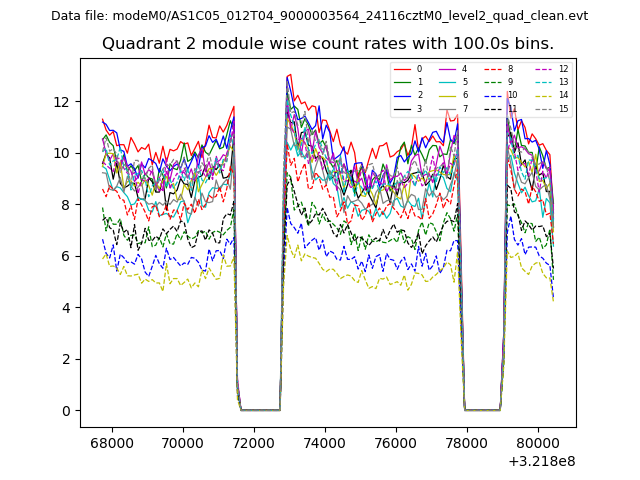
| Module-wise count rates for Quadrant B Data is divided into 100 sec bins |
 |
 |
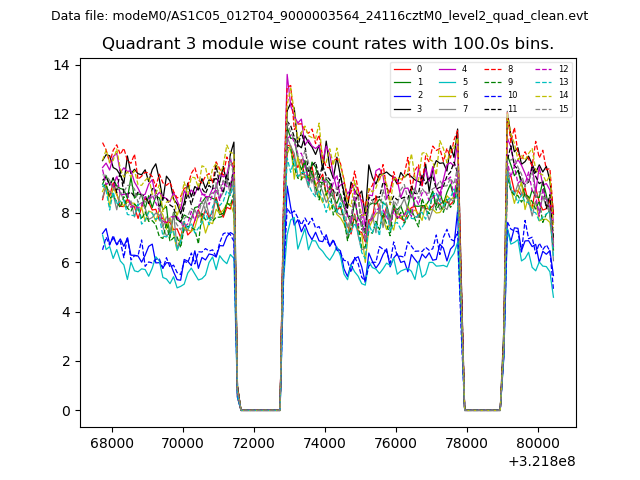
| Module-wise count rates for Quadrant C Data is divided into 100 sec bins |
 |
 |
| Module-wise count rates for Quadrant D Data is divided into 100 sec bins |
 |
 |
| Parameter | Plot |
|---|---|
| CZT HV Monitor | 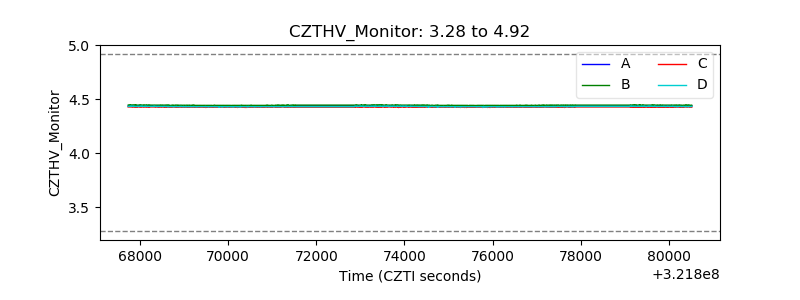 |
| D_VDD | 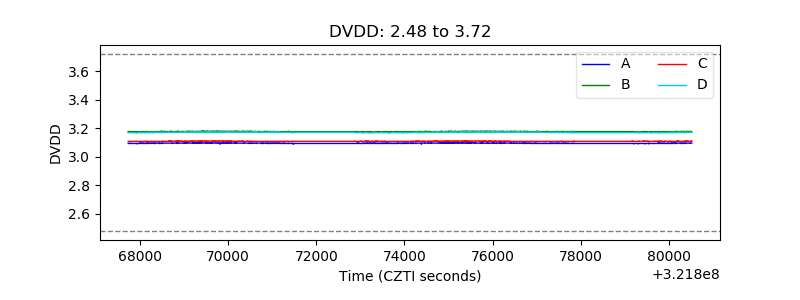 |
| Temperature 1 | 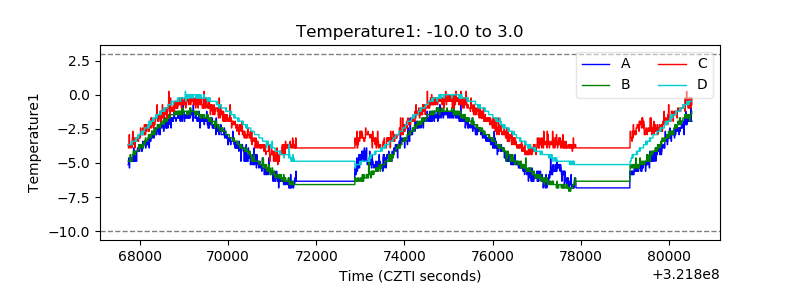 |
| Veto HV Monitor | 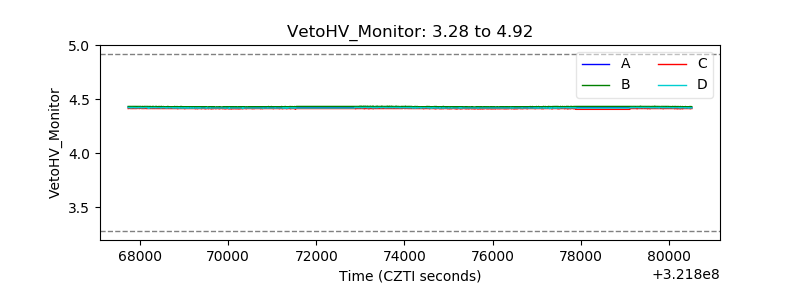 |
| Veto LLD | 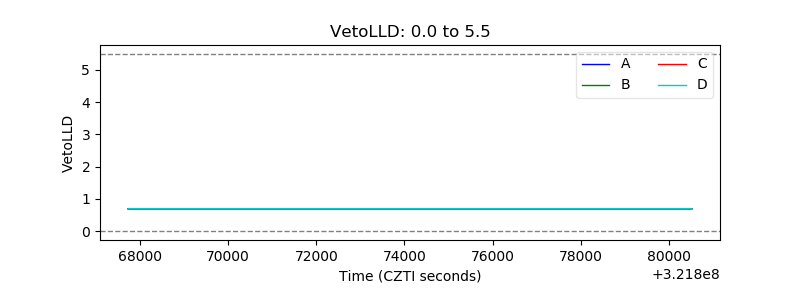 |
| Alpha Counter | 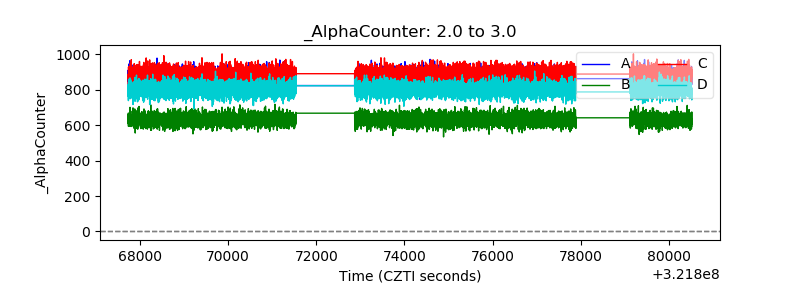 |
| _CPM_Rate | 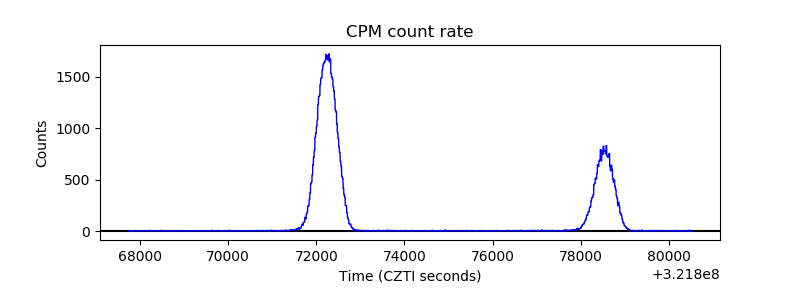 |
| CZT Counter | 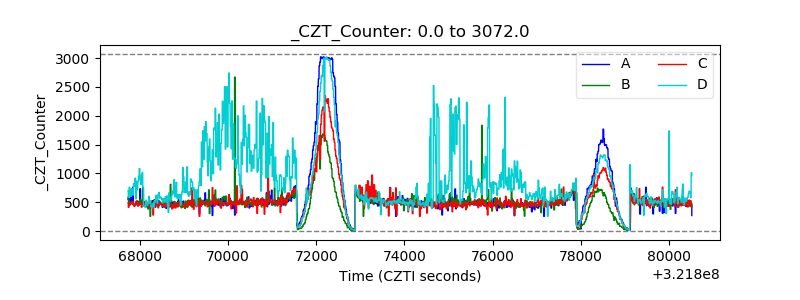 |
| +2.5 Volts monitor |  |
| +5 Volts monitor |  |
| _ROLL_ROT | 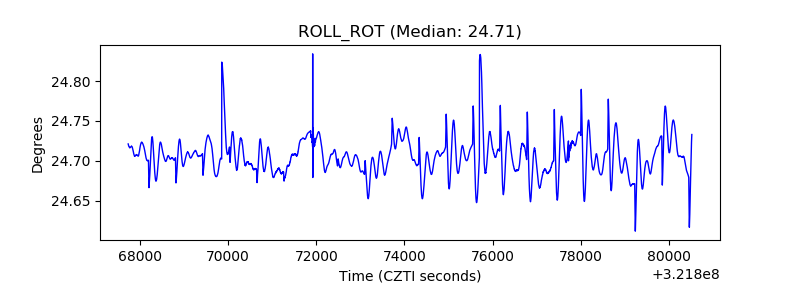 |
| _Roll_DEC | 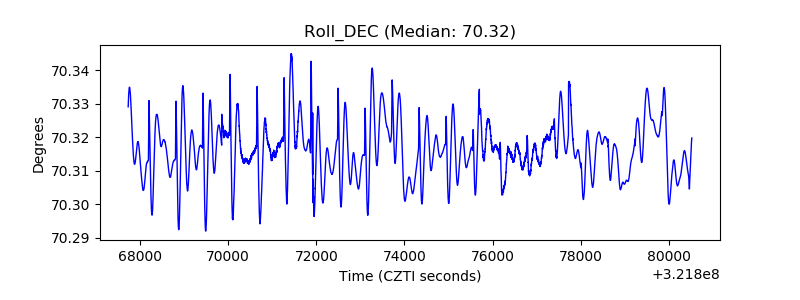 |
| _Roll_RA | 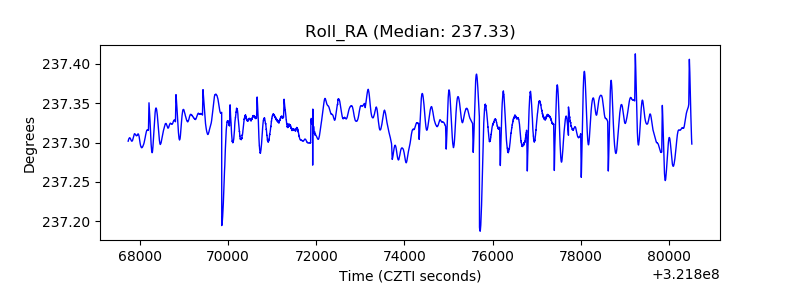 |
| Veto Counter | 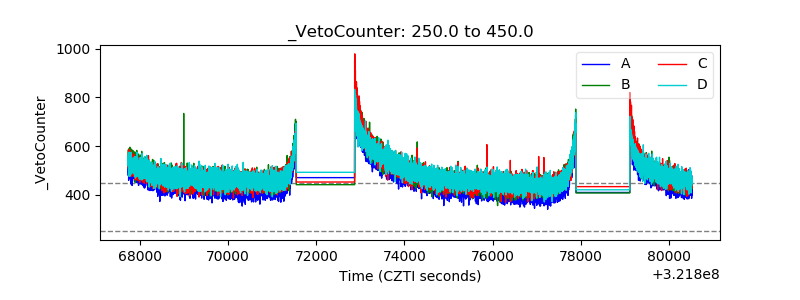 |