| Param | Original file | Final file |
|---|---|---|
| Filename | modeM0/AS1C05_012T04_9000003564_24117cztM0_level2.evt | modeM0/AS1C05_012T04_9000003564_24117cztM0_level2_quad_clean.evt |
| Size (bytes) | 489,663,360 | 125,524,800 |
| Size | 467.0 MB | 119.7 MB |
| Events in quadrant A | 3,026,833 | 865,343 |
| Events in quadrant B | 3,132,680 | 869,720 |
| Events in quadrant C | 3,048,440 | 823,835 |
| Events in quadrant D | 5,190,911 | 800,234 |
| Mode SS | |||
|---|---|---|---|
| Quadrant | BADHDUFLAG | Total packets | Discarded packets |
| A | 0 | 128 | 0 |
| B | 0 | 128 | 0 |
| C | 0 | 128 | 0 |
| D | 0 | 128 | 0 |
| Mode M0 | |||
|---|---|---|---|
| Quadrant | BADHDUFLAG | Total packets | Discarded packets |
| A | 0 | 12976 | 1 |
| B | 0 | 13168 | 1 |
| C | 0 | 12986 | 1 |
| D | 0 | 19727 | 1 |
| Mode M9 | |||
|---|---|---|---|
| Quadrant | BADHDUFLAG | Total packets | Discarded packets |
| A | 0 | 9 | 0 |
| B | 0 | 9 | 0 |
| C | 0 | 9 | 0 |
| D | 0 | 9 | 0 |
| Quadrant | Total seconds | Saturated seconds | Saturation percentage |
|---|---|---|---|
| A | 6345 | 110 | 1.733649% |
| B | 6345 | 122 | 1.922774% |
| C | 6346 | 126 | 1.985503% |
| D | 6346 | 163 | 2.568547% |
Noise dominated data is calculated using 1-second bins in cleaned event files. If a bin has >2000 counts, and if more than 50% of those come from <1% of pixels, then it is considered to be noise-dominated and hence unusable.
| Quadrant | # 1 sec bins | Bins with >0 counts | Bins with >2000 counts | High rate bins dominated by noise | Noise dominated (total time) | Noise dominated (detector-on time) | Marked lightcurve |
|---|---|---|---|---|---|---|---|
| A | 7265 | 6345 | 0 | 0 | 0.00% | 0.00% | 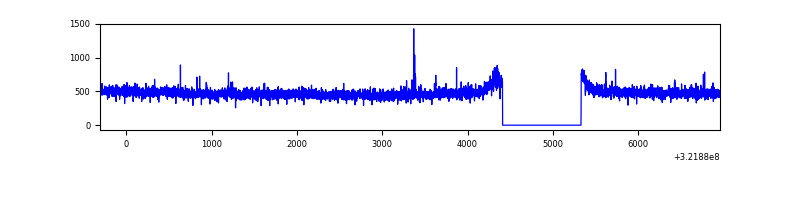 |
| B | 7265 | 6345 | 3 | 3 | 0.04% | 0.05% | 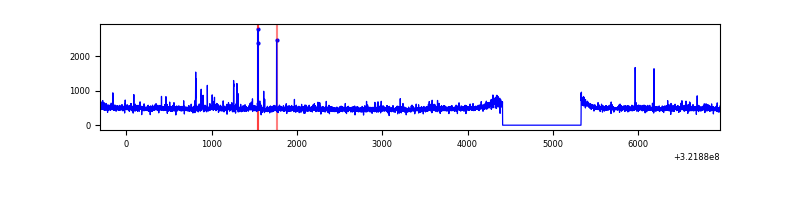 |
| C | 7266 | 6346 | 0 | 0 | 0.00% | 0.00% | 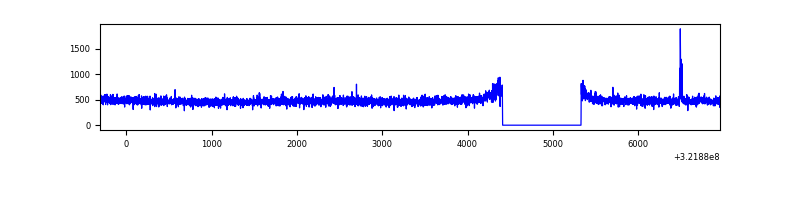 |
| D | 7266 | 6346 | 105 | 105 | 1.45% | 1.65% | 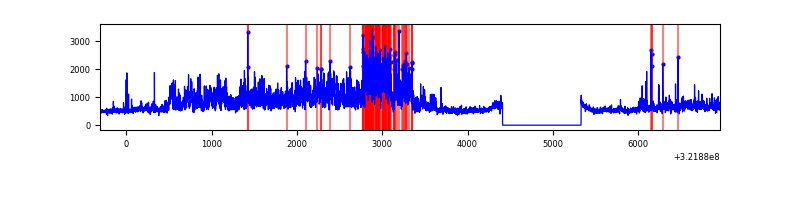 |
Top three noisy pixels from each quadrant. If the there are fewer than three noisy pixels in the level2.evt file, extra rows are filled as -1
| Pixel properties | Quadrant properties | ||||||
|---|---|---|---|---|---|---|---|
| Quadrant | DetID | PixID | Counts | Sigma | Mean | Median | Sigma |
| A | 2 | 250 | 14940 | 92.06 | 778 | 764 | 154.0 |
| A | 14 | 254 | 10109 | 60.69 | 778 | 764 | 154.0 |
| A | 13 | 254 | 9929 | 59.52 | 778 | 764 | 154.0 |
| B | 0 | 228 | 22194 | 149.22 | 768 | 749 | 143.7 |
| B | 4 | 171 | 20010 | 134.02 | 768 | 749 | 143.7 |
| B | 0 | 190 | 18895 | 126.26 | 768 | 749 | 143.7 |
| C | 14 | 238 | 118388 | 692.31 | 738 | 742 | 169.9 |
| C | 7 | 247 | 24037 | 137.08 | 738 | 742 | 169.9 |
| C | 3 | 233 | 20376 | 115.54 | 738 | 742 | 169.9 |
| D | 8 | 195 | 2144049 | 11801.4 | 754 | 729 | 181.6 |
| D | 1 | 52 | 66106 | 359.97 | 754 | 729 | 181.6 |
| D | 13 | 104 | 47073 | 255.18 | 754 | 729 | 181.6 |
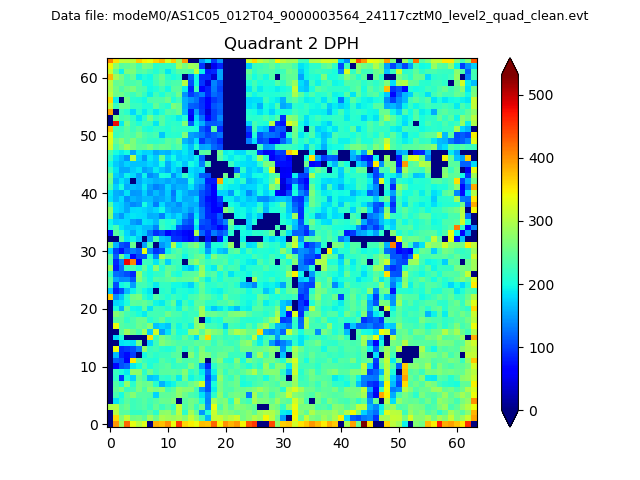
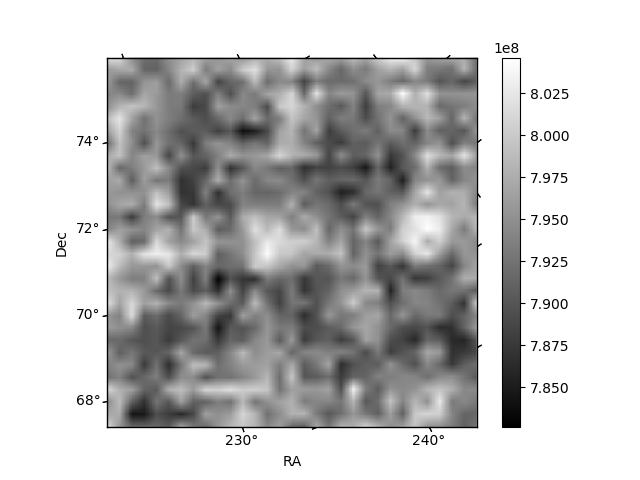
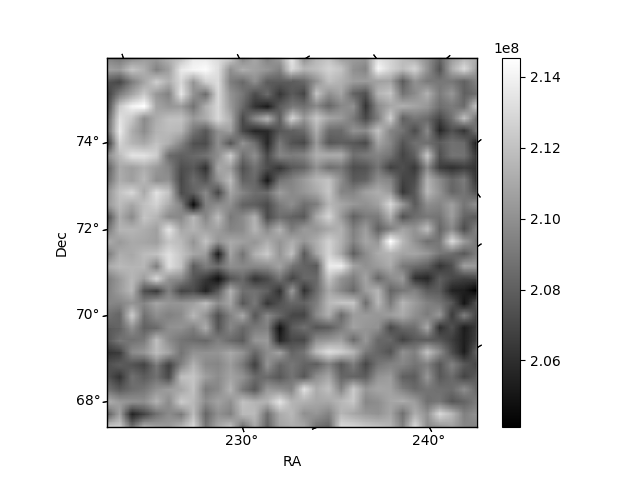
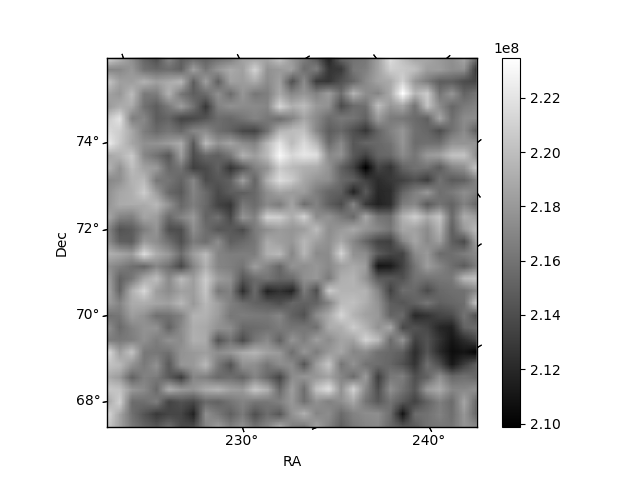
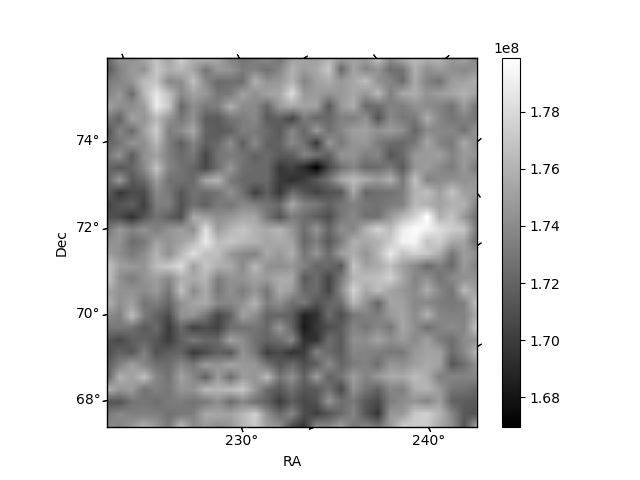
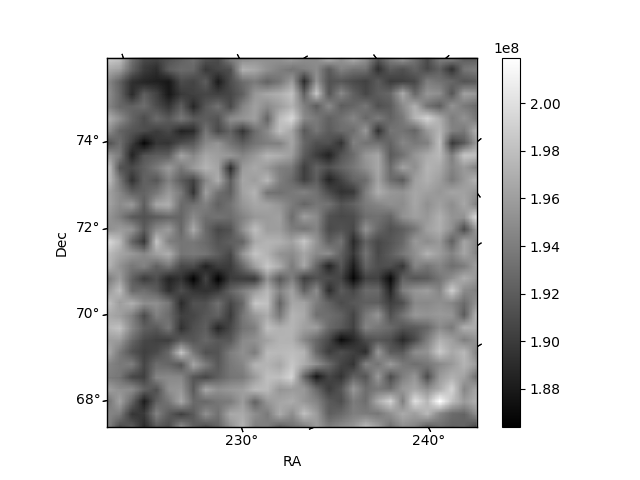
Histogram calculated using DETX and DETY for each event in the final _common_clean file
| Quadrant A | 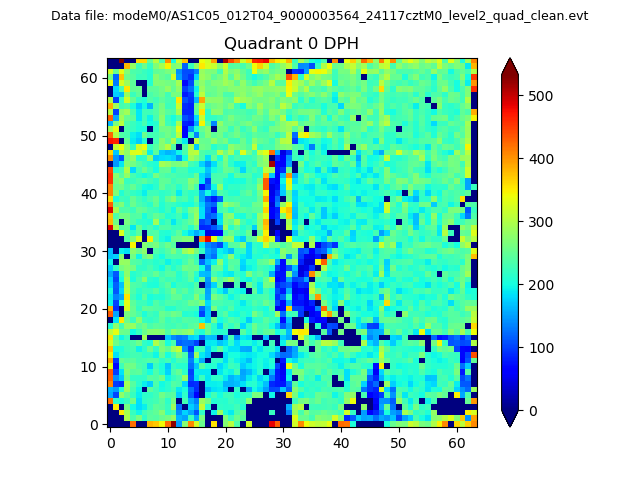 |
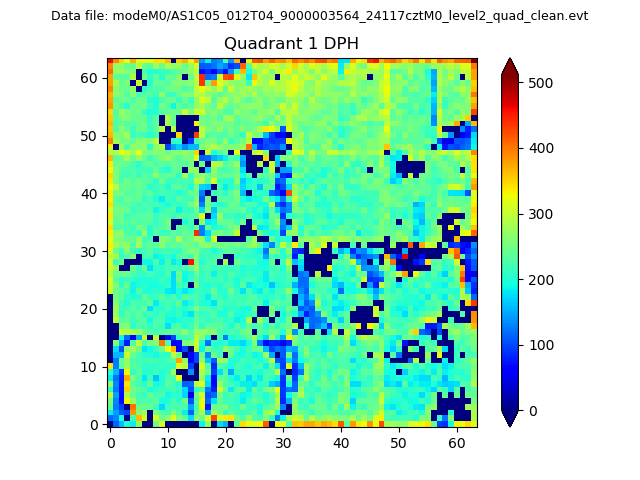 |
Quadrant B |
|---|---|---|---|
| Quadrant D | 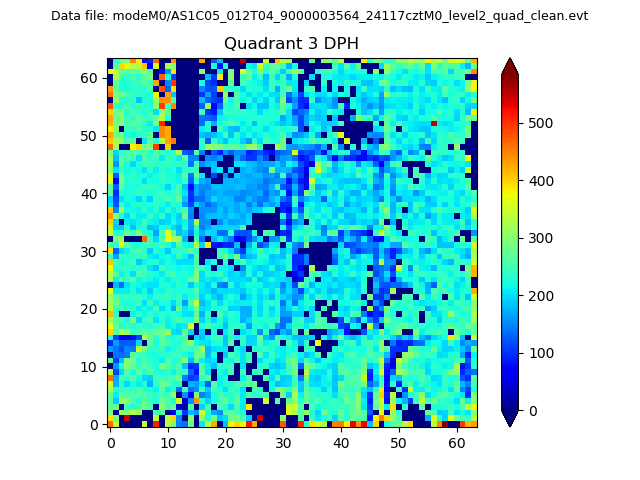 |
 |
Quadrant C |
| Plot type | Count rate plots | Images |
|---|---|---|
| Comparison with Poisson distribution Blue bars denote a histogram of data divided into 1 sec bins. Red curve is a Poisson curve with rate = median count rate of data. |
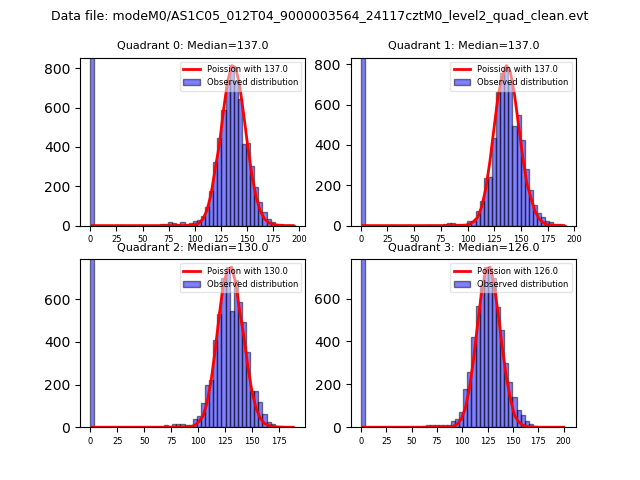 |
 |
| Quadrant-wise count rates Data is divided into 100 sec bins |
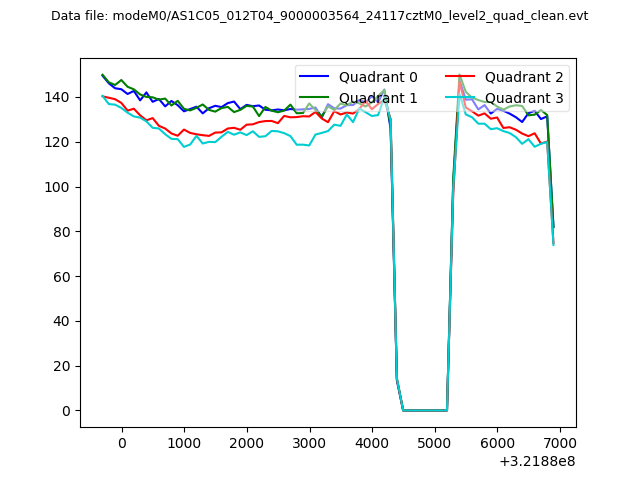 |
|
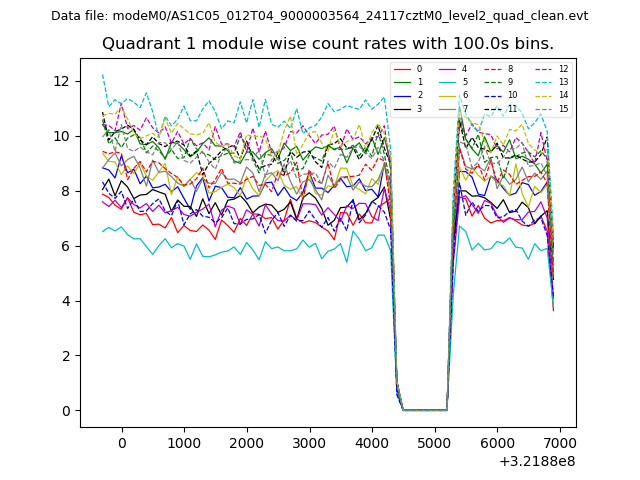
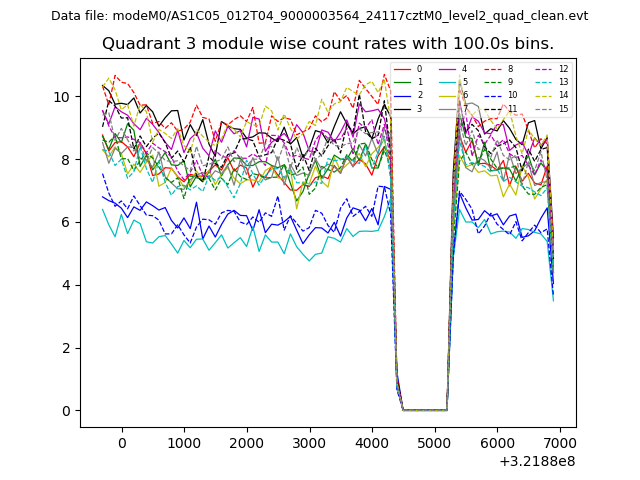
| Module-wise count rates for Quadrant A Data is divided into 100 sec bins |
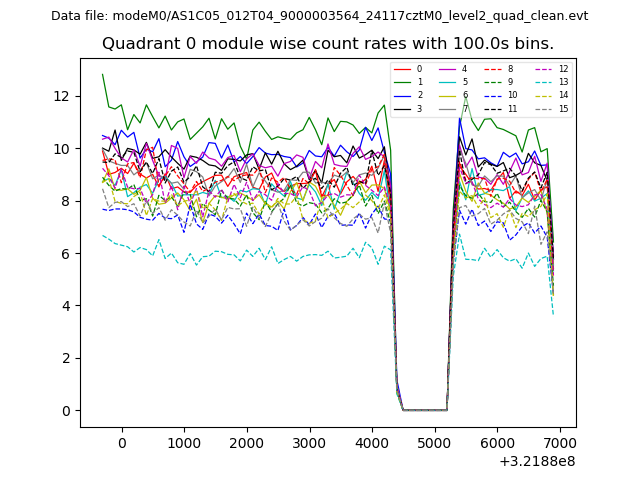 |
 |
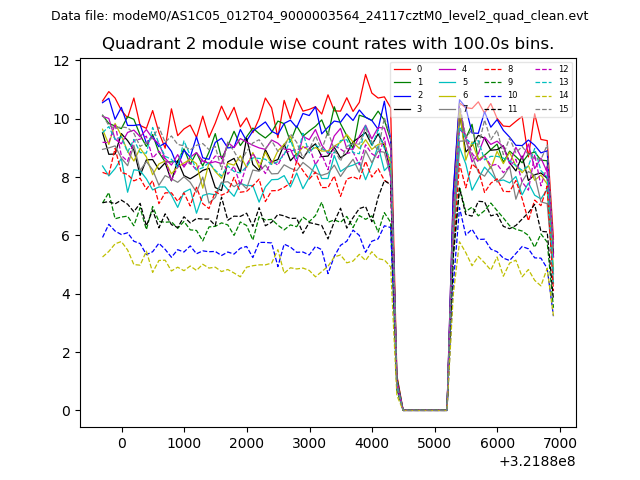
| Module-wise count rates for Quadrant B Data is divided into 100 sec bins |
 |
 |
| Module-wise count rates for Quadrant C Data is divided into 100 sec bins |
 |
 |
| Module-wise count rates for Quadrant D Data is divided into 100 sec bins |
 |
 |
| Parameter | Plot |
|---|---|
| CZT HV Monitor | 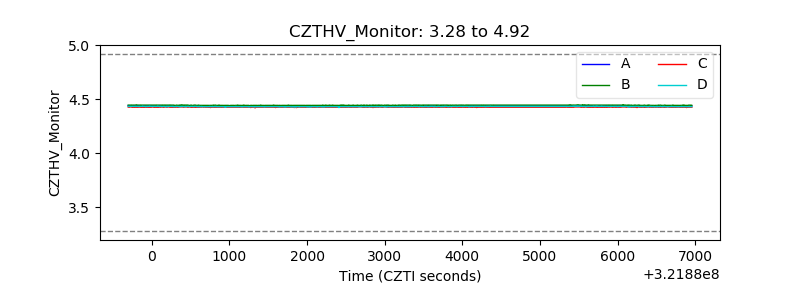 |
| D_VDD | 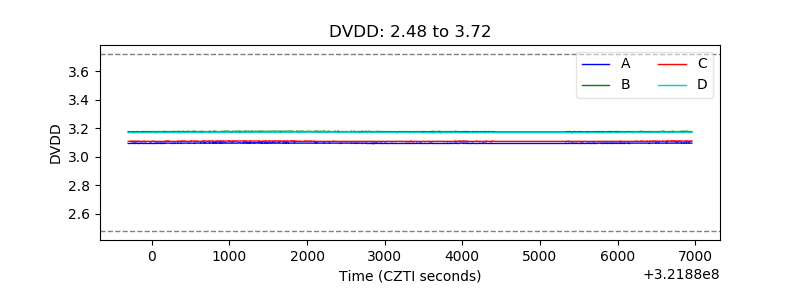 |
| Temperature 1 | 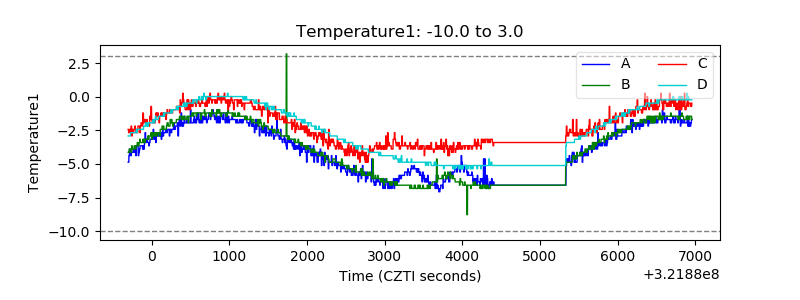 |
| Veto HV Monitor | 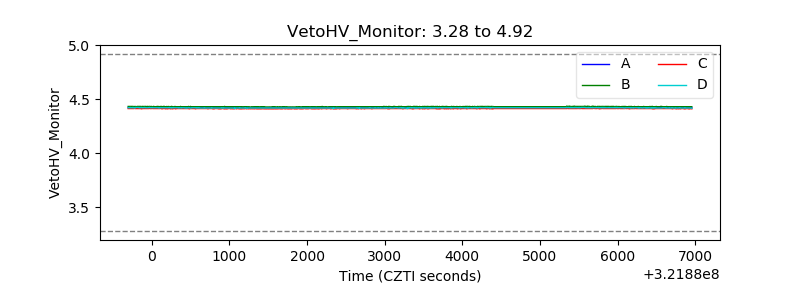 |
| Veto LLD | 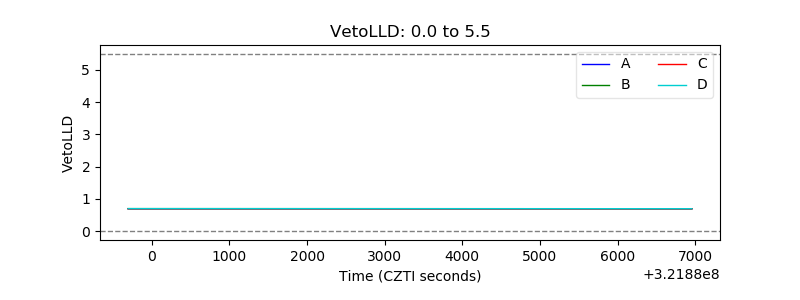 |
| Alpha Counter | 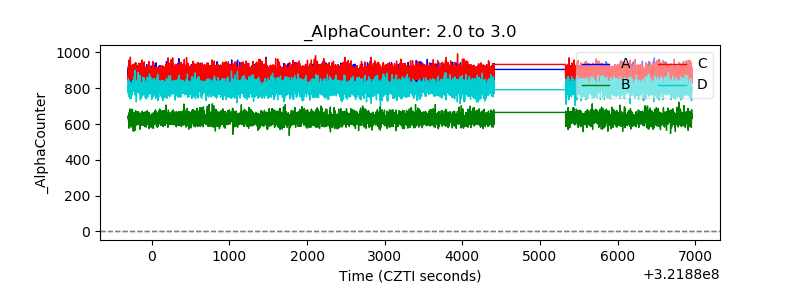 |
| _CPM_Rate | 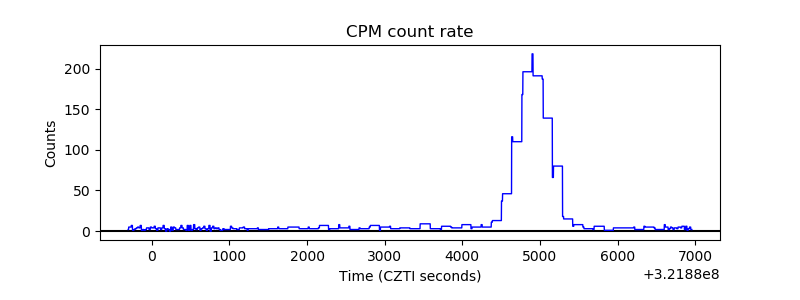 |
| CZT Counter | 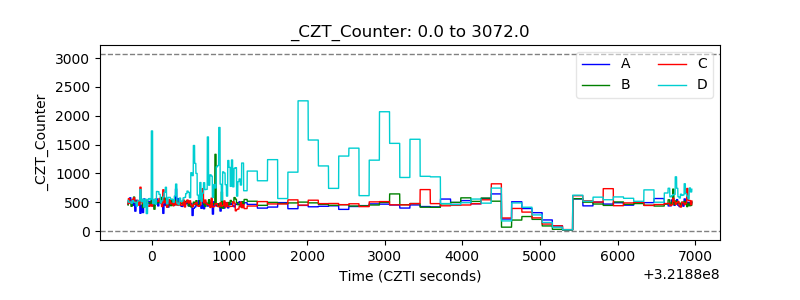 |
| +2.5 Volts monitor | 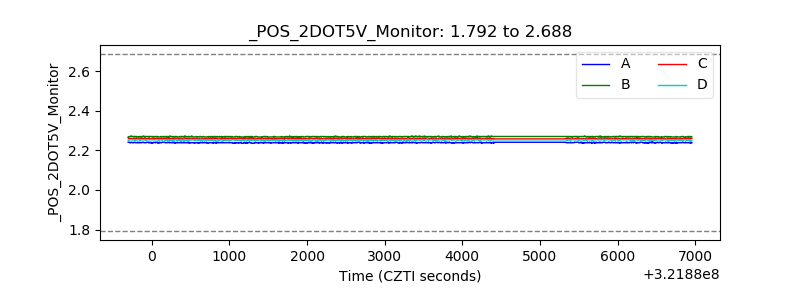 |
| +5 Volts monitor |  |
| _ROLL_ROT | 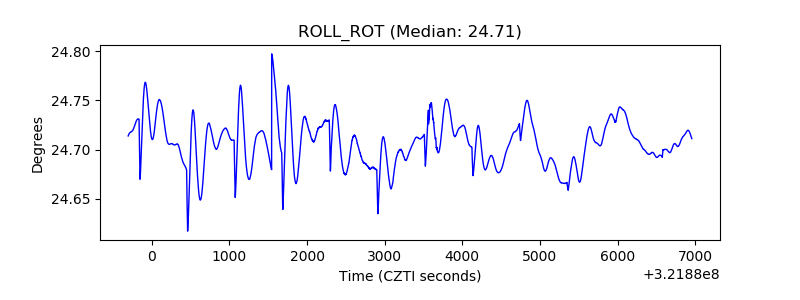 |
| _Roll_DEC | 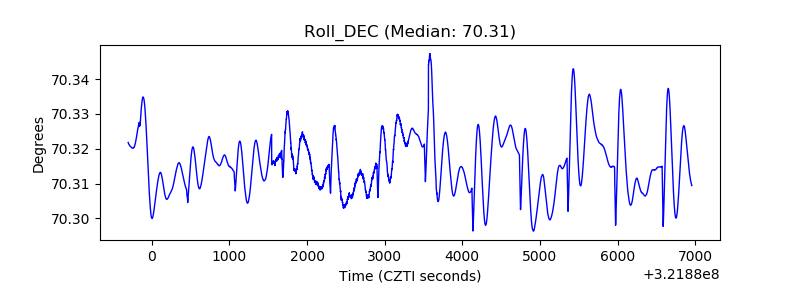 |
| _Roll_RA | 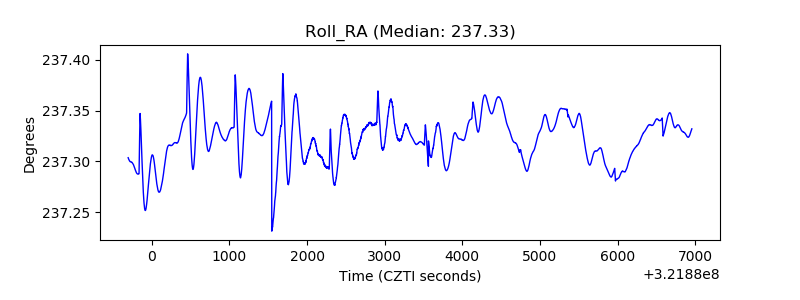 |
| Veto Counter | 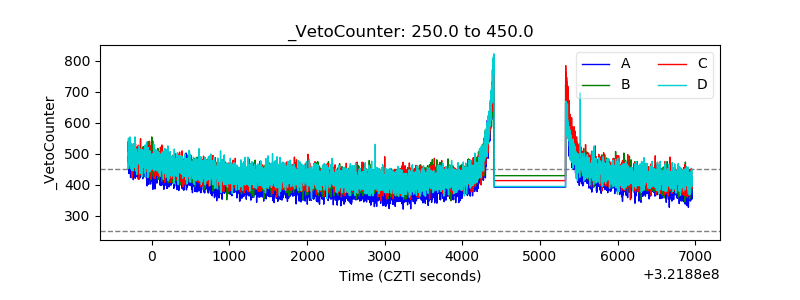 |