| Param | Original file | Final file |
|---|---|---|
| Filename | modeM0/AS1A07_069T01_9000003570cztM0_level2.fits | modeM0/AS1A07_069T01_9000003570cztM0_level2_quad_clean.evt |
| Size (bytes) | 1,046,139,840 | 736,202,880 |
| Size | 997.7 MB | 702.1 MB |
| Events in quadrant A | 6,737,636 | 4,150,727 |
| Events in quadrant B | 6,319,260 | 4,065,216 |
| Events in quadrant C | 6,356,810 | 3,876,599 |
| Events in quadrant D | 5,268,112 | 3,204,491 |
| Mode SS | |||
|---|---|---|---|
| Quadrant | BADHDUFLAG | Total packets | Discarded packets |
| A | 0 | 2074 | 0 |
| B | 0 | 2074 | 0 |
| C | 0 | 2074 | 0 |
| D | 0 | 2074 | 0 |
| Mode M0 | |||
|---|---|---|---|
| Quadrant | BADHDUFLAG | Total packets | Discarded packets |
| A | 0 | 216357 | 0 |
| B | 0 | 237381 | 0 |
| C | 0 | 221515 | 0 |
| D | 0 | 326854 | 0 |
| Mode M9 | |||
|---|---|---|---|
| Quadrant | BADHDUFLAG | Total packets | Discarded packets |
| A | 0 | 184 | 0 |
| B | 0 | 184 | 0 |
| C | 0 | 184 | 0 |
| D | 0 | 184 | 0 |
| Quadrant | Total seconds | Saturated seconds | Saturation percentage |
|---|---|---|---|
| A | 102057 | 1335 | 1.308093% |
| B | 102057 | 4679 | 4.584693% |
| C | 102057 | 2169 | 2.125283% |
| D | 102057 | 13370 | 13.100522% |
Noise dominated data is calculated using 1-second bins in cleaned event files. If a bin has >2000 counts, and if more than 50% of those come from <1% of pixels, then it is considered to be noise-dominated and hence unusable.
| Quadrant | # 1 sec bins | Bins with >0 counts | Bins with >2000 counts | High rate bins dominated by noise | Noise dominated (total time) | Noise dominated (detector-on time) | Marked lightcurve |
|---|---|---|---|---|---|---|---|
| A | 120253 | 102048 | 0 | 0 | 0.00% | 0.00% | 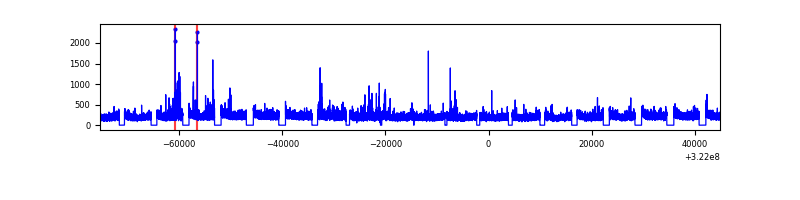 |
| B | 120253 | 101923 | 0 | 0 | 0.00% | 0.00% | 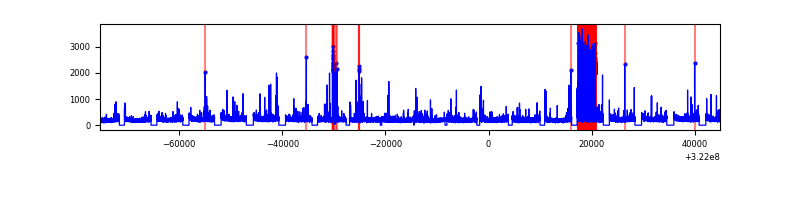 |
| C | 120253 | 102049 | 0 | 0 | 0.00% | 0.00% | 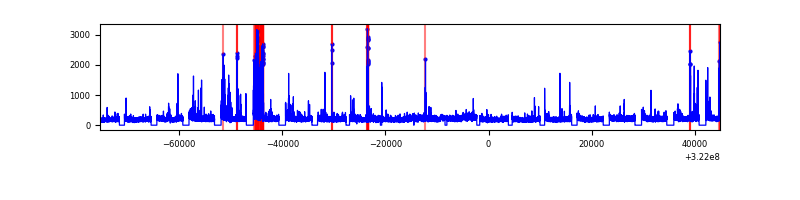 |
| D | 120253 | 101591 | 0 | 0 | 0.00% | 0.00% | 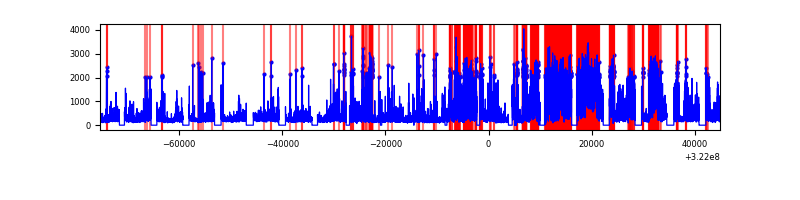 |
Top three noisy pixels from each quadrant. If the there are fewer than three noisy pixels in the level2.evt file, extra rows are filled as -1
| Pixel properties | Quadrant properties | ||||||
|---|---|---|---|---|---|---|---|
| Quadrant | DetID | PixID | Counts | Sigma | Mean | Median | Sigma |
| A | 0 | 29 | 6371 | 11.22 | 1752 | 1651 | 420.6 |
| A | 7 | 110 | 5425 | 8.97 | 1752 | 1651 | 420.6 |
| A | 9 | 19 | 5026 | 8.02 | 1752 | 1651 | 420.6 |
| B | 2 | 9 | 4824 | 9.82 | 1675 | 1605 | 327.7 |
| B | 3 | 80 | 4125 | 7.69 | 1675 | 1605 | 327.7 |
| B | 2 | 8 | 4077 | 7.54 | 1675 | 1605 | 327.7 |
| C | 1 | 81 | 4743 | 7.47 | 1678 | 1573 | 424.5 |
| C | 1 | 80 | 4687 | 7.34 | 1678 | 1573 | 424.5 |
| C | 12 | 241 | 4366 | 6.58 | 1678 | 1573 | 424.5 |
| D | 3 | 14 | 3804 | 6.13 | 1503 | 1369 | 397.1 |
| D | 10 | 189 | 3763 | 6.03 | 1503 | 1369 | 397.1 |
| D | 7 | 3 | 3695 | 5.86 | 1503 | 1369 | 397.1 |
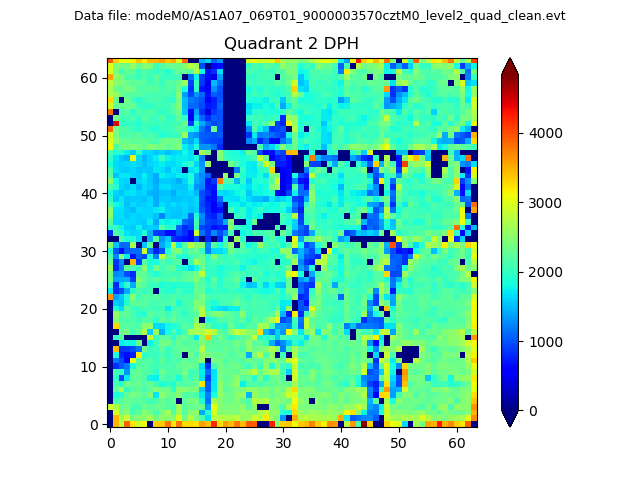
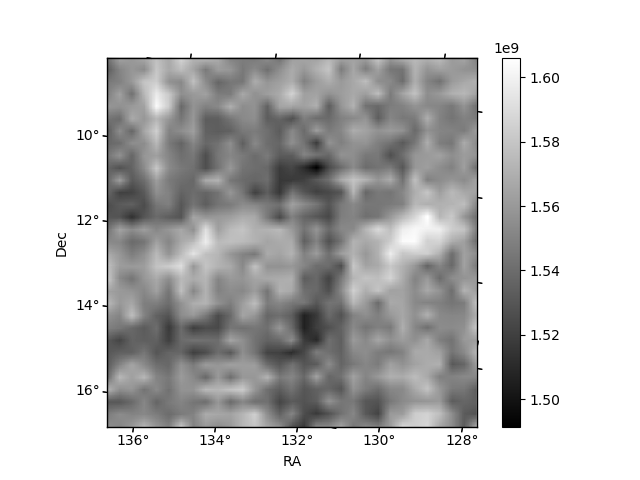
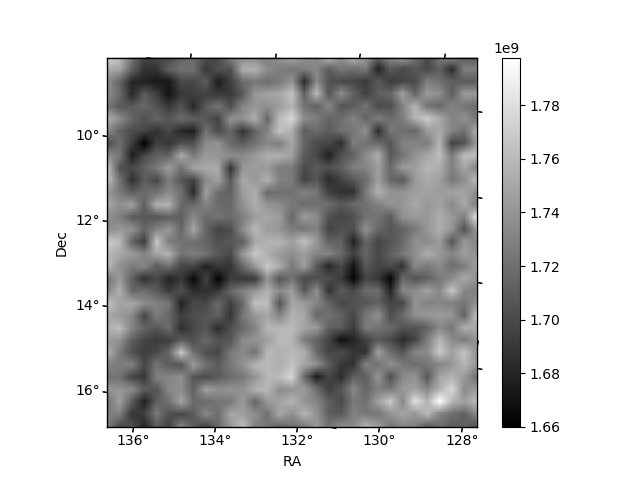
Histogram calculated using DETX and DETY for each event in the final _common_clean file
| Quadrant A | 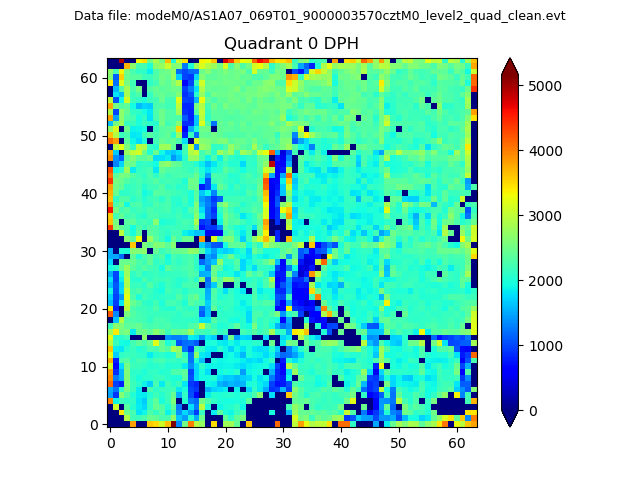 |
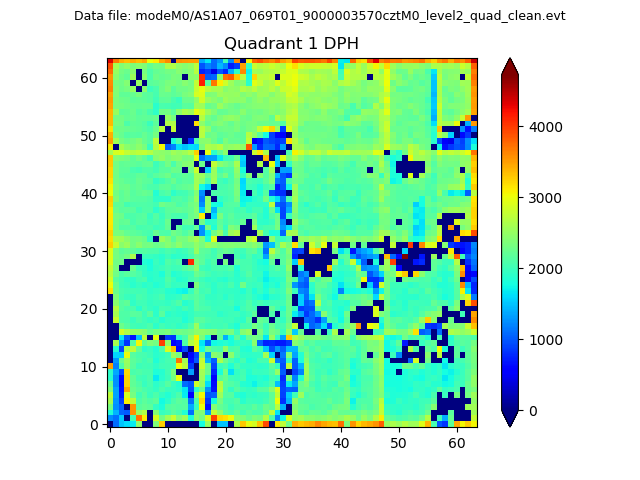 |
Quadrant B |
|---|---|---|---|
| Quadrant D | 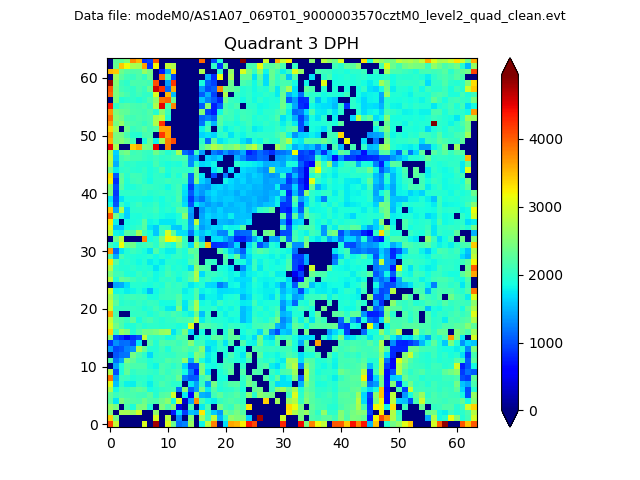 |
 |
Quadrant C |
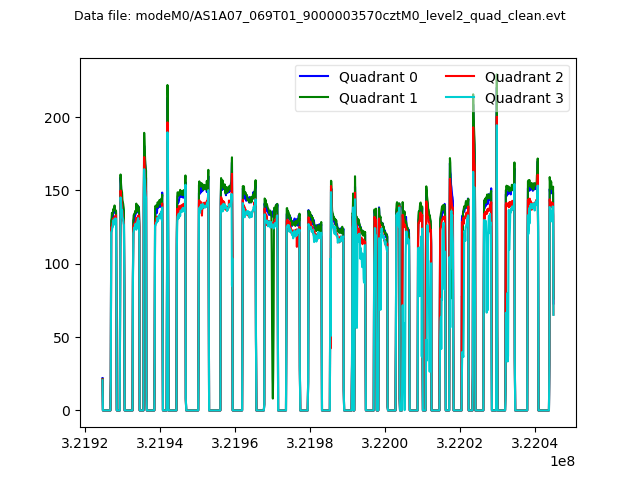
| Plot type | Count rate plots | Images |
|---|---|---|
| Comparison with Poisson distribution Blue bars denote a histogram of data divided into 1 sec bins. Red curve is a Poisson curve with rate = median count rate of data. |
 |
 |
| Quadrant-wise count rates Data is divided into 100 sec bins |
 |
|
| Module-wise count rates for Quadrant A Data is divided into 100 sec bins |
 |
 |
| Module-wise count rates for Quadrant B Data is divided into 100 sec bins |
 |
 |
| Module-wise count rates for Quadrant C Data is divided into 100 sec bins |
 |
 |
| Module-wise count rates for Quadrant D Data is divided into 100 sec bins |
 |
 |
| Parameter | Plot |
|---|---|
| CZT HV Monitor | 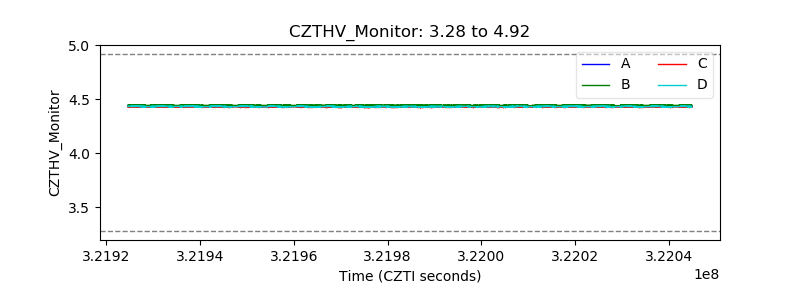 |
| D_VDD | 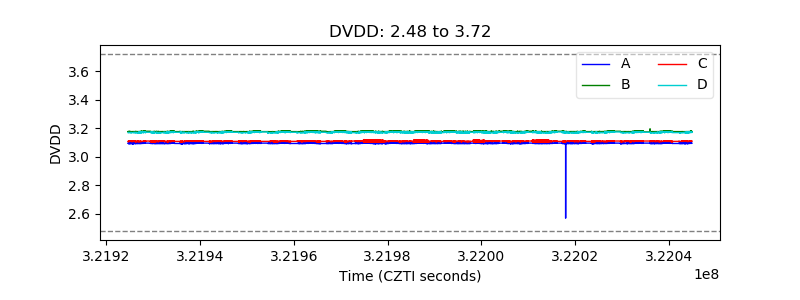 |
| Temperature 1 |  |
| Veto HV Monitor |  |
| Veto LLD | 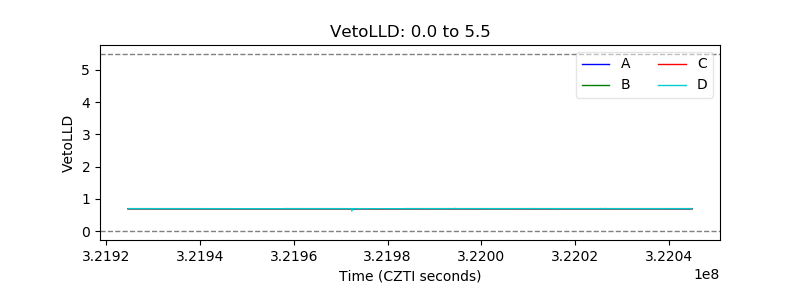 |
| Alpha Counter | 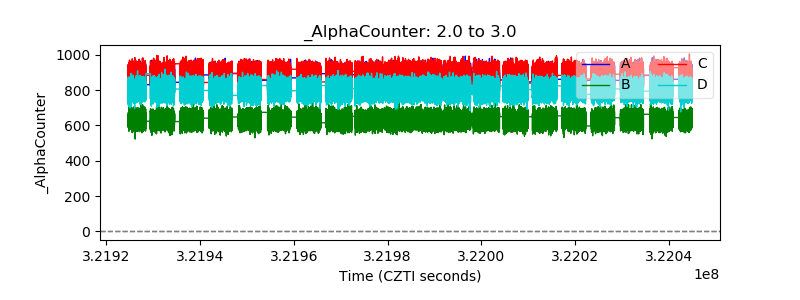 |
| _CPM_Rate | 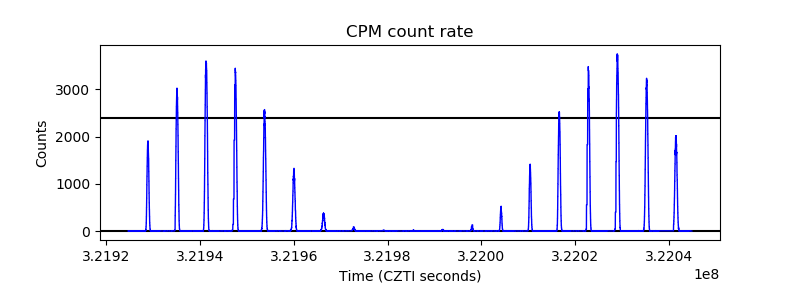 |
| CZT Counter | 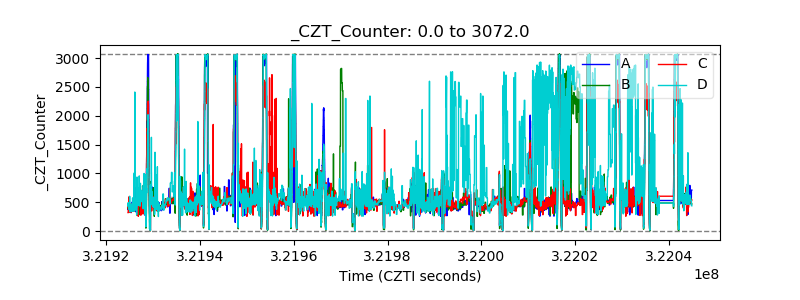 |
| +2.5 Volts monitor |  |
| +5 Volts monitor | 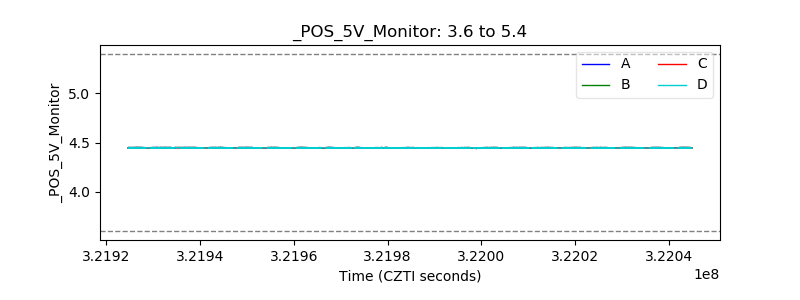 |
| _ROLL_ROT | 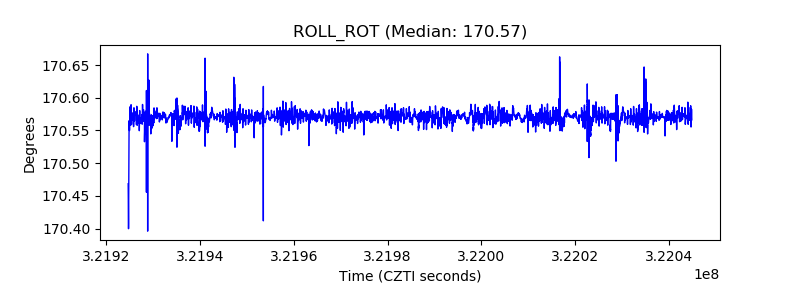 |
| _Roll_DEC |  |
| _Roll_RA | 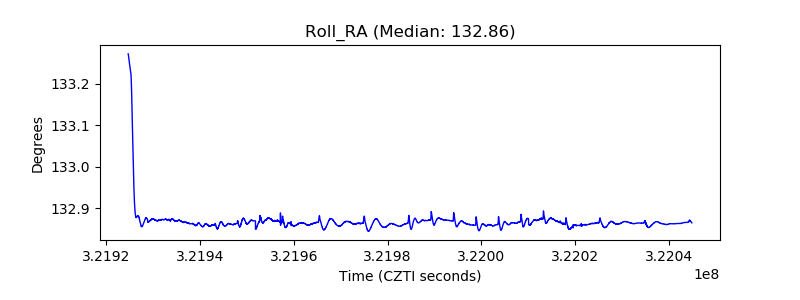 |
| Veto Counter | 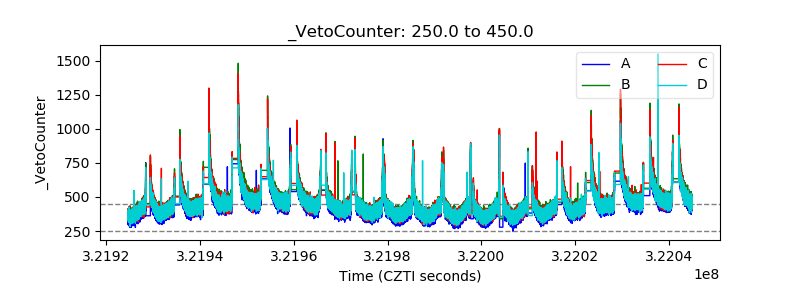 |