| Param | Original file | Final file |
|---|---|---|
| Filename | modeM0/AS1A07_069T01_9000003570_24124cztM0_level2.evt | modeM0/AS1A07_069T01_9000003570_24124cztM0_level2_quad_clean.evt |
| Size (bytes) | 341,069,760 | 58,628,160 |
| Size | 325.3 MB | 55.9 MB |
| Events in quadrant A | 2,411,500 | 362,309 |
| Events in quadrant B | 2,475,194 | 367,929 |
| Events in quadrant C | 2,424,102 | 347,809 |
| Events in quadrant D | 2,673,655 | 342,187 |
| Mode SS | |||
|---|---|---|---|
| Quadrant | BADHDUFLAG | Total packets | Discarded packets |
| A | 0 | 104 | 0 |
| B | 0 | 104 | 0 |
| C | 0 | 104 | 0 |
| D | 0 | 104 | 0 |
| Mode M0 | |||
|---|---|---|---|
| Quadrant | BADHDUFLAG | Total packets | Discarded packets |
| A | 0 | 10385 | 1 |
| B | 0 | 10517 | 1 |
| C | 0 | 10339 | 1 |
| D | 0 | 11360 | 1 |
| Mode M9 | |||
|---|---|---|---|
| Quadrant | BADHDUFLAG | Total packets | Discarded packets |
| A | 0 | 10 | 0 |
| B | 0 | 10 | 0 |
| C | 0 | 10 | 0 |
| D | 0 | 10 | 0 |
| Quadrant | Total seconds | Saturated seconds | Saturation percentage |
|---|---|---|---|
| A | 5058 | 13 | 0.257019% |
| B | 5058 | 25 | 0.494267% |
| C | 5058 | 40 | 0.790826% |
| D | 5058 | 16 | 0.316331% |
Noise dominated data is calculated using 1-second bins in cleaned event files. If a bin has >2000 counts, and if more than 50% of those come from <1% of pixels, then it is considered to be noise-dominated and hence unusable.
| Quadrant | # 1 sec bins | Bins with >0 counts | Bins with >2000 counts | High rate bins dominated by noise | Noise dominated (total time) | Noise dominated (detector-on time) | Marked lightcurve |
|---|---|---|---|---|---|---|---|
| A | 6048 | 5059 | 0 | 0 | 0.00% | 0.00% | 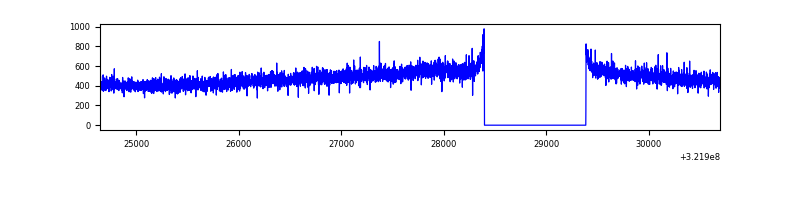 |
| B | 6048 | 5059 | 0 | 0 | 0.00% | 0.00% | 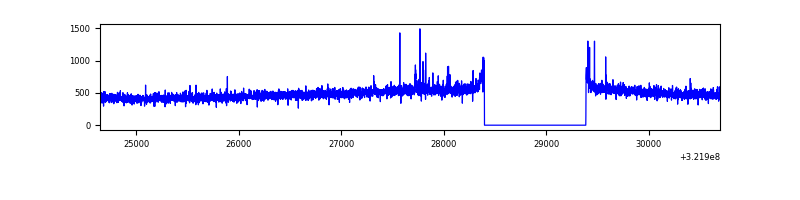 |
| C | 6048 | 5059 | 0 | 0 | 0.00% | 0.00% | 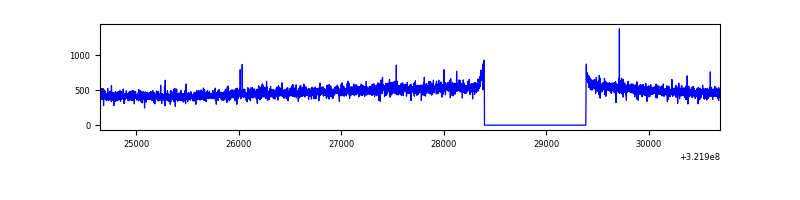 |
| D | 6048 | 5059 | 8 | 8 | 0.13% | 0.16% | 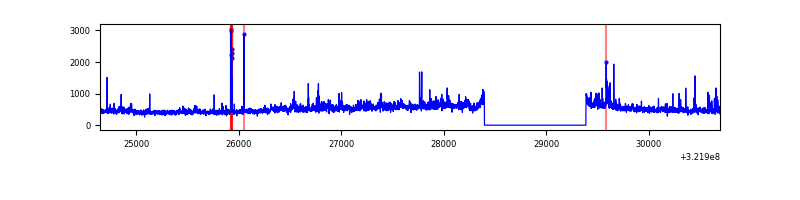 |
Top three noisy pixels from each quadrant. If the there are fewer than three noisy pixels in the level2.evt file, extra rows are filled as -1
| Pixel properties | Quadrant properties | ||||||
|---|---|---|---|---|---|---|---|
| Quadrant | DetID | PixID | Counts | Sigma | Mean | Median | Sigma |
| A | 2 | 250 | 14038 | 106.2 | 621 | 608 | 126.5 |
| A | 13 | 254 | 8358 | 61.28 | 621 | 608 | 126.5 |
| A | 3 | 137 | 5559 | 39.15 | 621 | 608 | 126.5 |
| B | 12 | 111 | 15022 | 120.73 | 620 | 606 | 119.4 |
| B | 11 | 111 | 12930 | 103.21 | 620 | 606 | 119.4 |
| B | 14 | 111 | 11360 | 90.06 | 620 | 606 | 119.4 |
| C | 14 | 238 | 93798 | 657.24 | 594 | 595 | 141.8 |
| C | 7 | 247 | 10131 | 67.24 | 594 | 595 | 141.8 |
| C | 3 | 233 | 4864 | 30.1 | 594 | 595 | 141.8 |
| D | 8 | 195 | 267156 | 1794.3 | 601 | 583 | 148.6 |
| D | 1 | 52 | 61313 | 408.77 | 601 | 583 | 148.6 |
| D | 12 | 218 | 23203 | 152.26 | 601 | 583 | 148.6 |
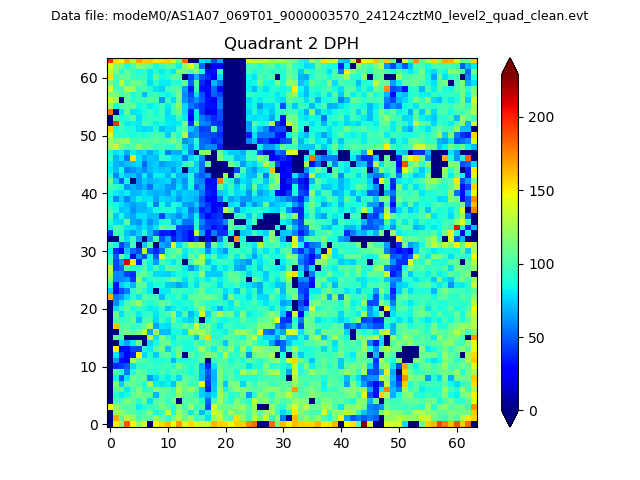
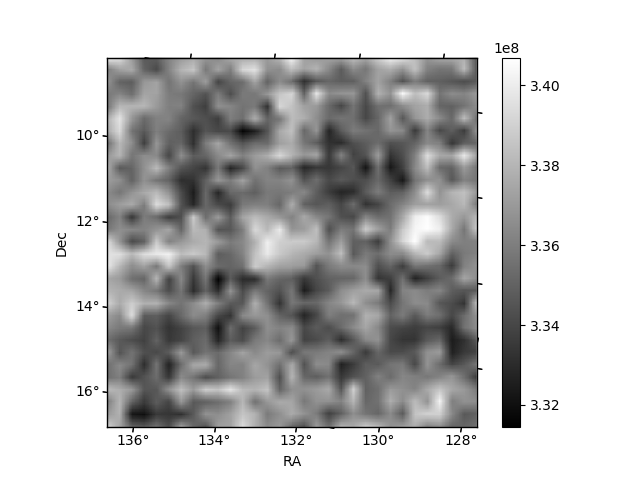
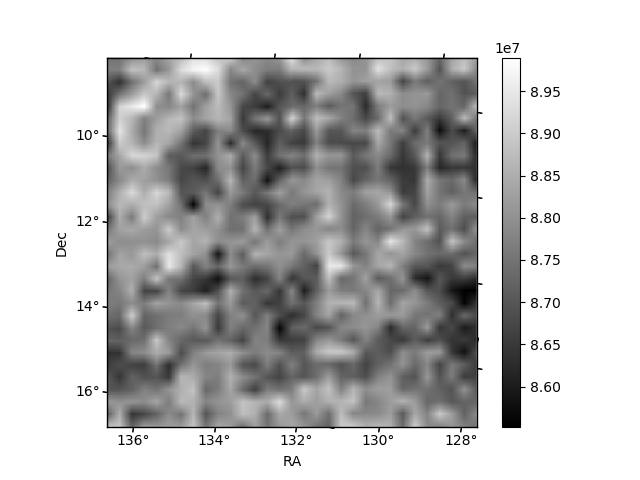
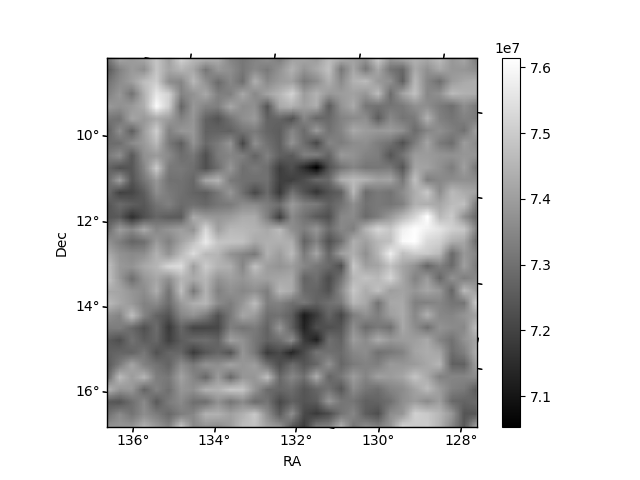
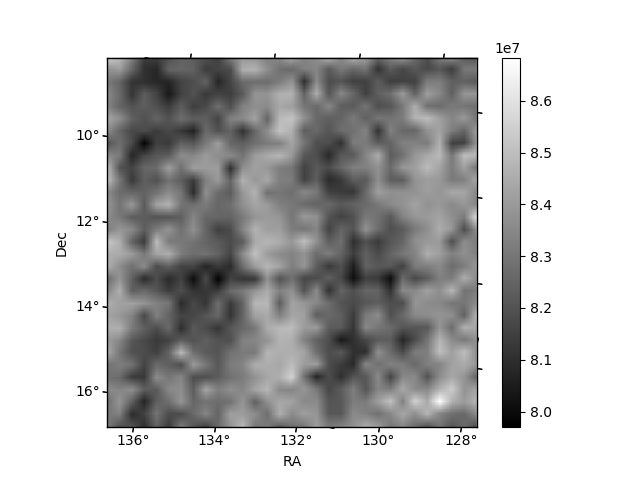
Histogram calculated using DETX and DETY for each event in the final _common_clean file
| Quadrant A | 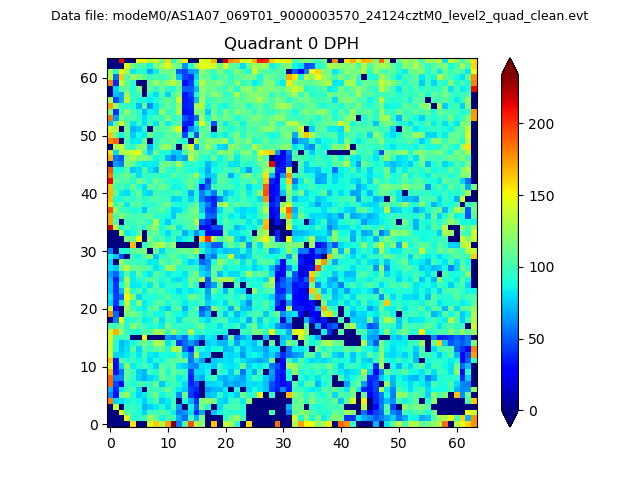 |
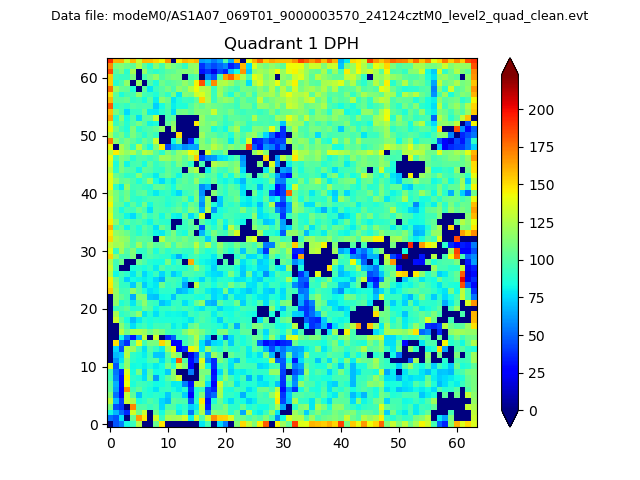 |
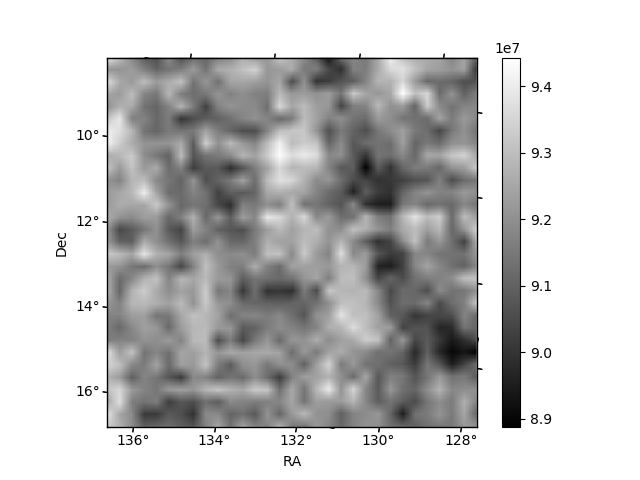
Quadrant B |
|---|---|---|---|
| Quadrant D | 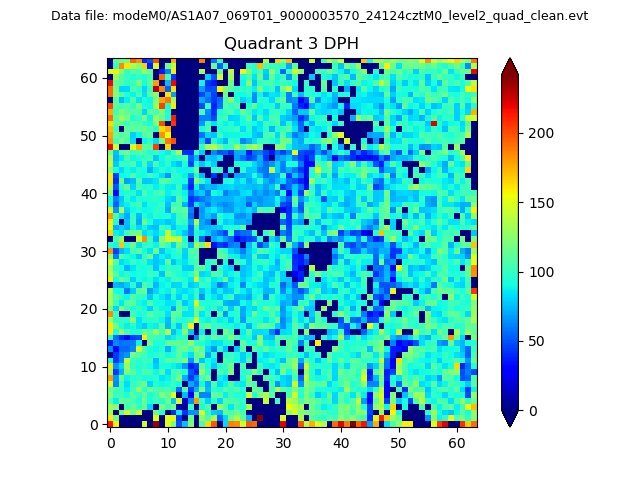 |
 |
Quadrant C |
| Plot type | Count rate plots | Images |
|---|---|---|
| Comparison with Poisson distribution Blue bars denote a histogram of data divided into 1 sec bins. Red curve is a Poisson curve with rate = median count rate of data. |
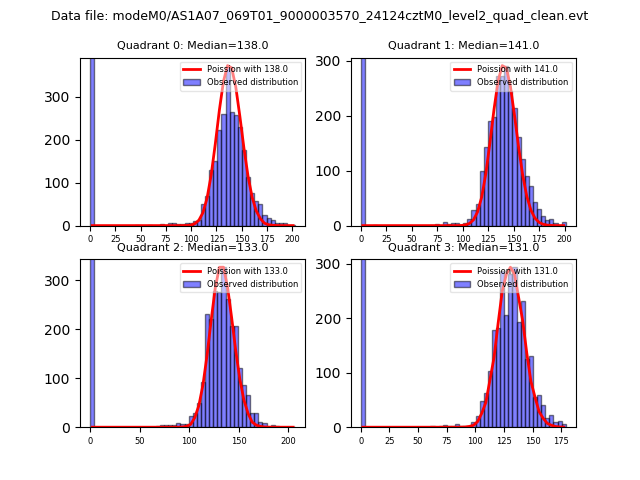 |
 |
| Quadrant-wise count rates Data is divided into 100 sec bins |
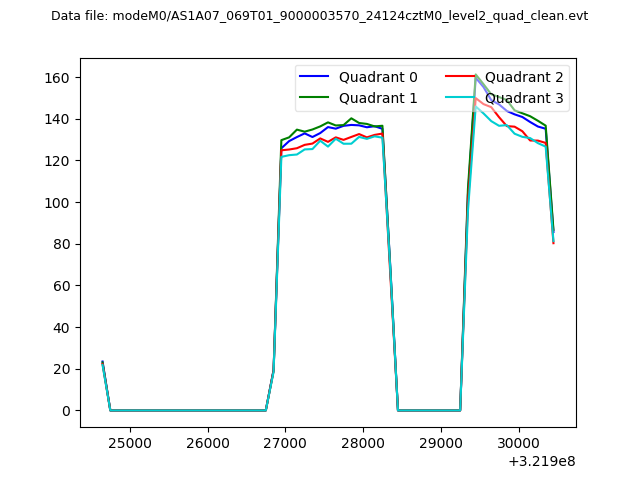 |
|
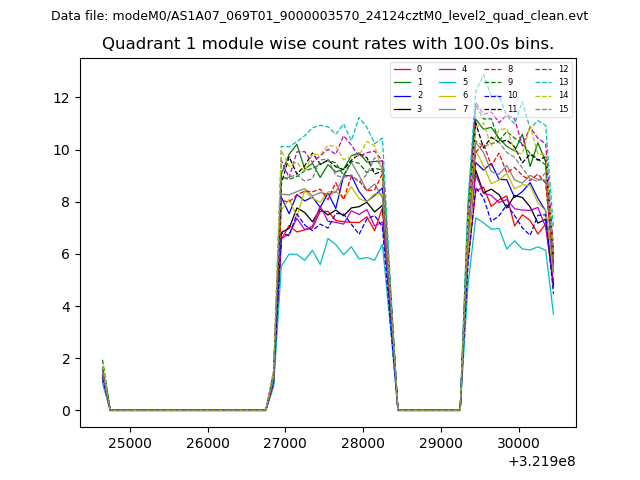
| Module-wise count rates for Quadrant A Data is divided into 100 sec bins |
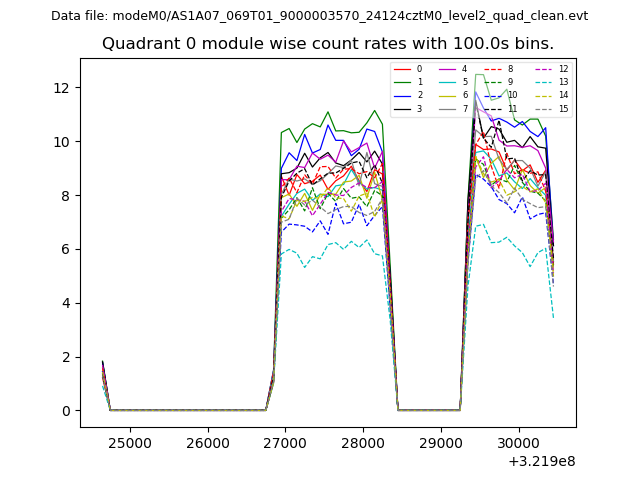 |
 |
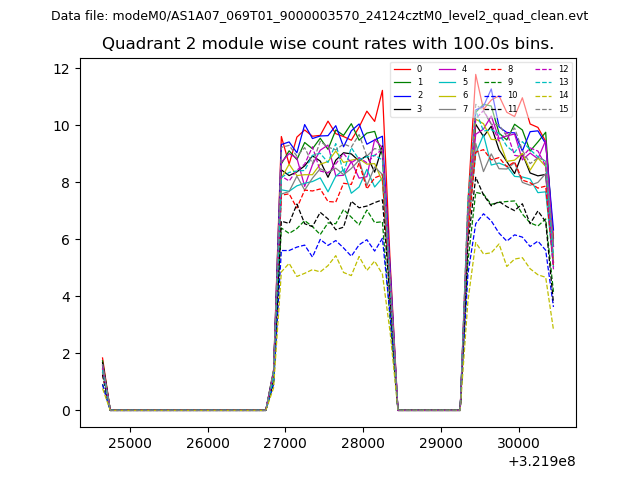
| Module-wise count rates for Quadrant B Data is divided into 100 sec bins |
 |
 |
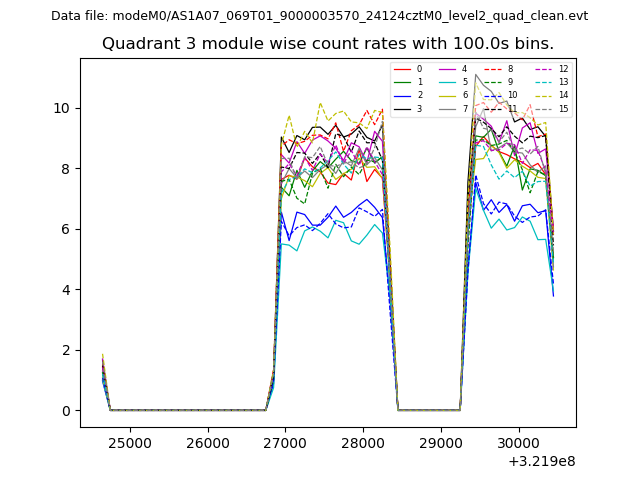
| Module-wise count rates for Quadrant C Data is divided into 100 sec bins |
 |
 |
| Module-wise count rates for Quadrant D Data is divided into 100 sec bins |
 |
 |
| Parameter | Plot |
|---|---|
| CZT HV Monitor | 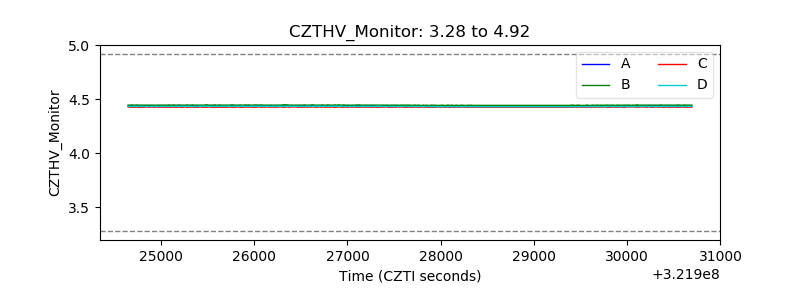 |
| D_VDD | 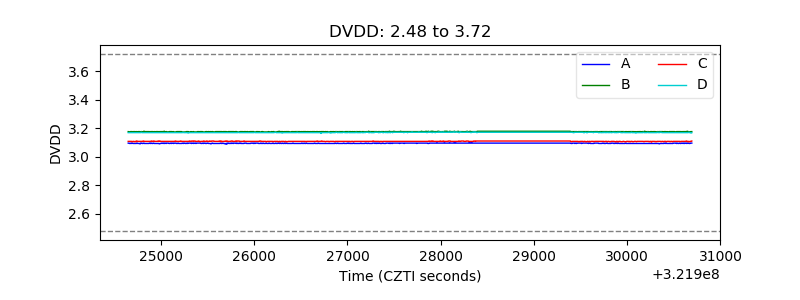 |
| Temperature 1 | 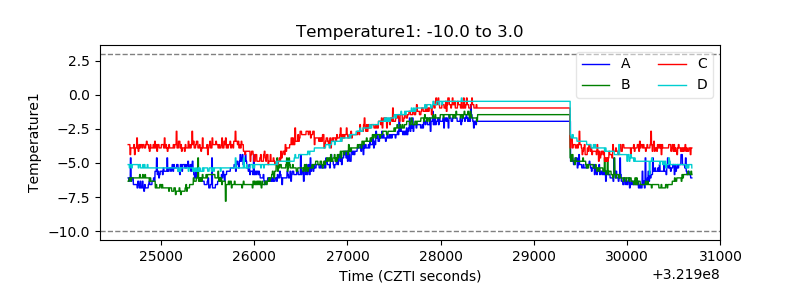 |
| Veto HV Monitor | 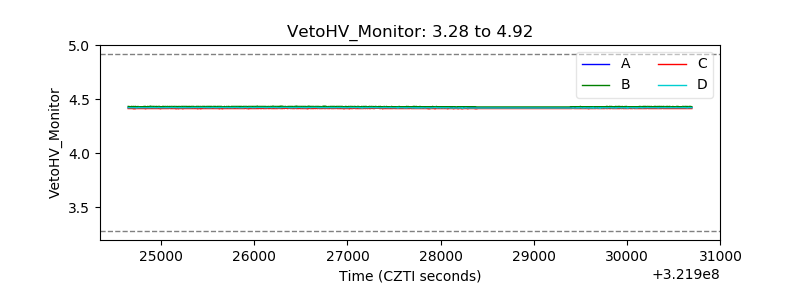 |
| Veto LLD |  |
| Alpha Counter | 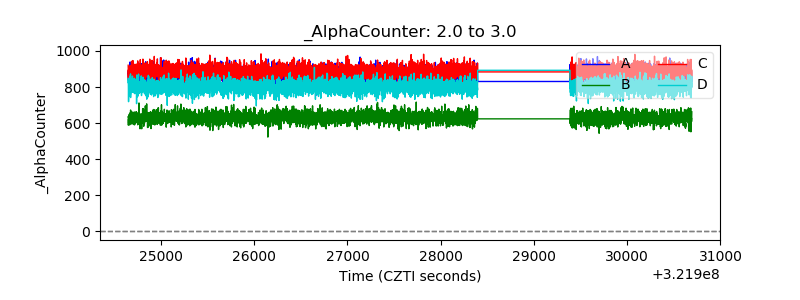 |
| _CPM_Rate | 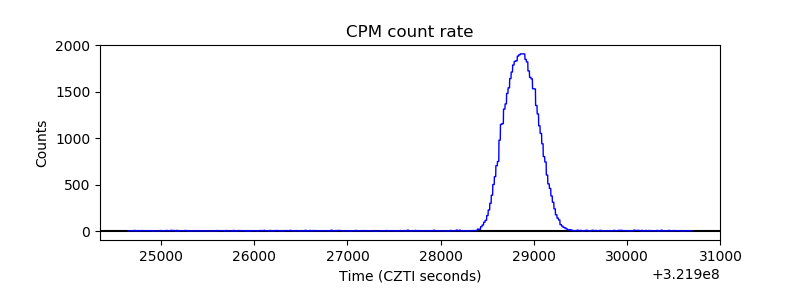 |
| CZT Counter | 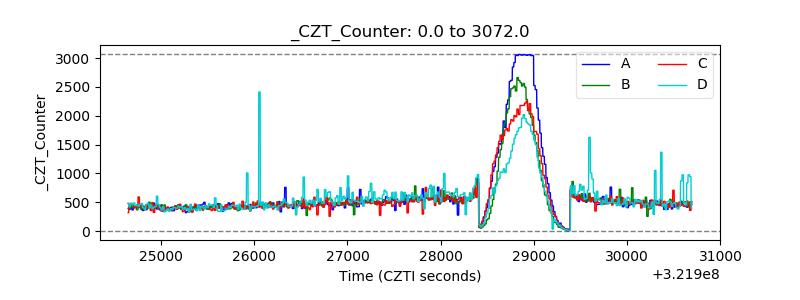 |
| +2.5 Volts monitor |  |
| +5 Volts monitor | 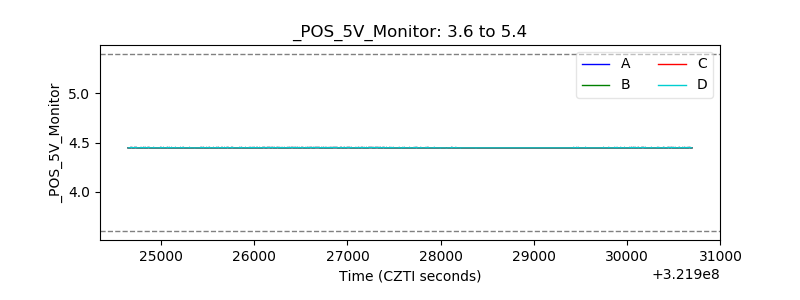 |
| _ROLL_ROT | 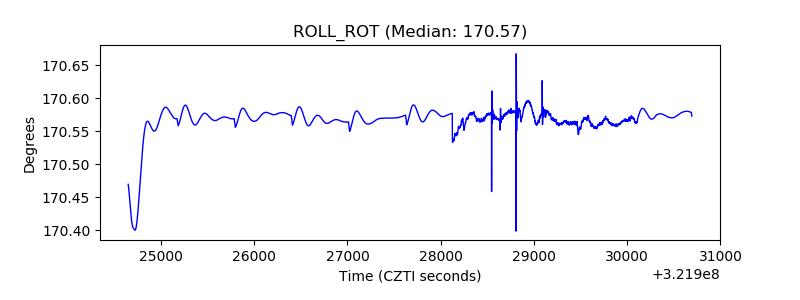 |
| _Roll_DEC | 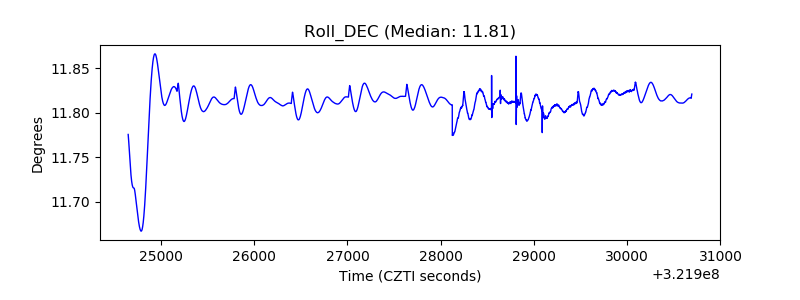 |
| _Roll_RA | 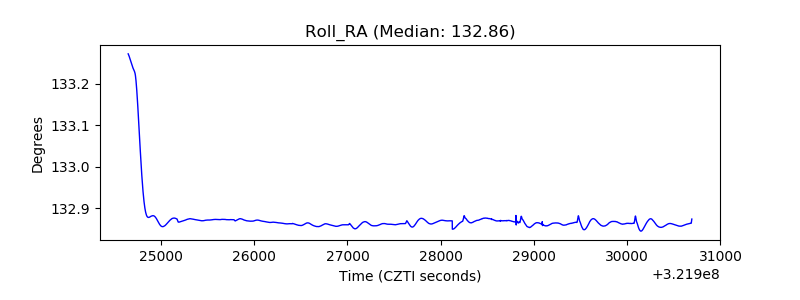 |
| Veto Counter | 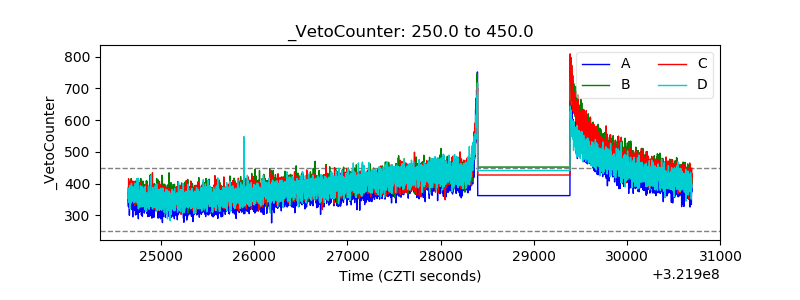 |