| Param | Original file | Final file |
|---|---|---|
| Filename | modeM0/AS1A07_069T01_9000003570_24127cztM0_level2.evt | modeM0/AS1A07_069T01_9000003570_24127cztM0_level2_quad_clean.evt |
| Size (bytes) | 478,468,800 | 75,240,000 |
| Size | 456.3 MB | 71.8 MB |
| Events in quadrant A | 3,506,694 | 467,457 |
| Events in quadrant B | 3,500,486 | 477,774 |
| Events in quadrant C | 3,521,696 | 441,513 |
| Events in quadrant D | 3,516,561 | 434,010 |
| Mode SS | |||
|---|---|---|---|
| Quadrant | BADHDUFLAG | Total packets | Discarded packets |
| A | 0 | 134 | 0 |
| B | 0 | 134 | 0 |
| C | 0 | 134 | 0 |
| D | 0 | 134 | 0 |
| Mode M0 | |||
|---|---|---|---|
| Quadrant | BADHDUFLAG | Total packets | Discarded packets |
| A | 0 | 14369 | 3 |
| B | 0 | 14270 | 2 |
| C | 0 | 14297 | 2 |
| D | 0 | 14575 | 2 |
| Mode M9 | |||
|---|---|---|---|
| Quadrant | BADHDUFLAG | Total packets | Discarded packets |
| A | 0 | 15 | 0 |
| B | 0 | 16 | 0 |
| C | 0 | 16 | 0 |
| D | 0 | 16 | 0 |
| Quadrant | Total seconds | Saturated seconds | Saturation percentage |
|---|---|---|---|
| A | 6555 | 34 | 0.518688% |
| B | 6555 | 41 | 0.625477% |
| C | 6555 | 69 | 1.052632% |
| D | 6555 | 30 | 0.457666% |
Noise dominated data is calculated using 1-second bins in cleaned event files. If a bin has >2000 counts, and if more than 50% of those come from <1% of pixels, then it is considered to be noise-dominated and hence unusable.
| Quadrant | # 1 sec bins | Bins with >0 counts | Bins with >2000 counts | High rate bins dominated by noise | Noise dominated (total time) | Noise dominated (detector-on time) | Marked lightcurve |
|---|---|---|---|---|---|---|---|
| A | 7770 | 6555 | 2 | 2 | 0.03% | 0.03% | 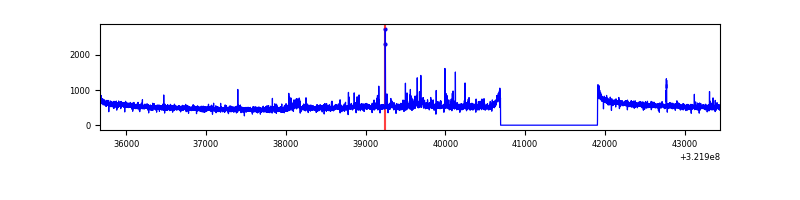 |
| B | 7770 | 6555 | 1 | 1 | 0.01% | 0.02% |  |
| C | 7770 | 6555 | 2 | 2 | 0.03% | 0.03% | 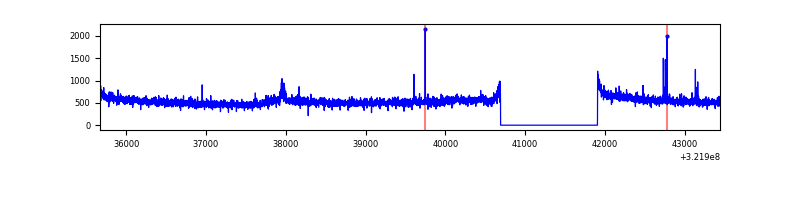 |
| D | 7770 | 6556 | 16 | 16 | 0.21% | 0.24% | 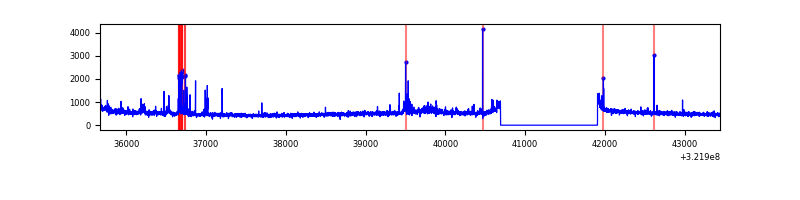 |
Top three noisy pixels from each quadrant. If the there are fewer than three noisy pixels in the level2.evt file, extra rows are filled as -1
| Pixel properties | Quadrant properties | ||||||
|---|---|---|---|---|---|---|---|
| Quadrant | DetID | PixID | Counts | Sigma | Mean | Median | Sigma |
| A | 6 | 16 | 90572 | 508.45 | 880 | 865 | 176.4 |
| A | 3 | 1 | 22247 | 121.19 | 880 | 865 | 176.4 |
| A | 13 | 254 | 10383 | 53.95 | 880 | 865 | 176.4 |
| B | 4 | 171 | 19835 | 114.04 | 883 | 865 | 166.3 |
| B | 12 | 111 | 19576 | 112.48 | 883 | 865 | 166.3 |
| B | 11 | 111 | 17278 | 98.67 | 883 | 865 | 166.3 |
| C | 14 | 238 | 134440 | 690.49 | 833 | 842 | 193.5 |
| C | 10 | 91 | 77886 | 398.19 | 833 | 842 | 193.5 |
| C | 3 | 233 | 30987 | 155.8 | 833 | 842 | 193.5 |
| D | 8 | 195 | 168733 | 825.89 | 839 | 816 | 203.3 |
| D | 1 | 52 | 96838 | 472.28 | 839 | 816 | 203.3 |
| D | 7 | 238 | 33411 | 160.32 | 839 | 816 | 203.3 |
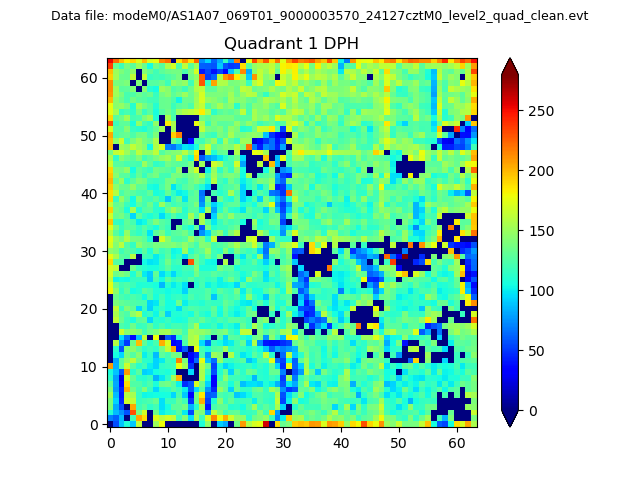
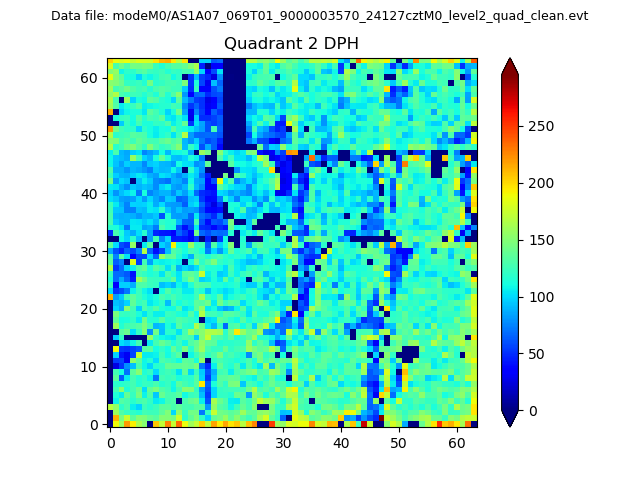
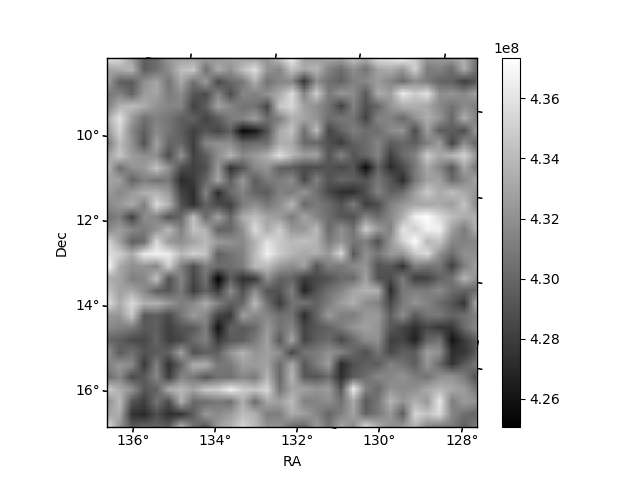
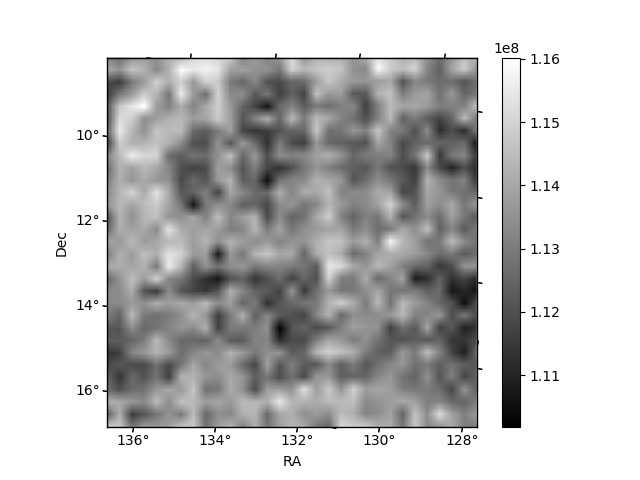
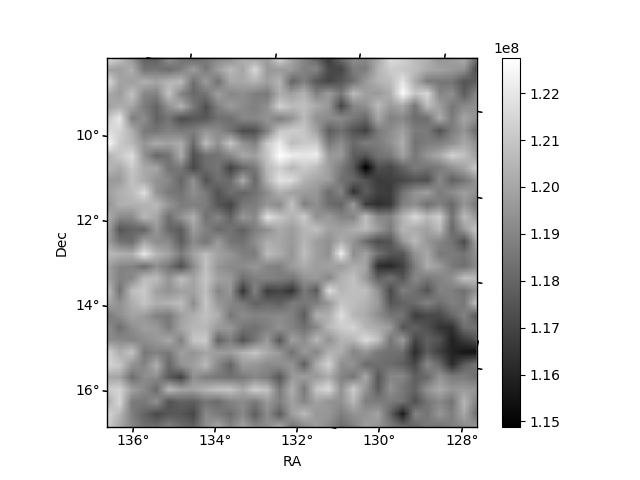
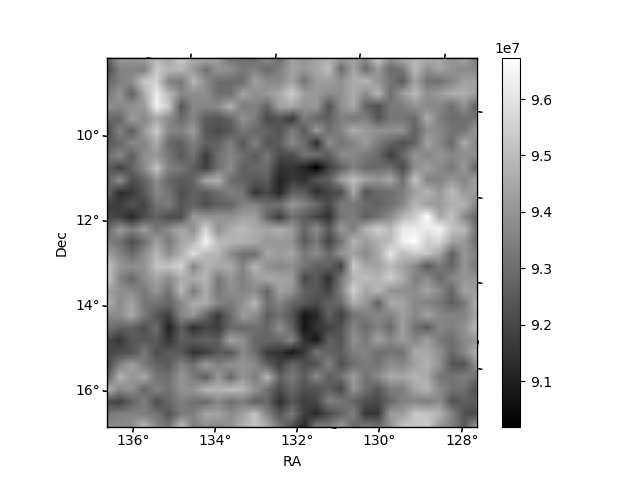
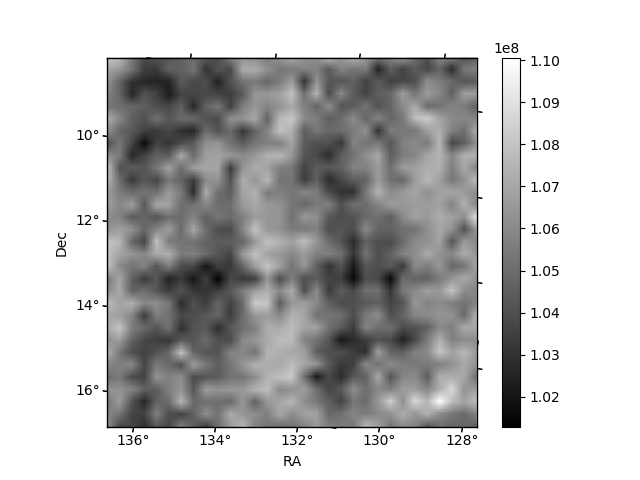
Histogram calculated using DETX and DETY for each event in the final _common_clean file
| Quadrant A | 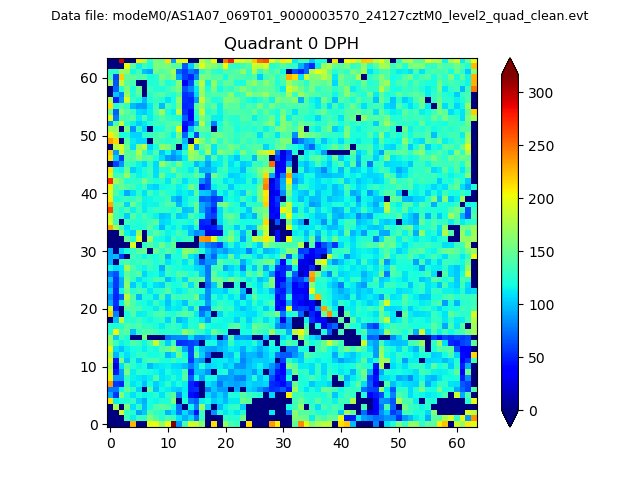 |
 |
Quadrant B |
|---|---|---|---|
| Quadrant D | 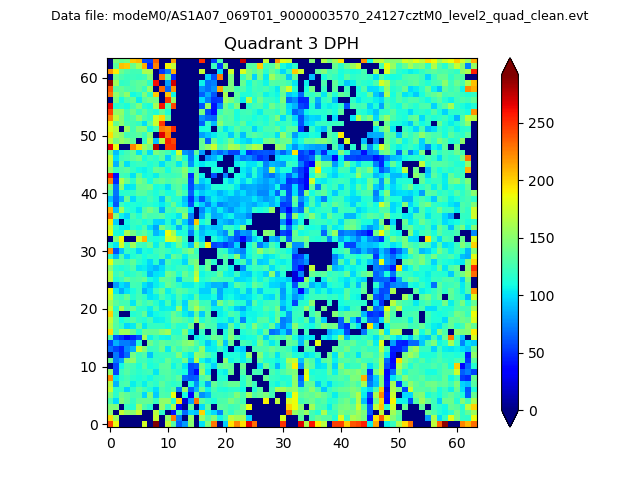 |
 |
Quadrant C |
| Plot type | Count rate plots | Images |
|---|---|---|
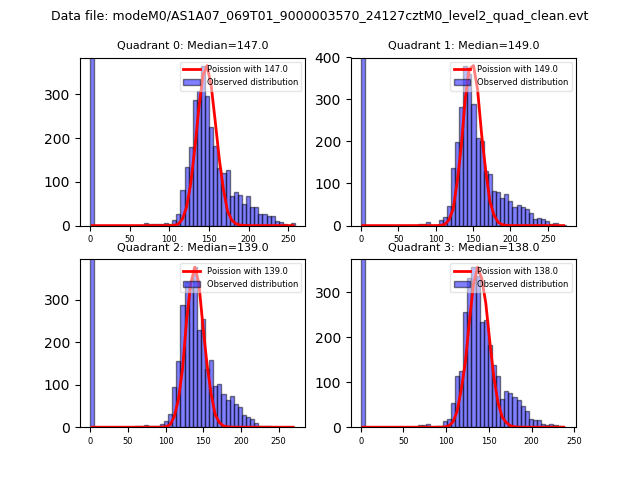
| Comparison with Poisson distribution Blue bars denote a histogram of data divided into 1 sec bins. Red curve is a Poisson curve with rate = median count rate of data. |
 |
 |
| Quadrant-wise count rates Data is divided into 100 sec bins |
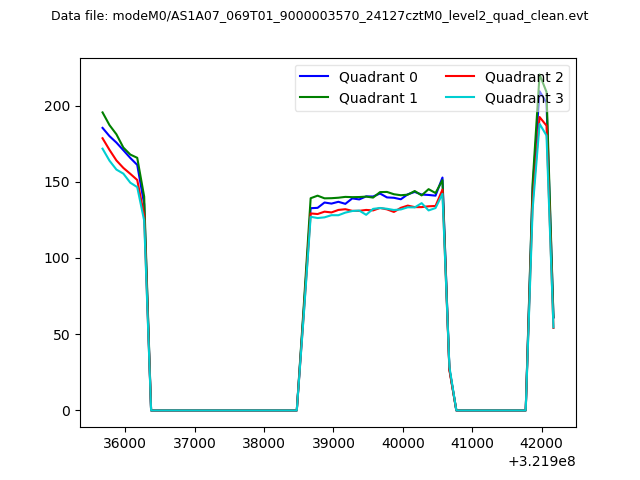 |
|
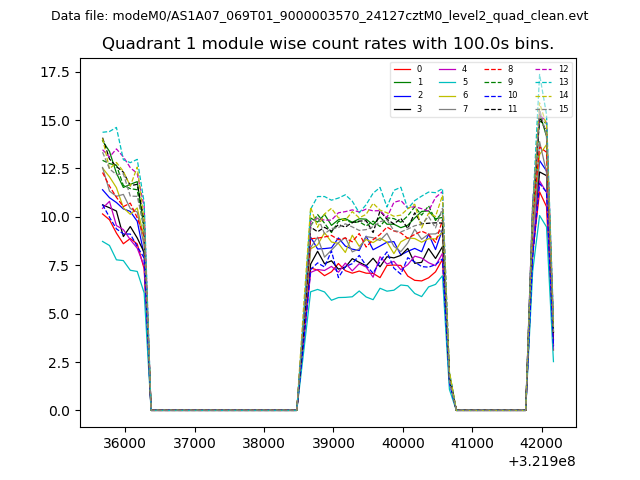
| Module-wise count rates for Quadrant A Data is divided into 100 sec bins |
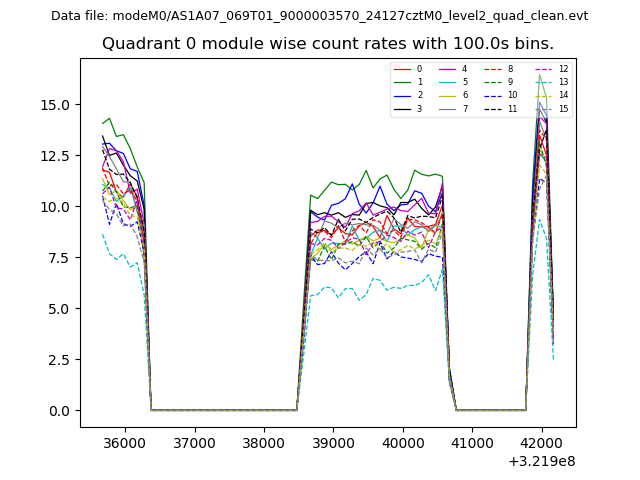 |
 |
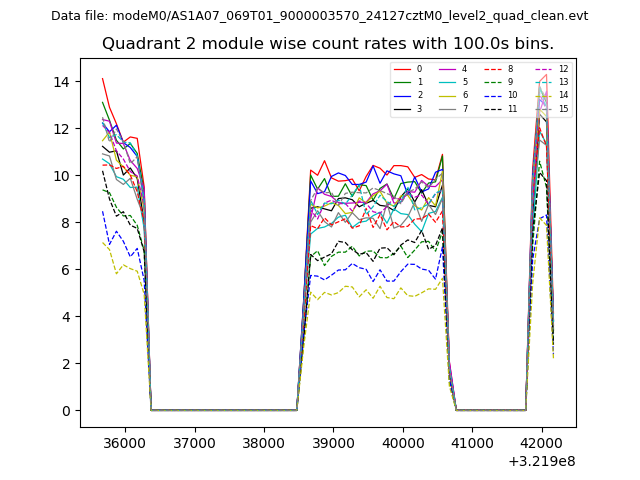
| Module-wise count rates for Quadrant B Data is divided into 100 sec bins |
 |
 |
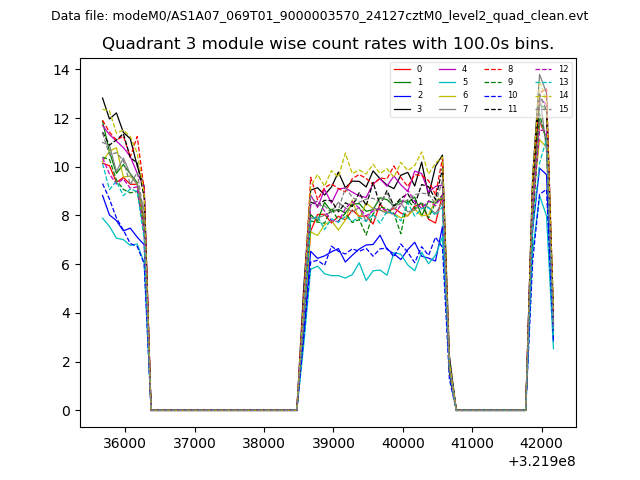
| Module-wise count rates for Quadrant C Data is divided into 100 sec bins |
 |
 |
| Module-wise count rates for Quadrant D Data is divided into 100 sec bins |
 |
 |
| Parameter | Plot |
|---|---|
| CZT HV Monitor | 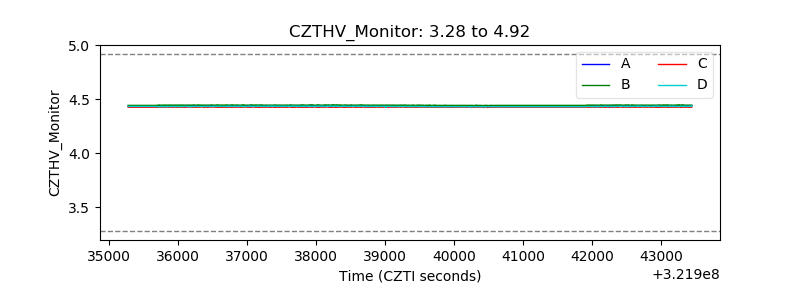 |
| D_VDD | 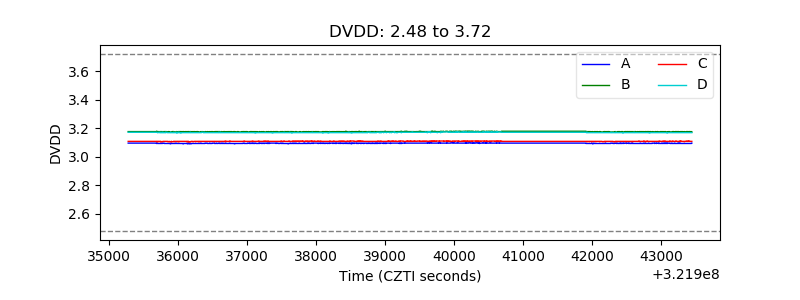 |
| Temperature 1 | 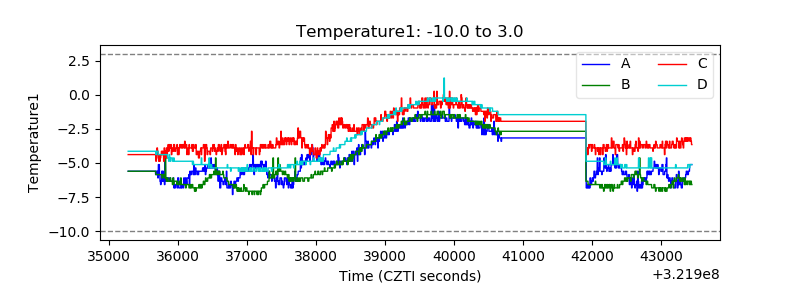 |
| Veto HV Monitor |  |
| Veto LLD | 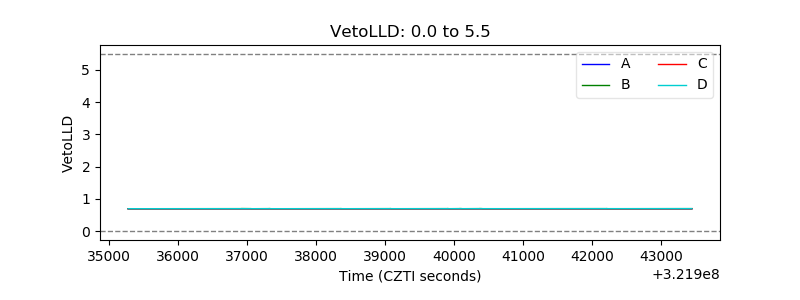 |
| Alpha Counter | 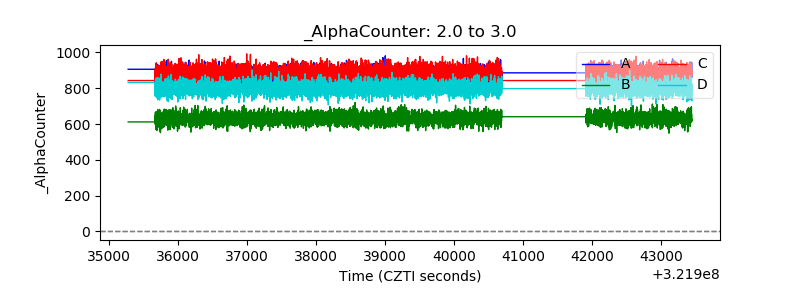 |
| _CPM_Rate | 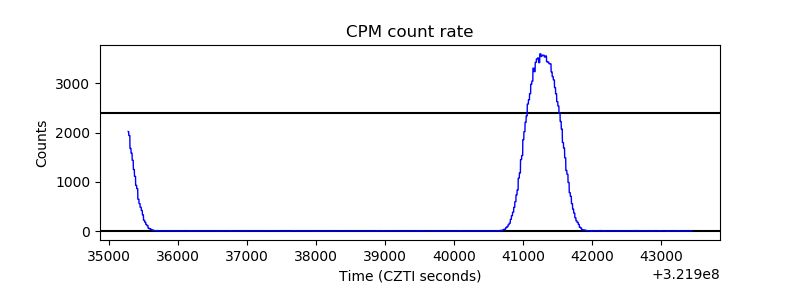 |
| CZT Counter | 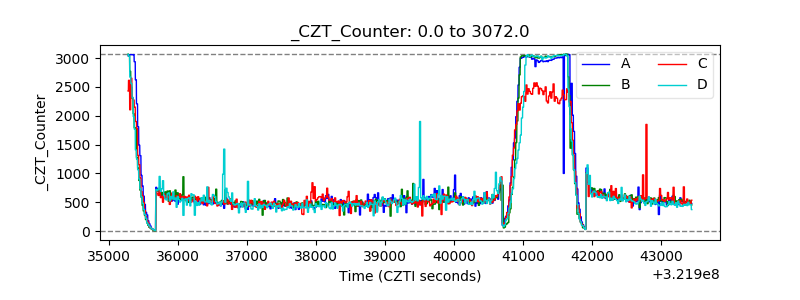 |
| +2.5 Volts monitor |  |
| +5 Volts monitor |  |
| _ROLL_ROT | 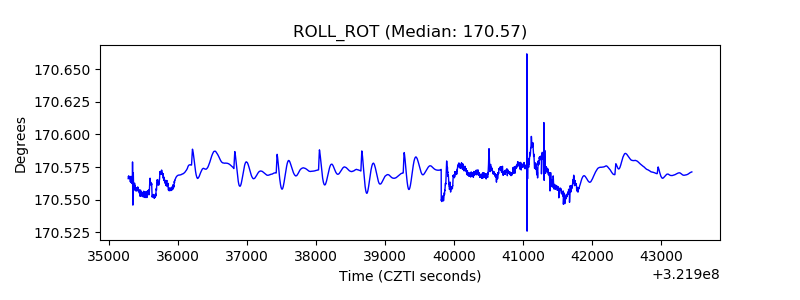 |
| _Roll_DEC |  |
| _Roll_RA | 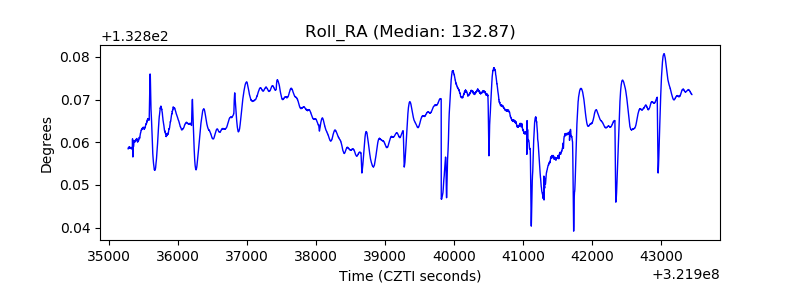 |
| Veto Counter | 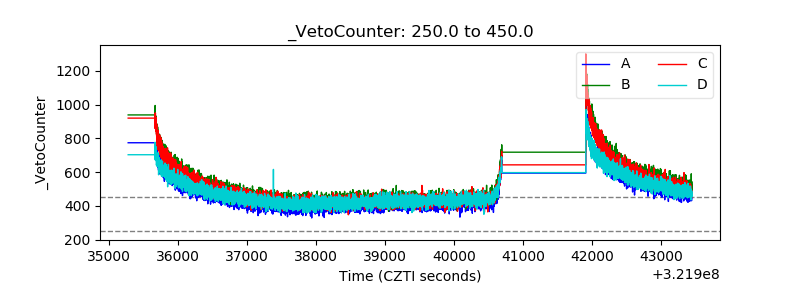 |