| Param | Original file | Final file |
|---|---|---|
| Filename | modeM0/AS1A07_069T01_9000003570_24128cztM0_level2.evt | modeM0/AS1A07_069T01_9000003570_24128cztM0_level2_quad_clean.evt |
| Size (bytes) | 496,180,800 | 67,714,560 |
| Size | 473.2 MB | 64.6 MB |
| Events in quadrant A | 3,620,850 | 411,650 |
| Events in quadrant B | 3,693,238 | 419,944 |
| Events in quadrant C | 3,693,573 | 389,123 |
| Events in quadrant D | 3,582,307 | 380,251 |
| Mode SS | |||
|---|---|---|---|
| Quadrant | BADHDUFLAG | Total packets | Discarded packets |
| A | 0 | 130 | 0 |
| B | 0 | 130 | 0 |
| C | 0 | 130 | 0 |
| D | 0 | 130 | 0 |
| Mode M0 | |||
|---|---|---|---|
| Quadrant | BADHDUFLAG | Total packets | Discarded packets |
| A | 0 | 14568 | 2 |
| B | 0 | 14852 | 2 |
| C | 0 | 14792 | 3 |
| D | 0 | 14441 | 2 |
| Mode M9 | |||
|---|---|---|---|
| Quadrant | BADHDUFLAG | Total packets | Discarded packets |
| A | 0 | 15 | 0 |
| B | 0 | 16 | 0 |
| C | 0 | 16 | 0 |
| D | 0 | 16 | 0 |
| Quadrant | Total seconds | Saturated seconds | Saturation percentage |
|---|---|---|---|
| A | 6443 | 79 | 1.226137% |
| B | 6443 | 95 | 1.474468% |
| C | 6442 | 136 | 2.111146% |
| D | 6442 | 66 | 1.024527% |
Noise dominated data is calculated using 1-second bins in cleaned event files. If a bin has >2000 counts, and if more than 50% of those come from <1% of pixels, then it is considered to be noise-dominated and hence unusable.
| Quadrant | # 1 sec bins | Bins with >0 counts | Bins with >2000 counts | High rate bins dominated by noise | Noise dominated (total time) | Noise dominated (detector-on time) | Marked lightcurve |
|---|---|---|---|---|---|---|---|
| A | 7718 | 6443 | 3 | 3 | 0.04% | 0.05% | 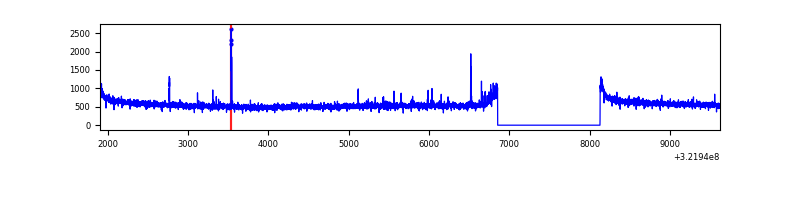 |
| B | 7718 | 6443 | 2 | 2 | 0.03% | 0.03% | 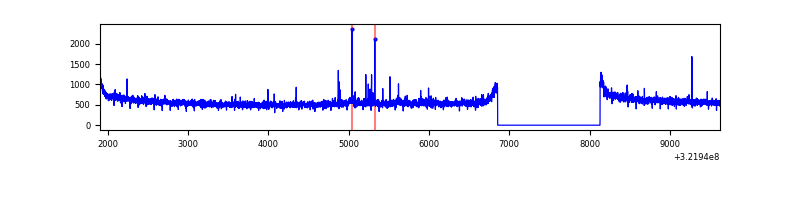 |
| C | 7717 | 6442 | 15 | 15 | 0.19% | 0.23% | 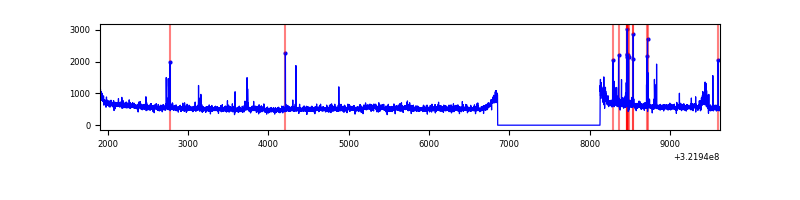 |
| D | 7717 | 6443 | 16 | 16 | 0.21% | 0.25% | 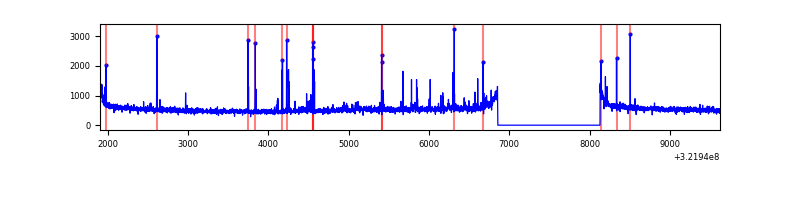 |
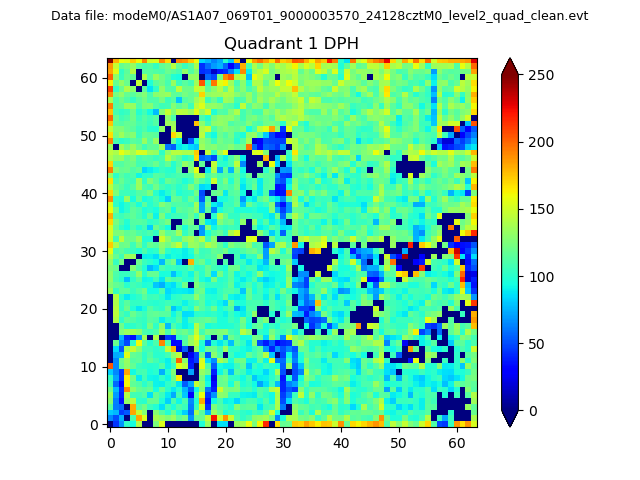
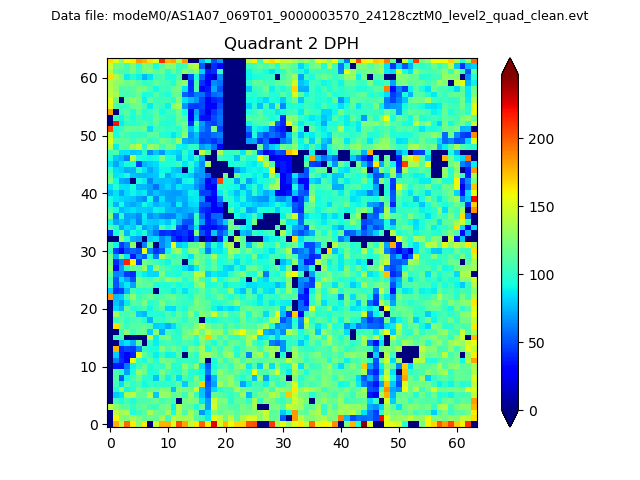
Top three noisy pixels from each quadrant. If the there are fewer than three noisy pixels in the level2.evt file, extra rows are filled as -1
| Pixel properties | Quadrant properties | ||||||
|---|---|---|---|---|---|---|---|
| Quadrant | DetID | PixID | Counts | Sigma | Mean | Median | Sigma |
| A | 6 | 16 | 40387 | 215.6 | 925 | 912 | 183.1 |
| A | 3 | 1 | 15584 | 80.14 | 925 | 912 | 183.1 |
| A | 13 | 254 | 10547 | 52.62 | 925 | 912 | 183.1 |
| B | 12 | 111 | 19799 | 109.94 | 924 | 905 | 171.9 |
| B | 10 | 249 | 18748 | 103.83 | 924 | 905 | 171.9 |
| B | 11 | 111 | 17630 | 97.32 | 924 | 905 | 171.9 |
| C | 2 | 16 | 141825 | 707.48 | 864 | 874 | 199.2 |
| C | 14 | 238 | 139567 | 696.15 | 864 | 874 | 199.2 |
| C | 10 | 91 | 37173 | 182.2 | 864 | 874 | 199.2 |
| D | 8 | 195 | 139524 | 656.17 | 872 | 850 | 211.3 |
| D | 1 | 52 | 59489 | 277.47 | 872 | 850 | 211.3 |
| D | 2 | 234 | 26575 | 121.72 | 872 | 850 | 211.3 |
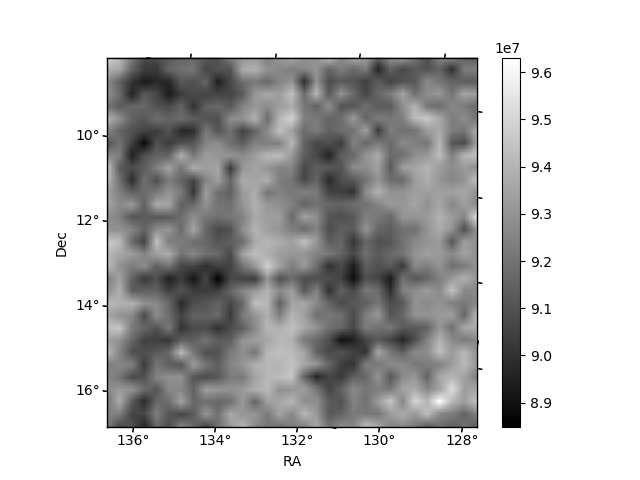
Histogram calculated using DETX and DETY for each event in the final _common_clean file
| Quadrant A | 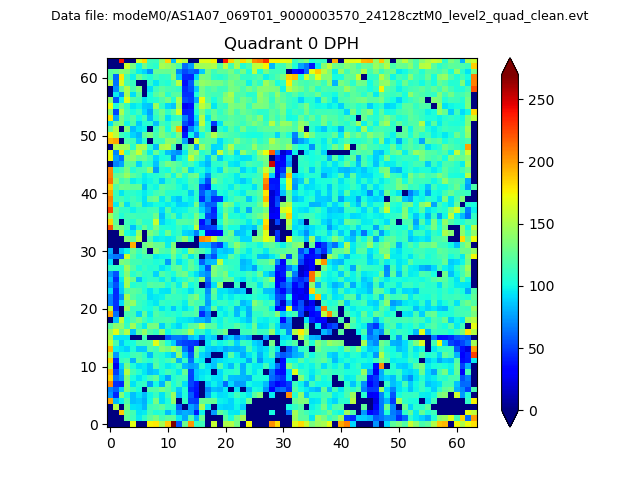 |
 |
Quadrant B |
|---|---|---|---|
| Quadrant D | 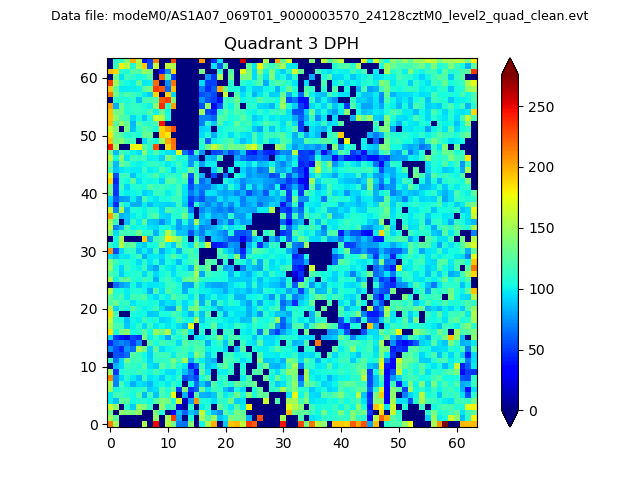 |
 |
Quadrant C |
| Plot type | Count rate plots | Images |
|---|---|---|
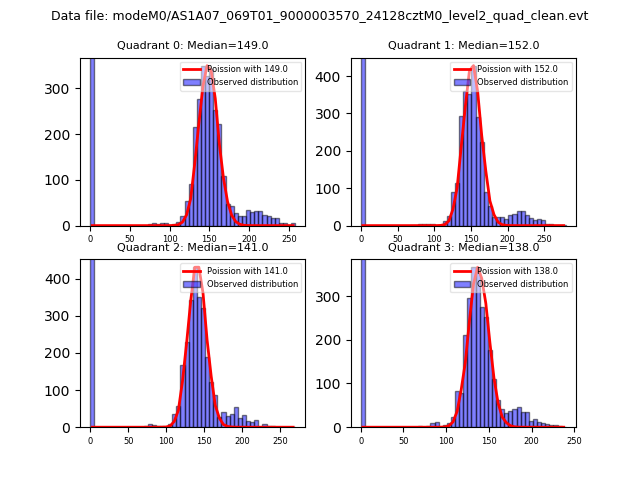
| Comparison with Poisson distribution Blue bars denote a histogram of data divided into 1 sec bins. Red curve is a Poisson curve with rate = median count rate of data. |
 |
 |
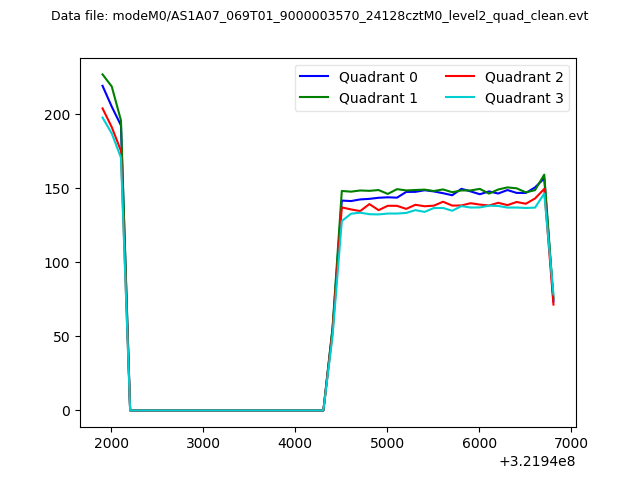
| Quadrant-wise count rates Data is divided into 100 sec bins |
 |
|
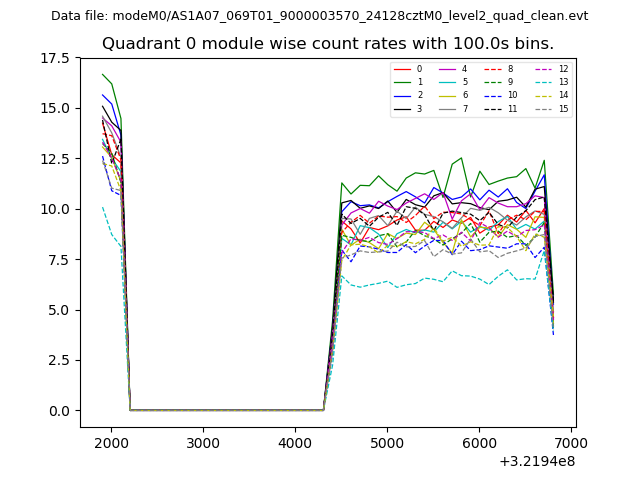
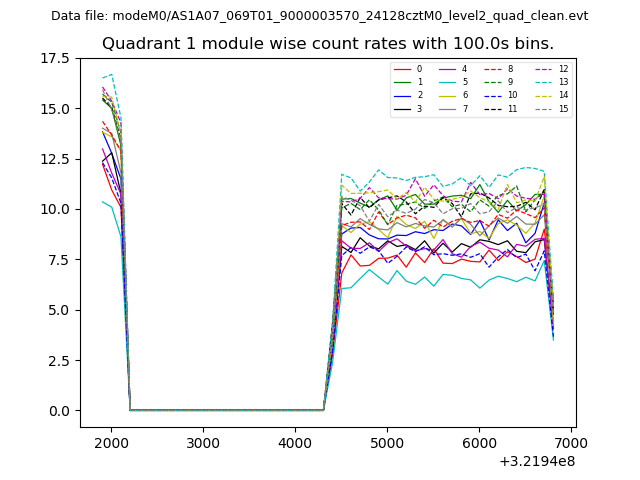
| Module-wise count rates for Quadrant A Data is divided into 100 sec bins |
 |
 |
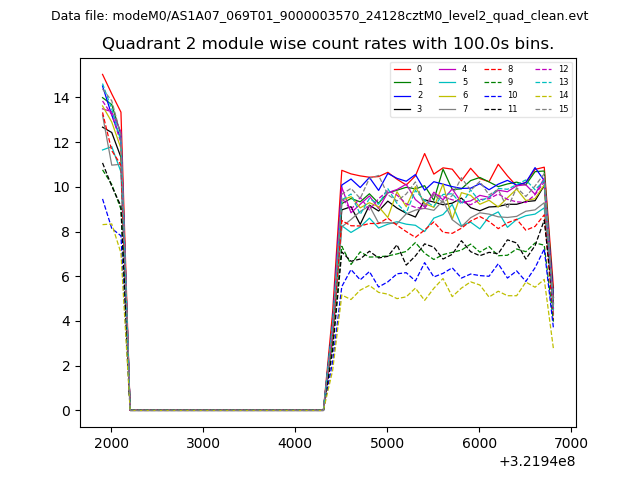
| Module-wise count rates for Quadrant B Data is divided into 100 sec bins |
 |
 |
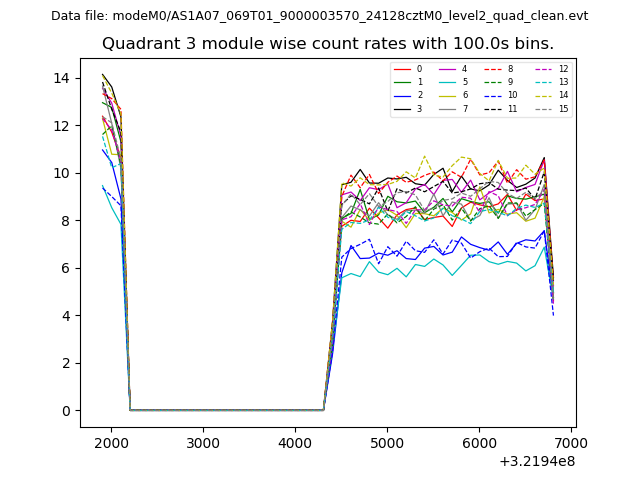
| Module-wise count rates for Quadrant C Data is divided into 100 sec bins |
 |
 |
| Module-wise count rates for Quadrant D Data is divided into 100 sec bins |
 |
 |
| Parameter | Plot |
|---|---|
| CZT HV Monitor | 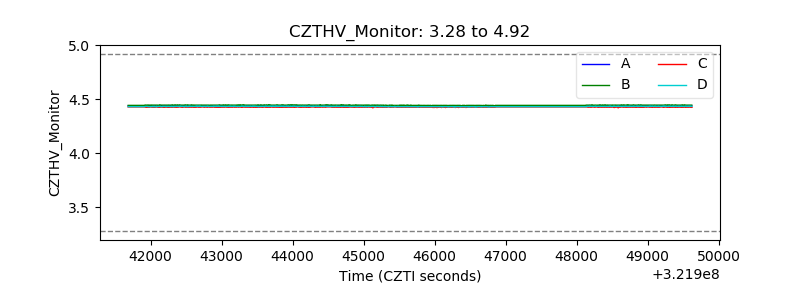 |
| D_VDD |  |
| Temperature 1 | 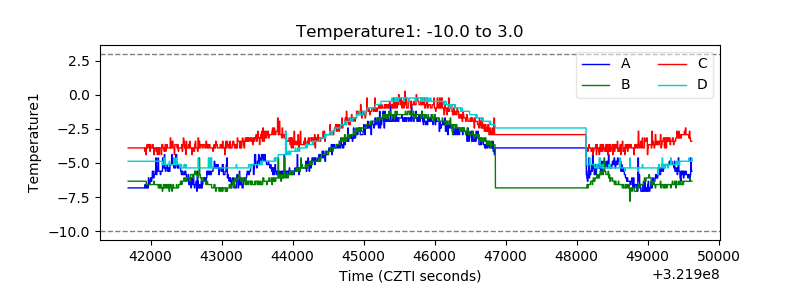 |
| Veto HV Monitor |  |
| Veto LLD | 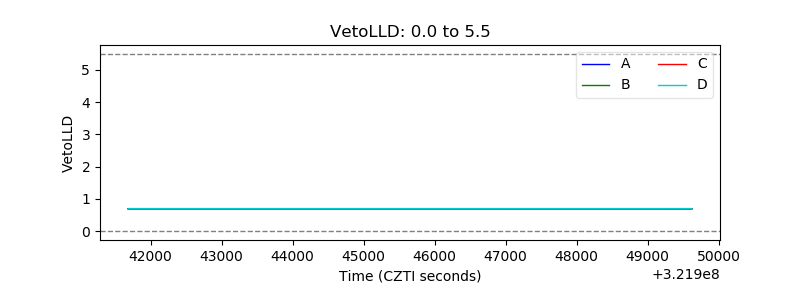 |
| Alpha Counter | 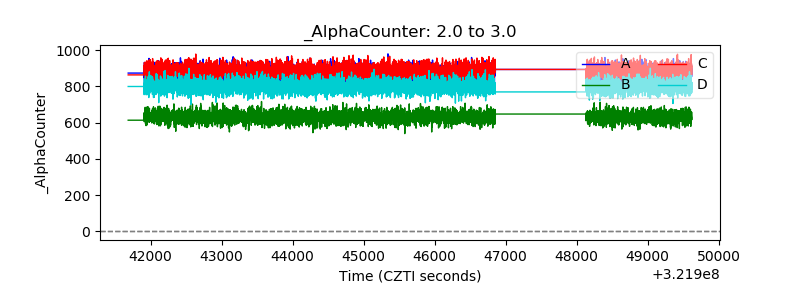 |
| _CPM_Rate | 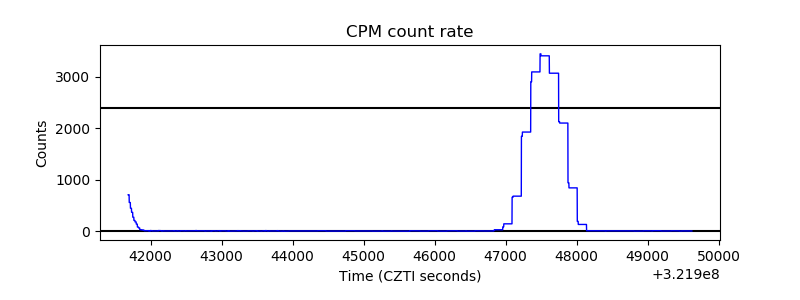 |
| CZT Counter | 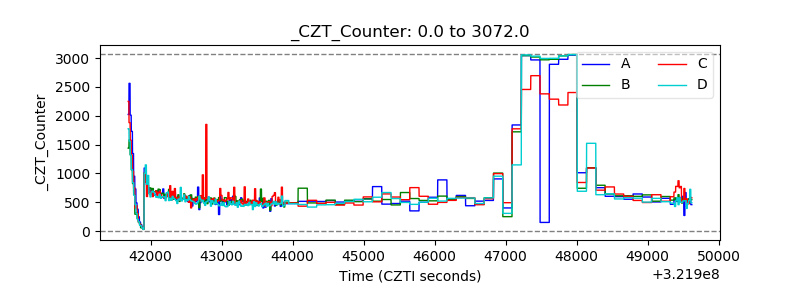 |
| +2.5 Volts monitor |  |
| +5 Volts monitor |  |
| _ROLL_ROT | 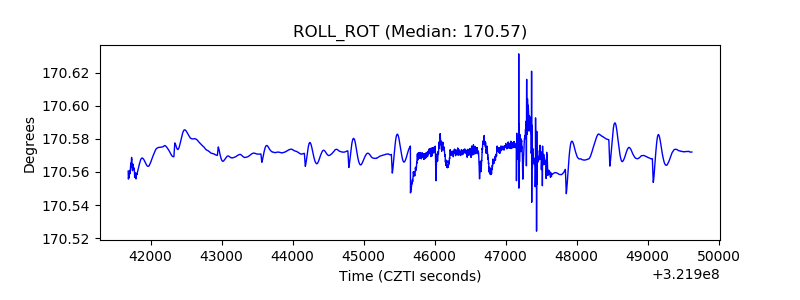 |
| _Roll_DEC | 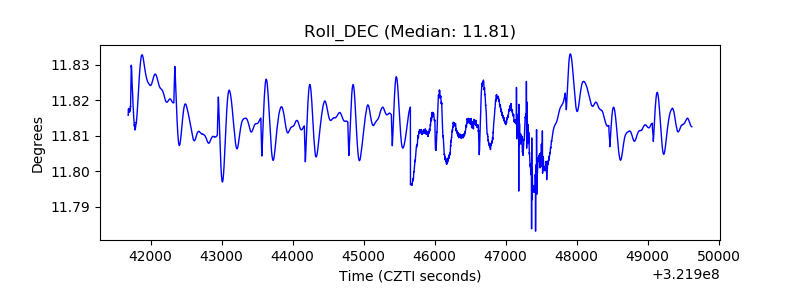 |
| _Roll_RA |  |
| Veto Counter | 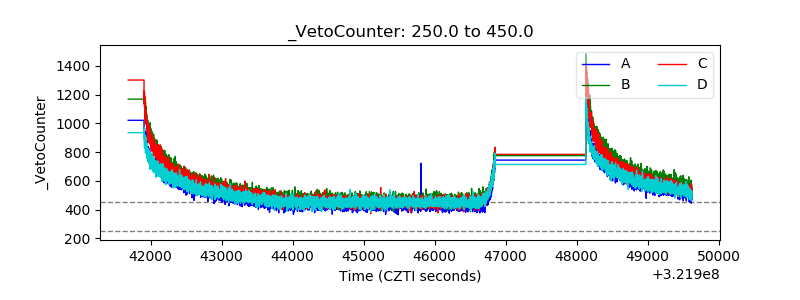 |