| Param | Original file | Final file |
|---|---|---|
| Filename | modeM0/AS1A07_069T01_9000003570_24129cztM0_level2.evt | modeM0/AS1A07_069T01_9000003570_24129cztM0_level2_quad_clean.evt |
| Size (bytes) | 517,976,640 | 67,273,920 |
| Size | 494.0 MB | 64.2 MB |
| Events in quadrant A | 3,641,813 | 410,431 |
| Events in quadrant B | 3,711,999 | 417,977 |
| Events in quadrant C | 4,257,916 | 384,411 |
| Events in quadrant D | 3,642,302 | 378,589 |
| Mode SS | |||
|---|---|---|---|
| Quadrant | BADHDUFLAG | Total packets | Discarded packets |
| A | 0 | 130 | 0 |
| B | 0 | 130 | 0 |
| C | 0 | 130 | 0 |
| D | 0 | 130 | 0 |
| Mode M0 | |||
|---|---|---|---|
| Quadrant | BADHDUFLAG | Total packets | Discarded packets |
| A | 0 | 14584 | 2 |
| B | 0 | 14900 | 2 |
| C | 0 | 16572 | 2 |
| D | 0 | 14599 | 2 |
| Mode M9 | |||
|---|---|---|---|
| Quadrant | BADHDUFLAG | Total packets | Discarded packets |
| A | 0 | 14 | 0 |
| B | 0 | 15 | 0 |
| C | 0 | 15 | 0 |
| D | 0 | 15 | 0 |
| Quadrant | Total seconds | Saturated seconds | Saturation percentage |
|---|---|---|---|
| A | 6384 | 55 | 0.861529% |
| B | 6384 | 102 | 1.597744% |
| C | 6383 | 324 | 5.075983% |
| D | 6383 | 39 | 0.610998% |
Noise dominated data is calculated using 1-second bins in cleaned event files. If a bin has >2000 counts, and if more than 50% of those come from <1% of pixels, then it is considered to be noise-dominated and hence unusable.
| Quadrant | # 1 sec bins | Bins with >0 counts | Bins with >2000 counts | High rate bins dominated by noise | Noise dominated (total time) | Noise dominated (detector-on time) | Marked lightcurve |
|---|---|---|---|---|---|---|---|
| A | 7754 | 6385 | 0 | 0 | 0.00% | 0.00% | 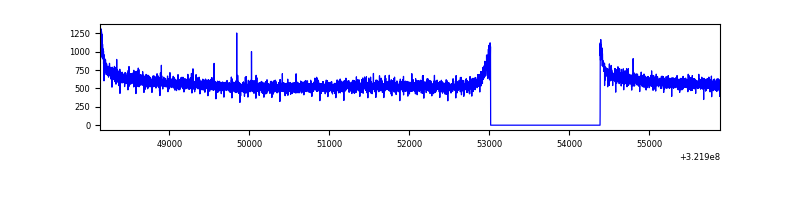 |
| B | 7754 | 6385 | 3 | 3 | 0.04% | 0.05% | 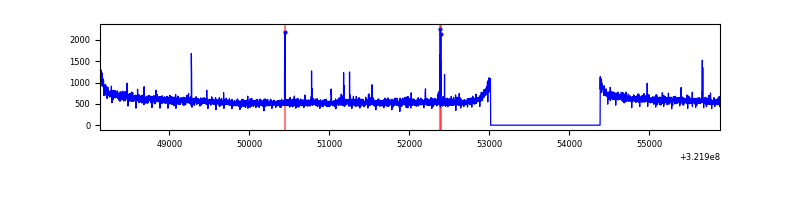 |
| C | 7753 | 6384 | 140 | 140 | 1.81% | 2.19% | 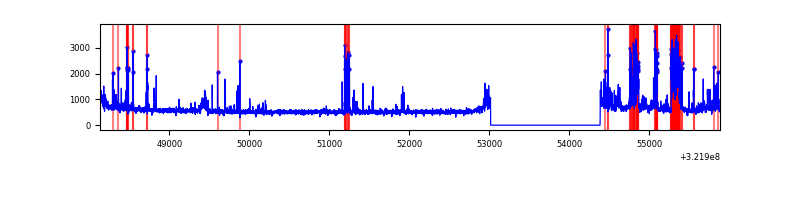 |
| D | 7753 | 6384 | 4 | 4 | 0.05% | 0.06% |  |
Top three noisy pixels from each quadrant. If the there are fewer than three noisy pixels in the level2.evt file, extra rows are filled as -1
| Pixel properties | Quadrant properties | ||||||
|---|---|---|---|---|---|---|---|
| Quadrant | DetID | PixID | Counts | Sigma | Mean | Median | Sigma |
| A | 2 | 250 | 13572 | 68.34 | 938 | 923 | 185.1 |
| A | 13 | 254 | 10788 | 53.3 | 938 | 923 | 185.1 |
| A | 6 | 16 | 10500 | 51.74 | 938 | 923 | 185.1 |
| B | 4 | 171 | 22357 | 124.14 | 935 | 919 | 172.7 |
| B | 12 | 111 | 19718 | 108.86 | 935 | 919 | 172.7 |
| B | 11 | 111 | 17593 | 96.55 | 935 | 919 | 172.7 |
| C | 0 | 239 | 484936 | 2442.89 | 863 | 872 | 198.2 |
| C | 2 | 16 | 261863 | 1317.12 | 863 | 872 | 198.2 |
| C | 14 | 238 | 140476 | 704.53 | 863 | 872 | 198.2 |
| D | 8 | 195 | 191754 | 882.44 | 884 | 861 | 216.3 |
| D | 1 | 52 | 28074 | 125.8 | 884 | 861 | 216.3 |
| D | 12 | 233 | 27468 | 123.0 | 884 | 861 | 216.3 |
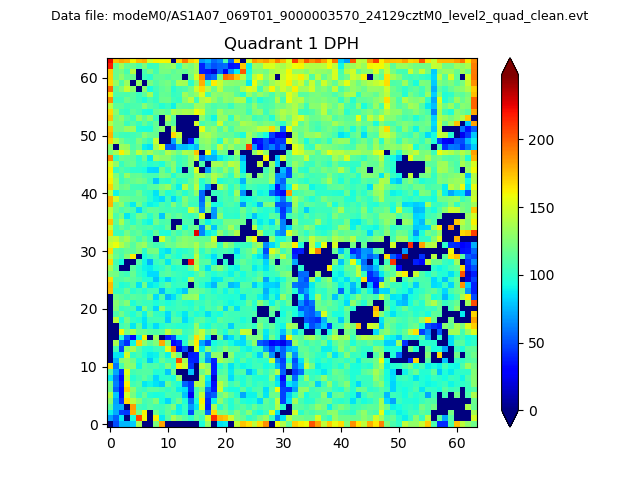
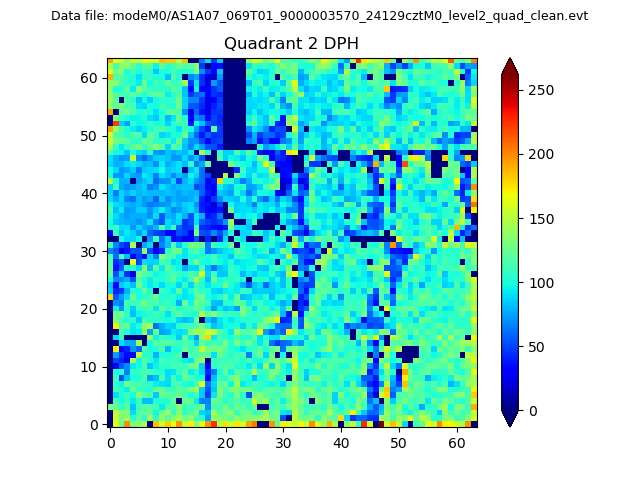
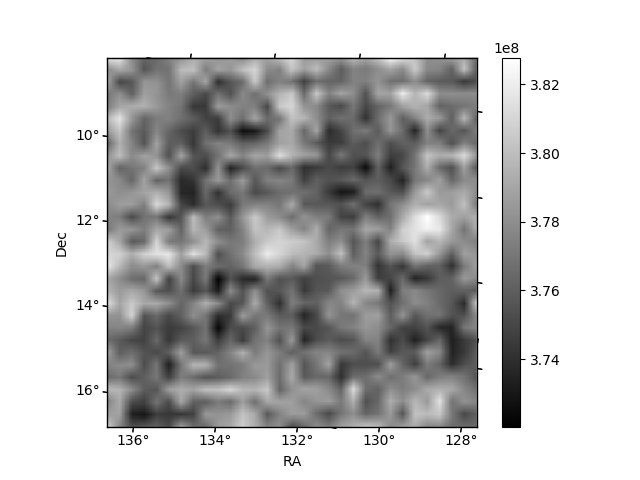
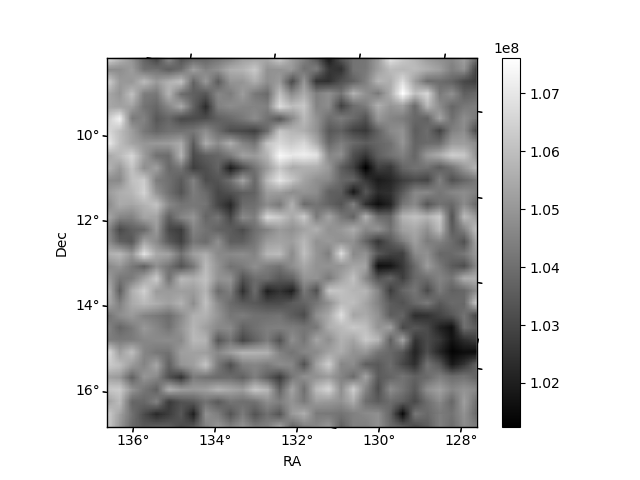
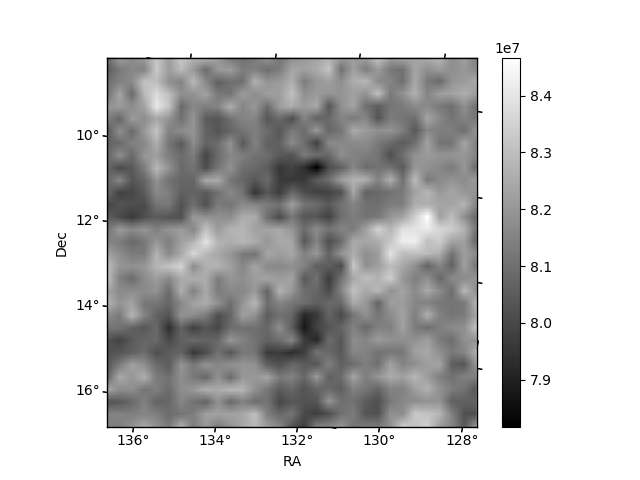
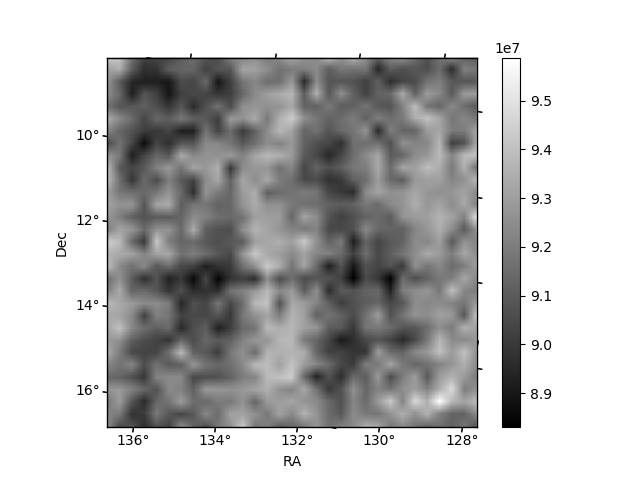
Histogram calculated using DETX and DETY for each event in the final _common_clean file
| Quadrant A | 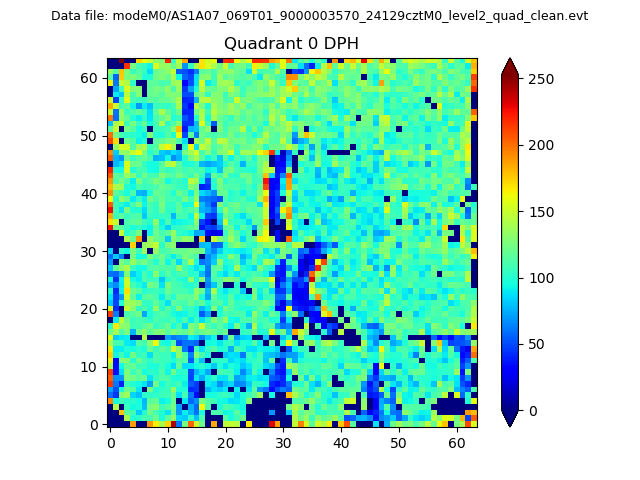 |
 |
Quadrant B |
|---|---|---|---|
| Quadrant D | 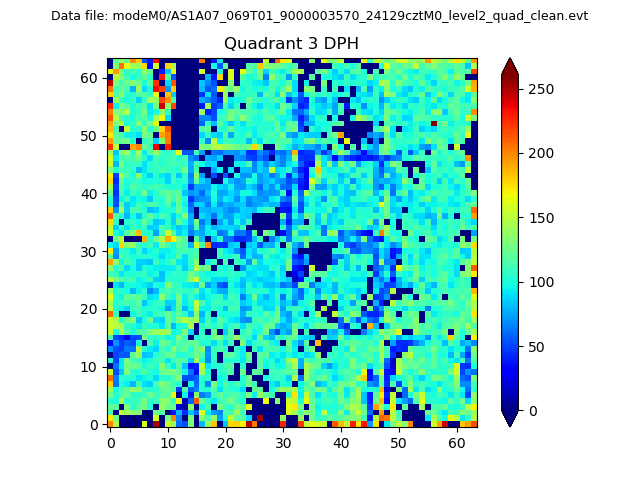 |
 |
Quadrant C |
| Plot type | Count rate plots | Images |
|---|---|---|
| Comparison with Poisson distribution Blue bars denote a histogram of data divided into 1 sec bins. Red curve is a Poisson curve with rate = median count rate of data. |
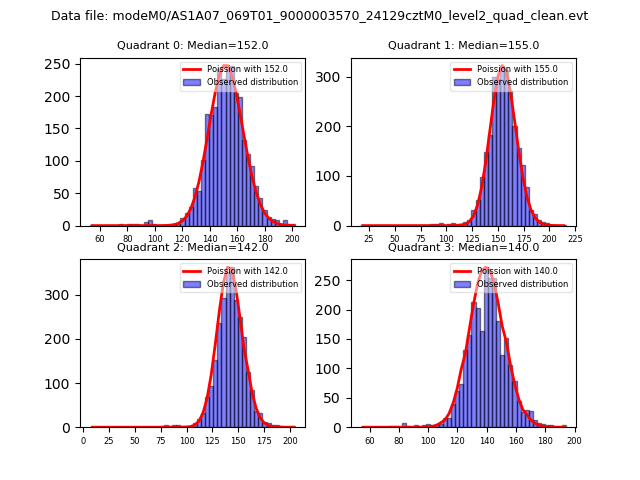 |
 |
| Quadrant-wise count rates Data is divided into 100 sec bins |
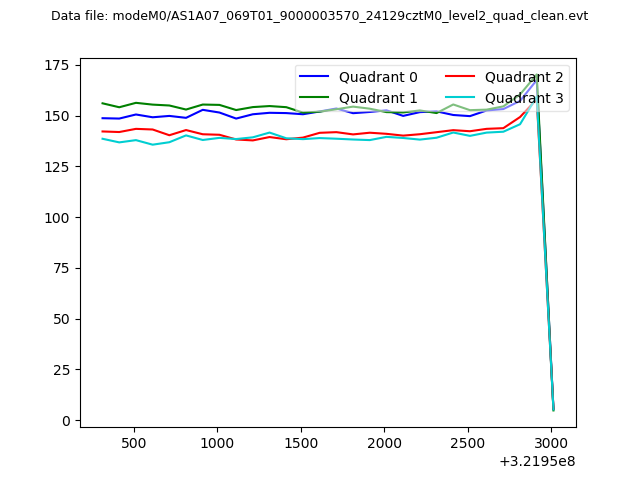 |
|
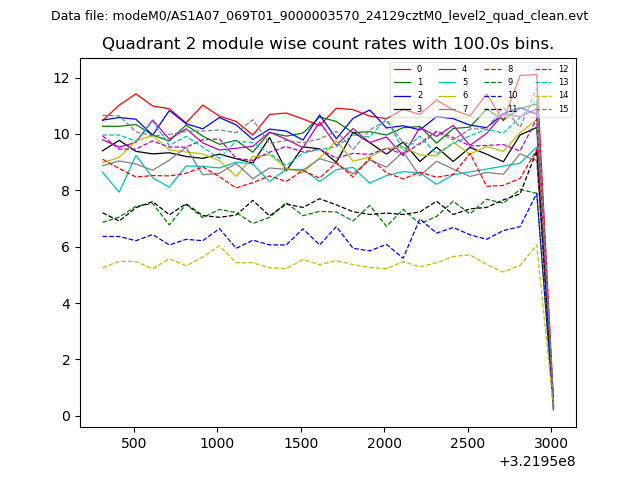
| Module-wise count rates for Quadrant A Data is divided into 100 sec bins |
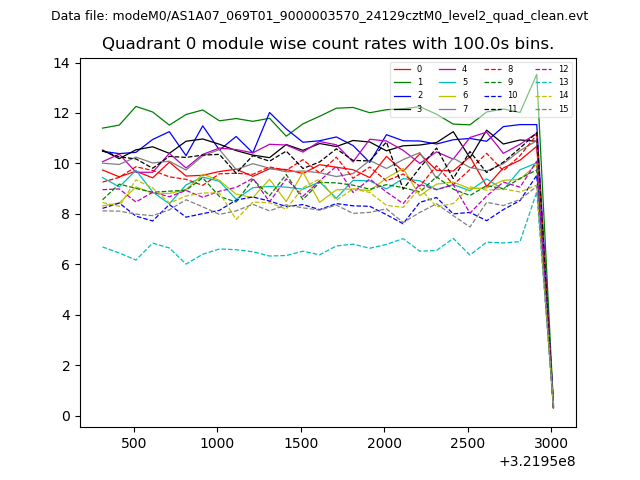 |
 |
| Module-wise count rates for Quadrant B Data is divided into 100 sec bins |
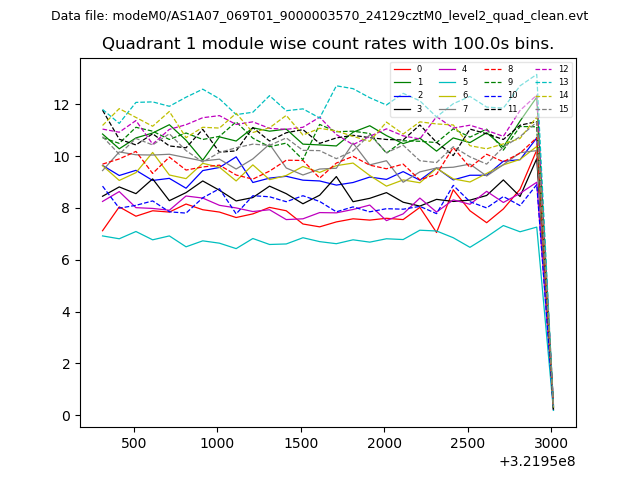 |
 |
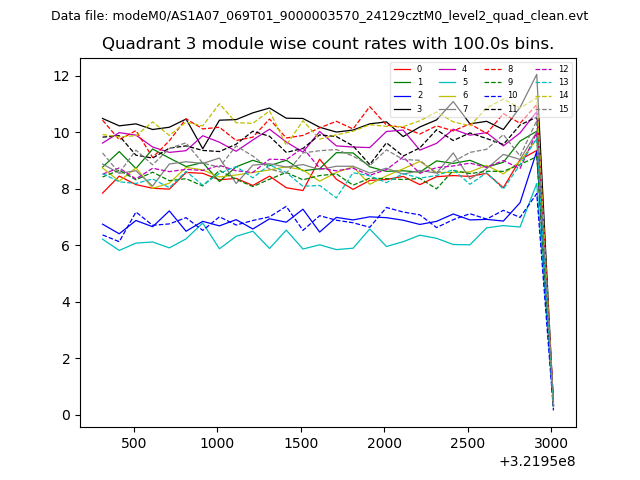
| Module-wise count rates for Quadrant C Data is divided into 100 sec bins |
 |
 |
| Module-wise count rates for Quadrant D Data is divided into 100 sec bins |
 |
 |
| Parameter | Plot |
|---|---|
| CZT HV Monitor | 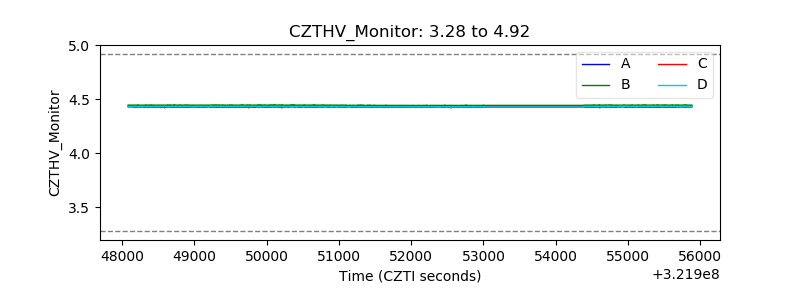 |
| D_VDD | 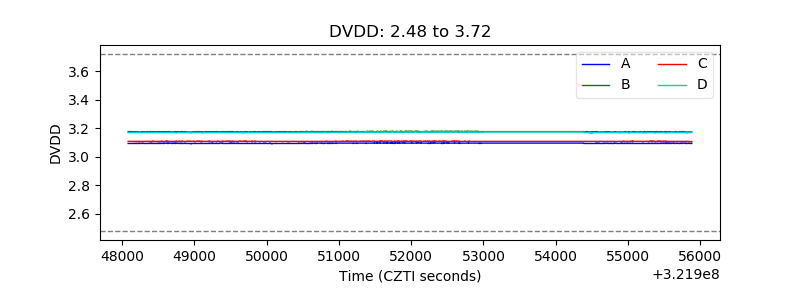 |
| Temperature 1 | 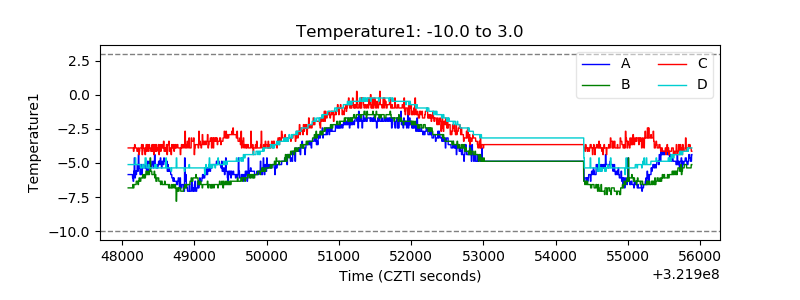 |
| Veto HV Monitor |  |
| Veto LLD | 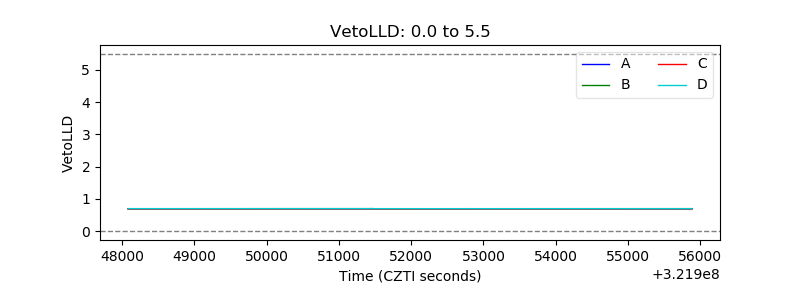 |
| Alpha Counter | 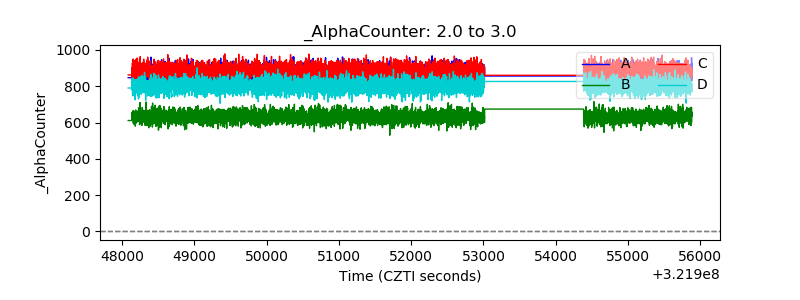 |
| _CPM_Rate | 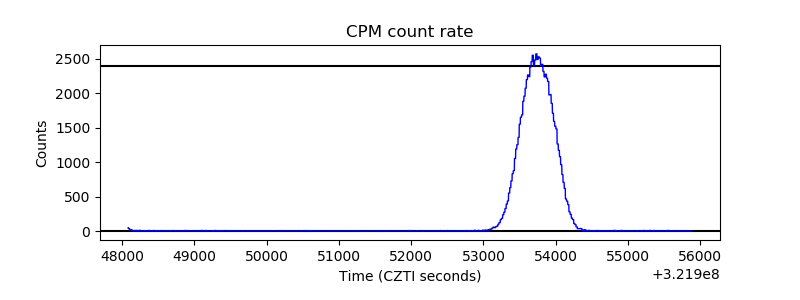 |
| CZT Counter | 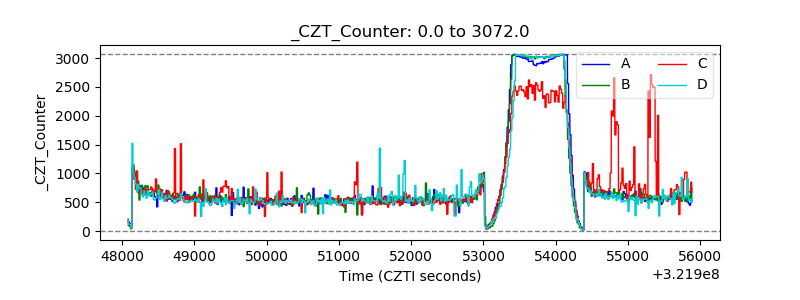 |
| +2.5 Volts monitor |  |
| +5 Volts monitor |  |
| _ROLL_ROT | 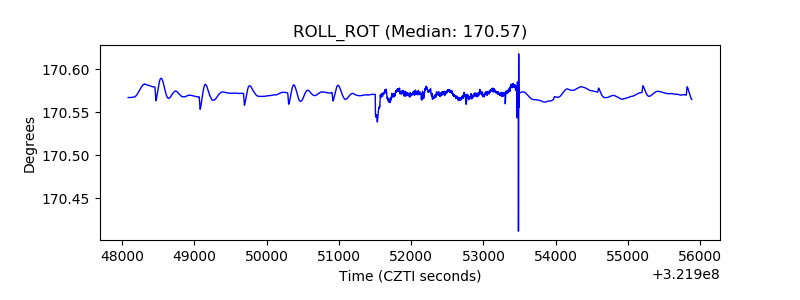 |
| _Roll_DEC | 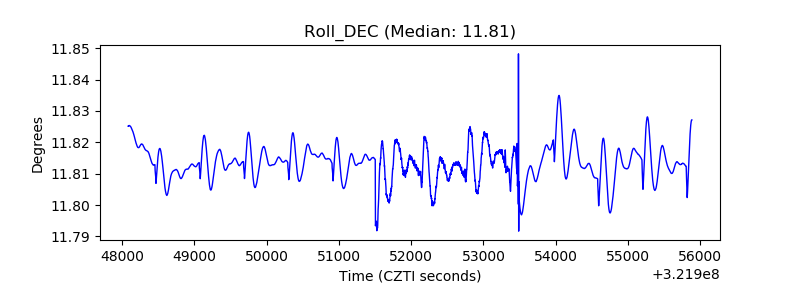 |
| _Roll_RA | 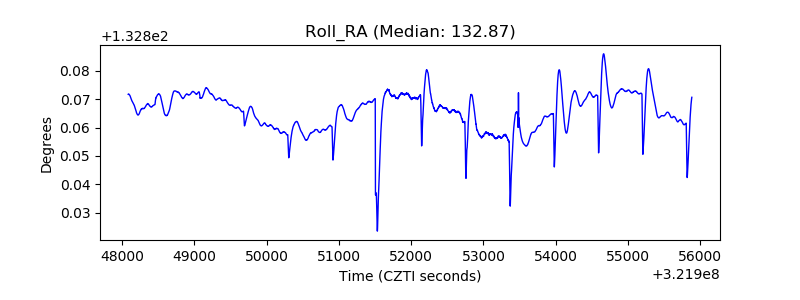 |
| Veto Counter | 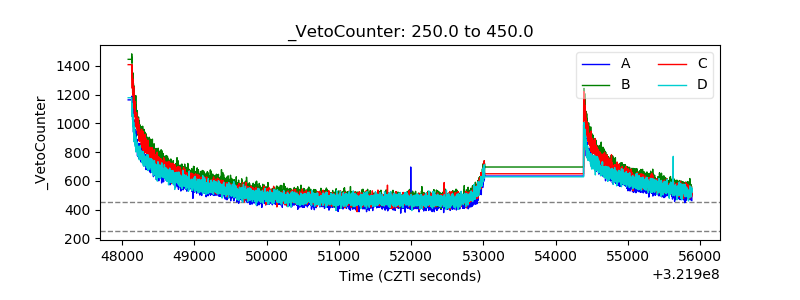 |