| Param | Original file | Final file |
|---|---|---|
| Filename | modeM0/AS1A07_069T01_9000003570_24131cztM0_level2.evt | modeM0/AS1A07_069T01_9000003570_24131cztM0_level2_quad_clean.evt |
| Size (bytes) | 494,743,680 | 91,416,960 |
| Size | 471.8 MB | 87.2 MB |
| Events in quadrant A | 3,629,796 | 593,033 |
| Events in quadrant B | 3,632,489 | 600,847 |
| Events in quadrant C | 3,619,344 | 557,695 |
| Events in quadrant D | 3,651,027 | 554,174 |
| Mode SS | |||
|---|---|---|---|
| Quadrant | BADHDUFLAG | Total packets | Discarded packets |
| A | 0 | 136 | 0 |
| B | 0 | 136 | 0 |
| C | 0 | 136 | 0 |
| D | 0 | 136 | 0 |
| Mode M0 | |||
|---|---|---|---|
| Quadrant | BADHDUFLAG | Total packets | Discarded packets |
| A | 0 | 14614 | 2 |
| B | 0 | 14595 | 2 |
| C | 0 | 14609 | 2 |
| D | 0 | 14627 | 2 |
| Mode M9 | |||
|---|---|---|---|
| Quadrant | BADHDUFLAG | Total packets | Discarded packets |
| A | 0 | 24 | 0 |
| B | 0 | 24 | 0 |
| C | 0 | 24 | 0 |
| D | 0 | 24 | 0 |
| Quadrant | Total seconds | Saturated seconds | Saturation percentage |
|---|---|---|---|
| A | 6638 | 215 | 3.238927% |
| B | 6638 | 217 | 3.269057% |
| C | 6638 | 259 | 3.901778% |
| D | 6638 | 161 | 2.425429% |
Noise dominated data is calculated using 1-second bins in cleaned event files. If a bin has >2000 counts, and if more than 50% of those come from <1% of pixels, then it is considered to be noise-dominated and hence unusable.
| Quadrant | # 1 sec bins | Bins with >0 counts | Bins with >2000 counts | High rate bins dominated by noise | Noise dominated (total time) | Noise dominated (detector-on time) | Marked lightcurve |
|---|---|---|---|---|---|---|---|
| A | 9023 | 6638 | 0 | 0 | 0.00% | 0.00% |  |
| B | 9023 | 6638 | 2 | 2 | 0.02% | 0.03% |  |
| C | 9023 | 6639 | 6 | 6 | 0.07% | 0.09% |  |
| D | 9023 | 6640 | 13 | 13 | 0.14% | 0.20% |  |
Top three noisy pixels from each quadrant. If the there are fewer than three noisy pixels in the level2.evt file, extra rows are filled as -1
| Pixel properties | Quadrant properties | ||||||
|---|---|---|---|---|---|---|---|
| Quadrant | DetID | PixID | Counts | Sigma | Mean | Median | Sigma |
| A | 6 | 16 | 34470 | 181.51 | 928 | 911 | 184.9 |
| A | 4 | 2 | 13596 | 68.61 | 928 | 911 | 184.9 |
| A | 13 | 254 | 11035 | 54.76 | 928 | 911 | 184.9 |
| B | 0 | 245 | 24402 | 135.45 | 916 | 893 | 173.6 |
| B | 12 | 111 | 20787 | 114.62 | 916 | 893 | 173.6 |
| B | 11 | 111 | 18202 | 99.73 | 916 | 893 | 173.6 |
| C | 14 | 238 | 138266 | 676.72 | 867 | 876 | 203.0 |
| C | 2 | 16 | 55738 | 270.22 | 867 | 876 | 203.0 |
| C | 7 | 247 | 28218 | 134.67 | 867 | 876 | 203.0 |
| D | 8 | 195 | 131689 | 601.05 | 893 | 870 | 217.6 |
| D | 12 | 218 | 41069 | 184.7 | 893 | 870 | 217.6 |
| D | 7 | 238 | 37899 | 170.13 | 893 | 870 | 217.6 |
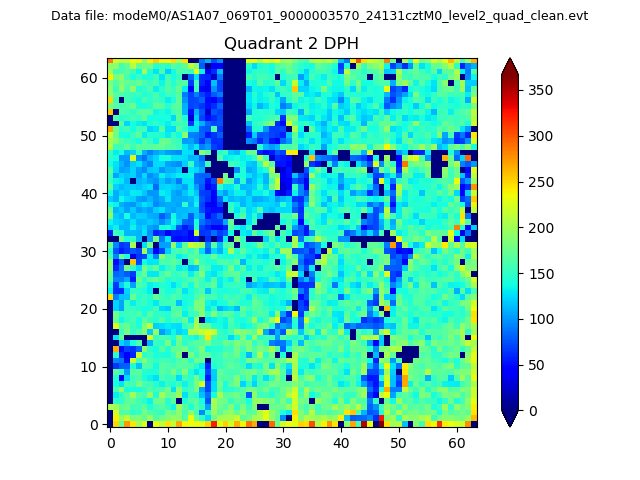
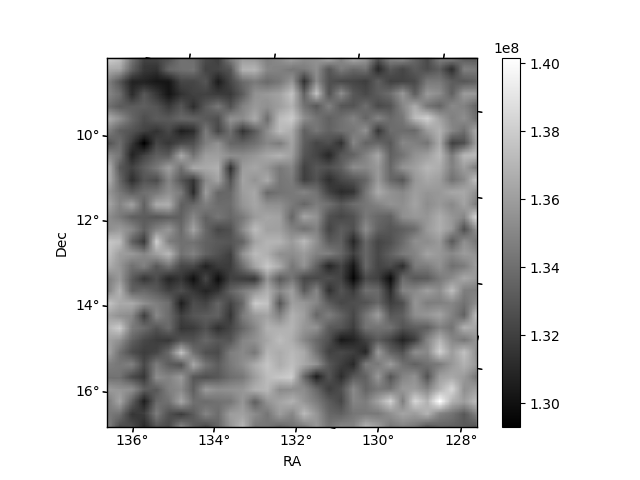
Histogram calculated using DETX and DETY for each event in the final _common_clean file
| Quadrant A | 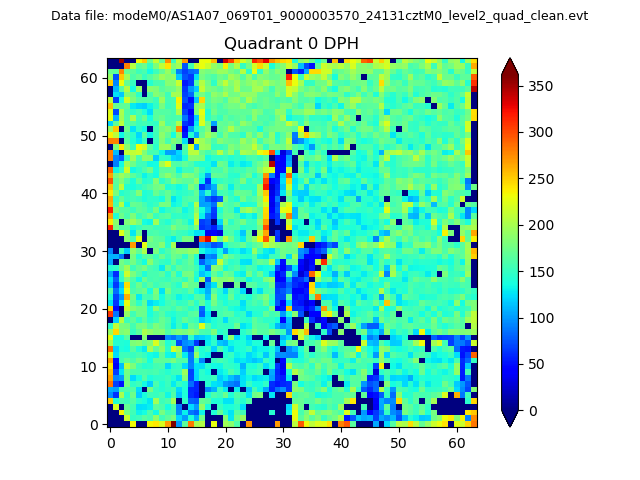 |
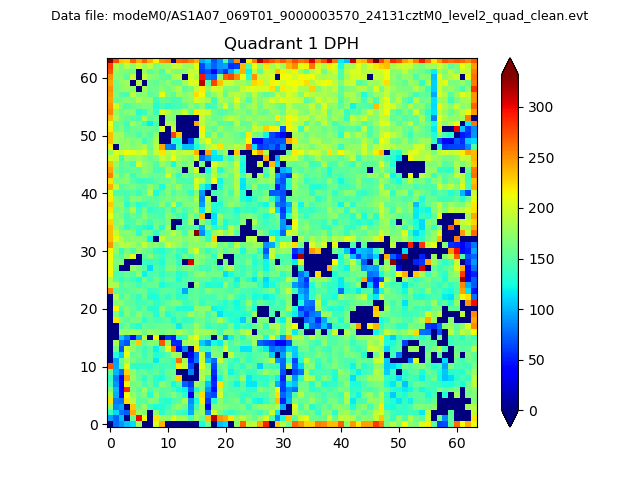 |
Quadrant B |
|---|---|---|---|
| Quadrant D | 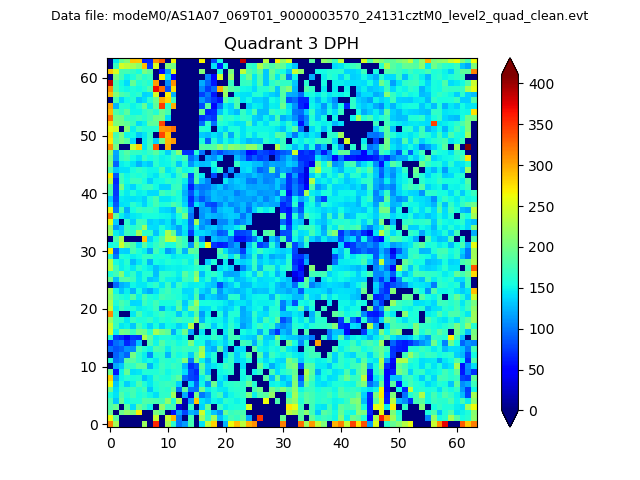 |
 |
Quadrant C |
| Plot type | Count rate plots | Images |
|---|---|---|
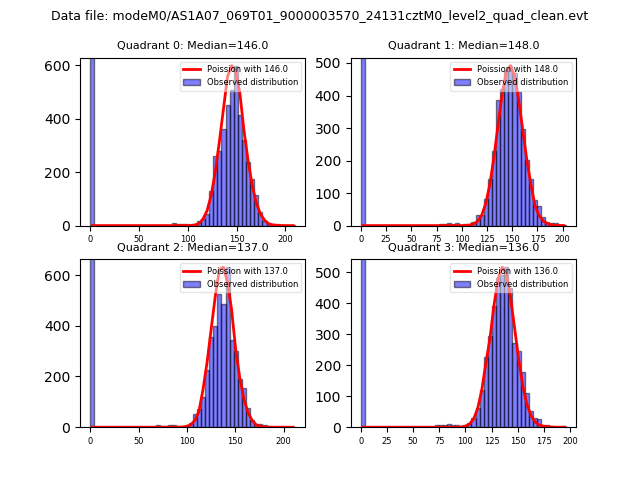
| Comparison with Poisson distribution Blue bars denote a histogram of data divided into 1 sec bins. Red curve is a Poisson curve with rate = median count rate of data. |
 |
 |
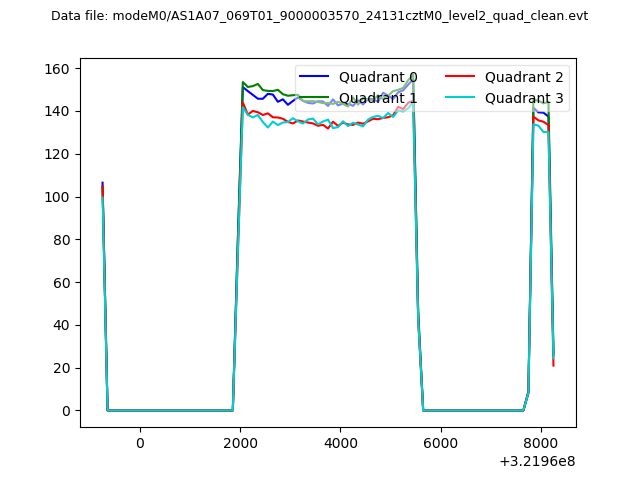
| Quadrant-wise count rates Data is divided into 100 sec bins |
 |
|
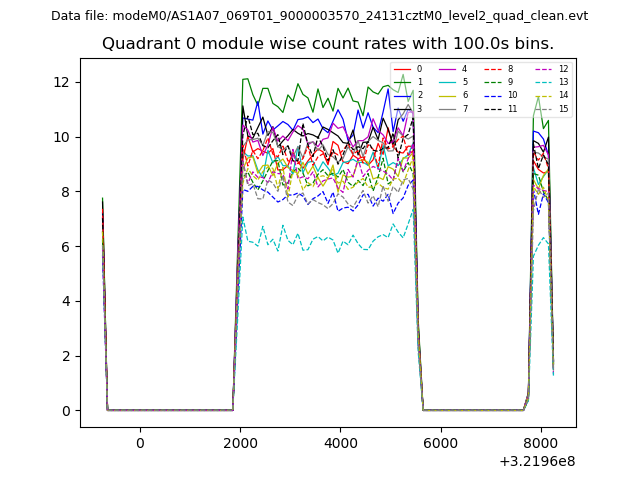
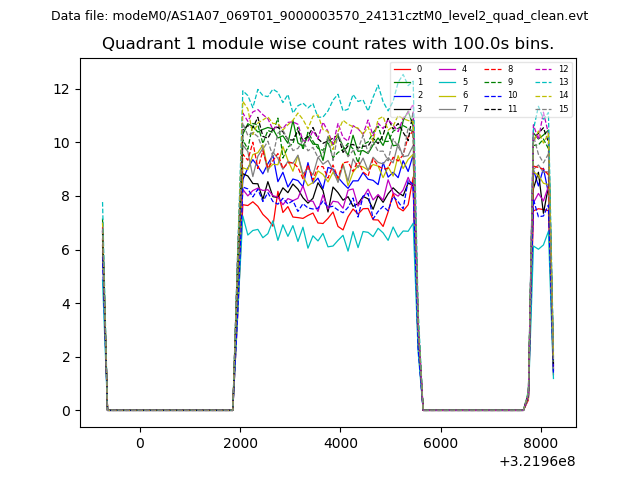
| Module-wise count rates for Quadrant A Data is divided into 100 sec bins |
 |
 |
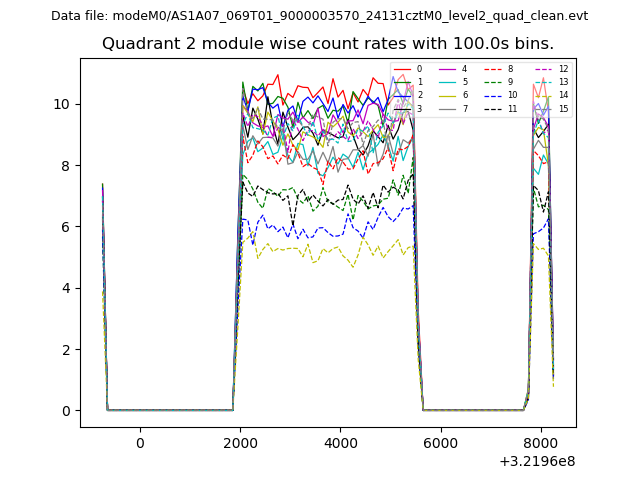
| Module-wise count rates for Quadrant B Data is divided into 100 sec bins |
 |
 |
| Module-wise count rates for Quadrant C Data is divided into 100 sec bins |
 |
 |
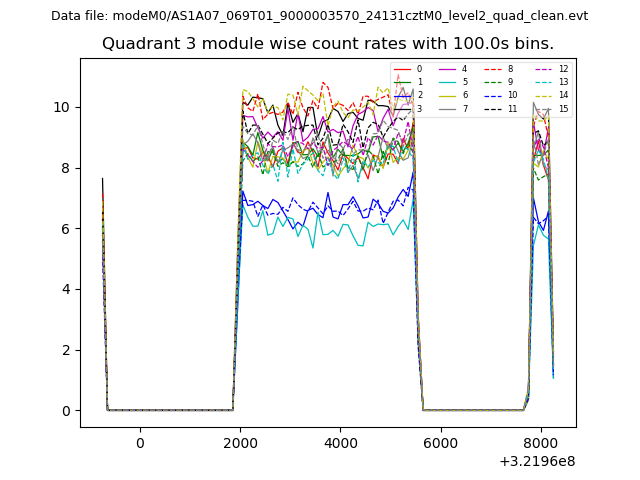
| Module-wise count rates for Quadrant D Data is divided into 100 sec bins |
 |
 |
| Parameter | Plot |
|---|---|
| CZT HV Monitor | 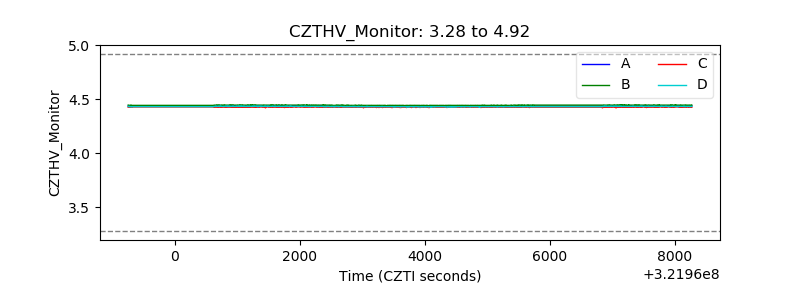 |
| D_VDD |  |
| Temperature 1 | 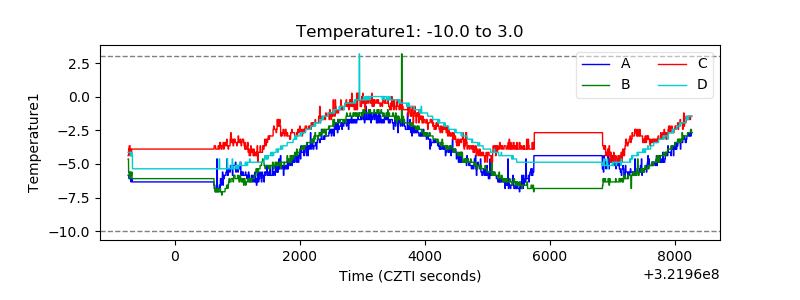 |
| Veto HV Monitor |  |
| Veto LLD | 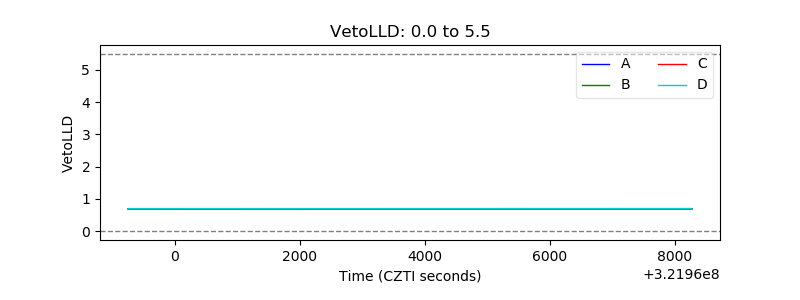 |
| Alpha Counter | 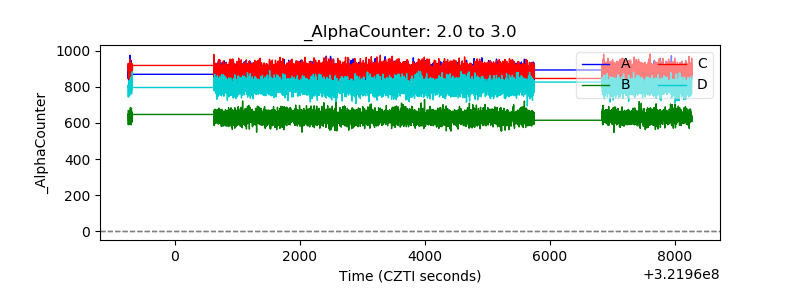 |
| _CPM_Rate | 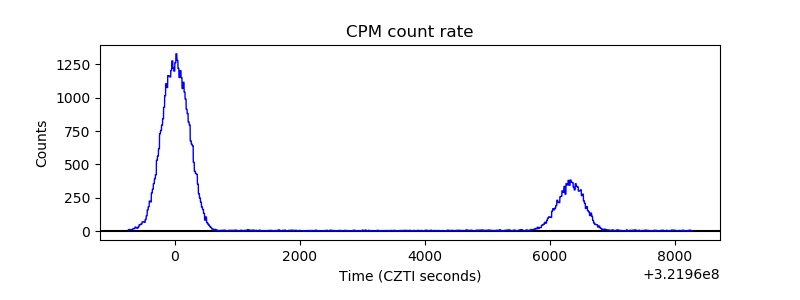 |
| CZT Counter | 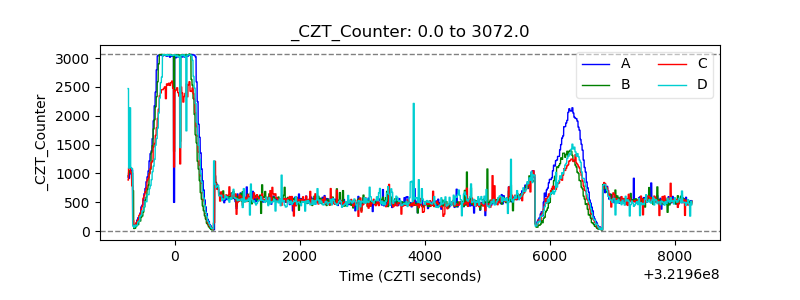 |
| +2.5 Volts monitor |  |
| +5 Volts monitor |  |
| _ROLL_ROT | 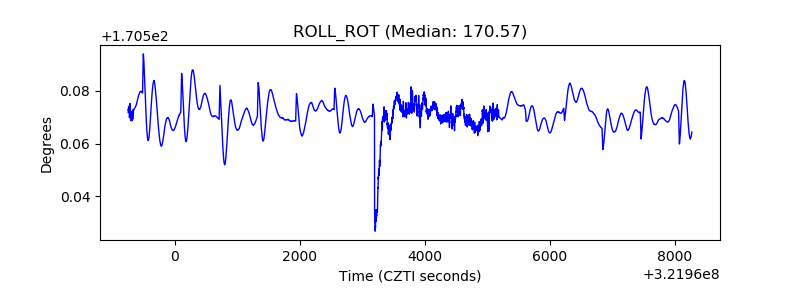 |
| _Roll_DEC | 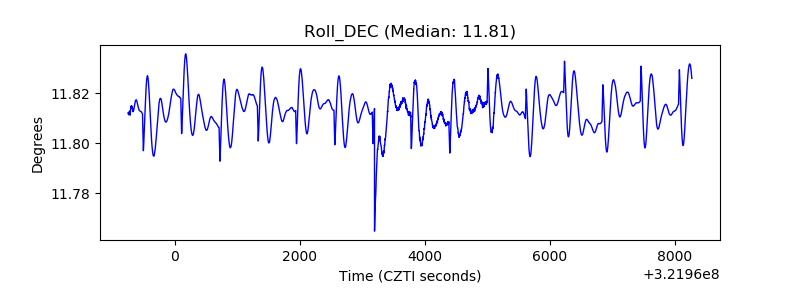 |
| _Roll_RA |  |
| Veto Counter | 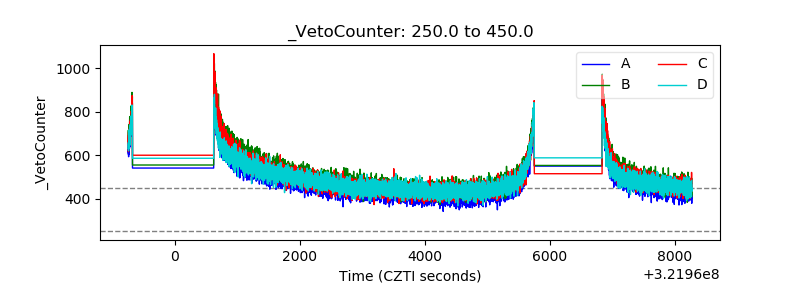 |