| Param | Original file | Final file |
|---|---|---|
| Filename | modeM0/AS1A07_069T01_9000003570_24133cztM0_level2.evt | modeM0/AS1A07_069T01_9000003570_24133cztM0_level2_quad_clean.evt |
| Size (bytes) | 507,119,040 | 99,204,480 |
| Size | 483.6 MB | 94.6 MB |
| Events in quadrant A | 3,569,639 | 644,330 |
| Events in quadrant B | 3,614,631 | 648,159 |
| Events in quadrant C | 3,593,565 | 613,793 |
| Events in quadrant D | 4,099,679 | 605,371 |
| Mode SS | |||
|---|---|---|---|
| Quadrant | BADHDUFLAG | Total packets | Discarded packets |
| A | 0 | 144 | 0 |
| B | 0 | 144 | 0 |
| C | 0 | 144 | 0 |
| D | 0 | 144 | 0 |
| Mode M0 | |||
|---|---|---|---|
| Quadrant | BADHDUFLAG | Total packets | Discarded packets |
| A | 0 | 14866 | 1 |
| B | 0 | 14988 | 1 |
| C | 0 | 14978 | 1 |
| D | 0 | 16489 | 1 |
| Mode M9 | |||
|---|---|---|---|
| Quadrant | BADHDUFLAG | Total packets | Discarded packets |
| A | 0 | 3 | 0 |
| B | 0 | 3 | 0 |
| C | 0 | 3 | 0 |
| D | 0 | 3 | 0 |
| Quadrant | Total seconds | Saturated seconds | Saturation percentage |
|---|---|---|---|
| A | 7074 | 189 | 2.671756% |
| B | 7074 | 201 | 2.841391% |
| C | 7074 | 232 | 3.279615% |
| D | 7074 | 219 | 3.095844% |
Noise dominated data is calculated using 1-second bins in cleaned event files. If a bin has >2000 counts, and if more than 50% of those come from <1% of pixels, then it is considered to be noise-dominated and hence unusable.
| Quadrant | # 1 sec bins | Bins with >0 counts | Bins with >2000 counts | High rate bins dominated by noise | Noise dominated (total time) | Noise dominated (detector-on time) | Marked lightcurve |
|---|---|---|---|---|---|---|---|
| A | 7330 | 7076 | 0 | 0 | 0.00% | 0.00% | 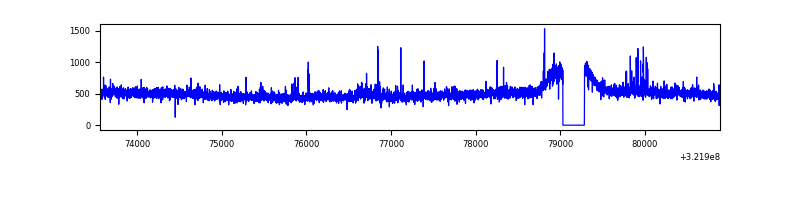 |
| B | 7330 | 7076 | 10 | 10 | 0.14% | 0.14% | 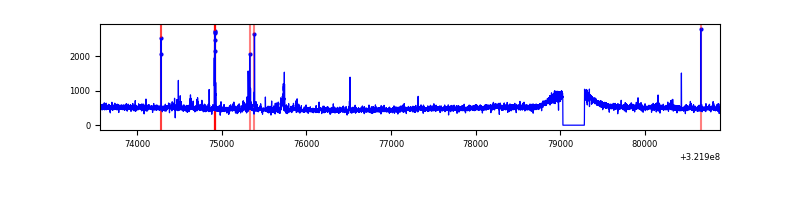 |
| C | 7330 | 7075 | 17 | 17 | 0.23% | 0.24% | 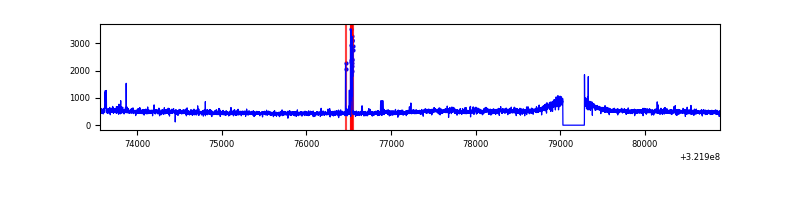 |
| D | 7330 | 7075 | 80 | 80 | 1.09% | 1.13% | 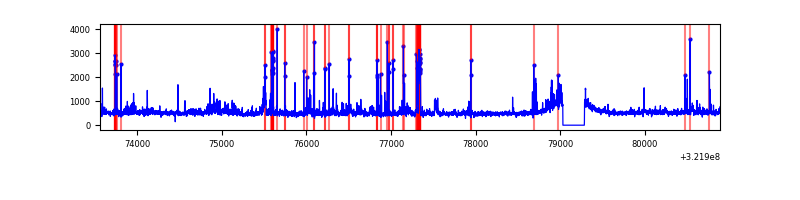 |
Top three noisy pixels from each quadrant. If the there are fewer than three noisy pixels in the level2.evt file, extra rows are filled as -1
| Pixel properties | Quadrant properties | ||||||
|---|---|---|---|---|---|---|---|
| Quadrant | DetID | PixID | Counts | Sigma | Mean | Median | Sigma |
| A | 6 | 16 | 76513 | 412.5 | 901 | 880 | 183.4 |
| A | 2 | 250 | 12915 | 65.64 | 901 | 880 | 183.4 |
| A | 13 | 254 | 12149 | 61.46 | 901 | 880 | 183.4 |
| B | 0 | 229 | 57238 | 327.42 | 892 | 870 | 172.2 |
| B | 12 | 111 | 21023 | 117.06 | 892 | 870 | 172.2 |
| B | 0 | 189 | 19300 | 107.05 | 892 | 870 | 172.2 |
| C | 14 | 238 | 134167 | 668.85 | 852 | 856 | 199.3 |
| C | 0 | 239 | 68393 | 338.85 | 852 | 856 | 199.3 |
| C | 10 | 91 | 28080 | 136.59 | 852 | 856 | 199.3 |
| D | 1 | 52 | 341852 | 1593.8 | 873 | 849 | 214.0 |
| D | 8 | 195 | 306907 | 1430.47 | 873 | 849 | 214.0 |
| D | 7 | 238 | 66762 | 308.07 | 873 | 849 | 214.0 |
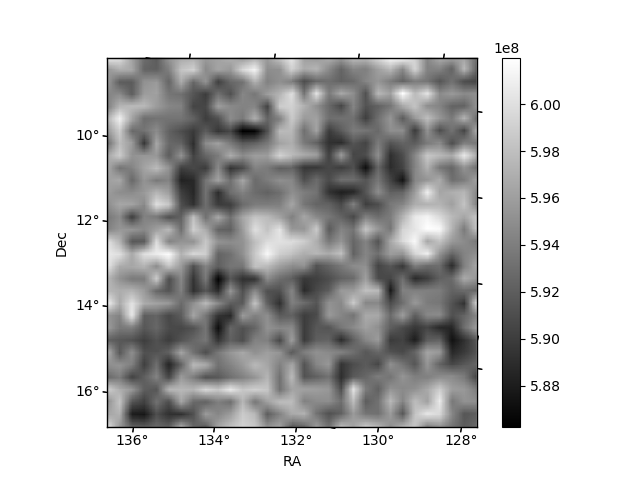
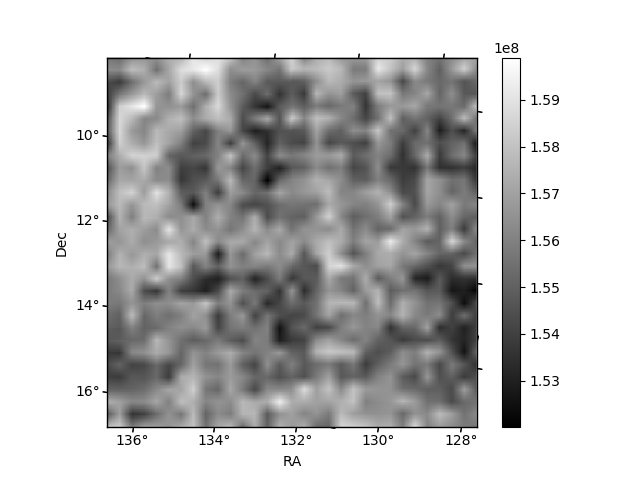
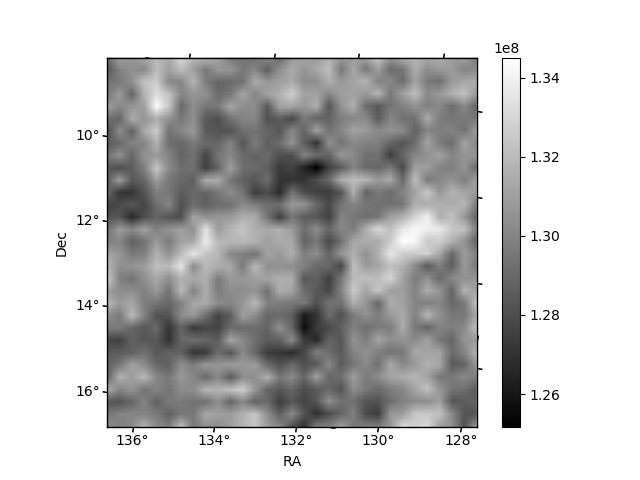
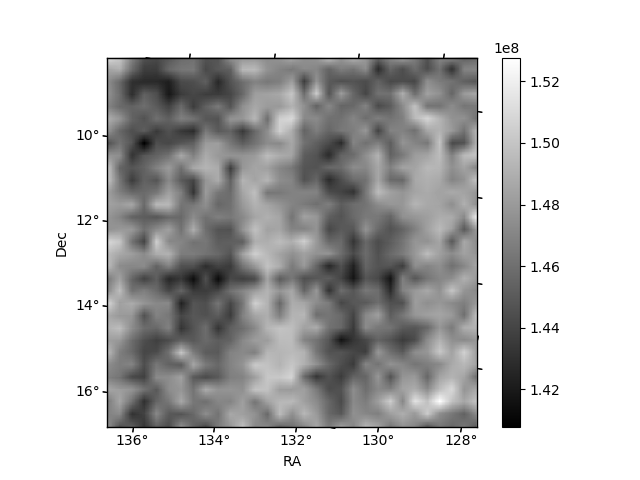
Histogram calculated using DETX and DETY for each event in the final _common_clean file
| Quadrant A | 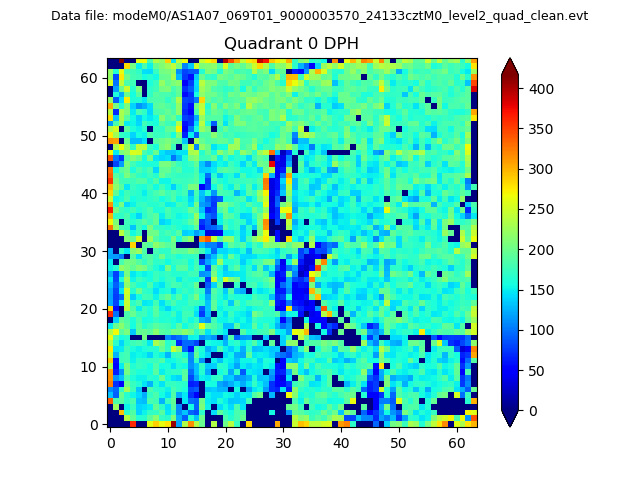 |
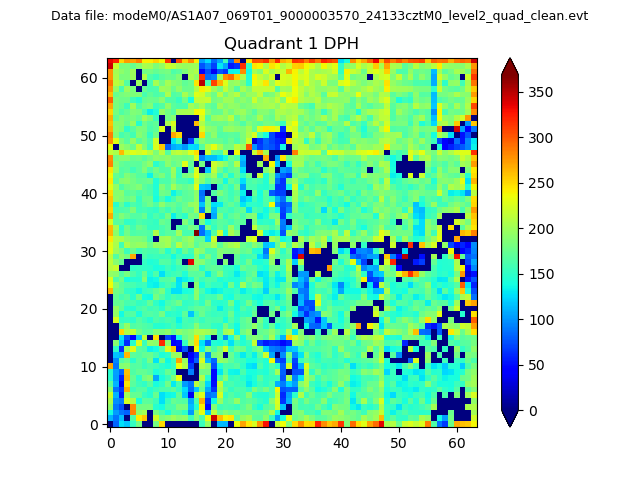 |
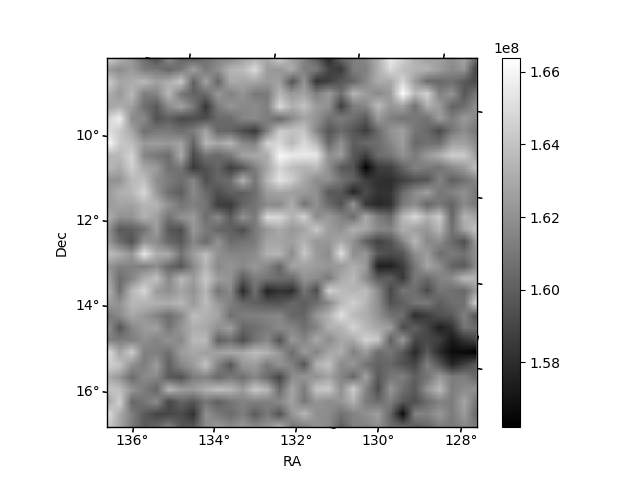
Quadrant B |
|---|---|---|---|
| Quadrant D | 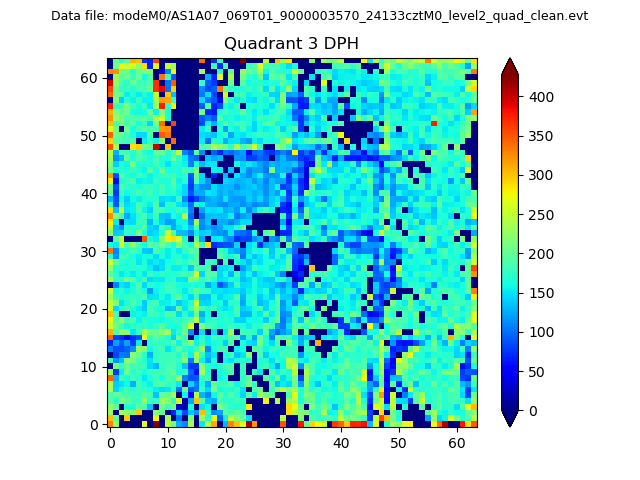 |
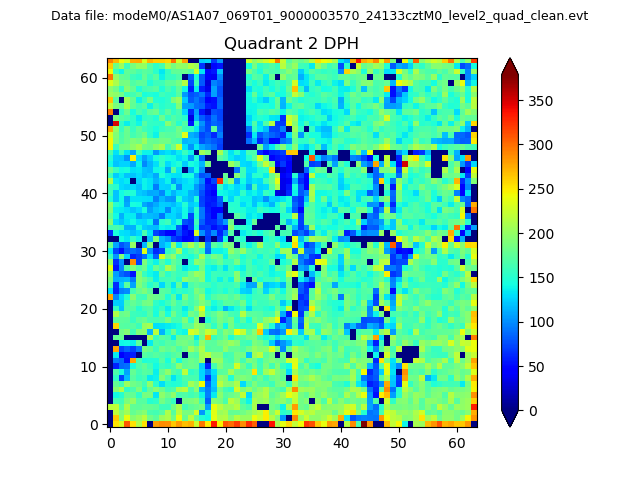 |
Quadrant C |
| Plot type | Count rate plots | Images |
|---|---|---|
| Comparison with Poisson distribution Blue bars denote a histogram of data divided into 1 sec bins. Red curve is a Poisson curve with rate = median count rate of data. |
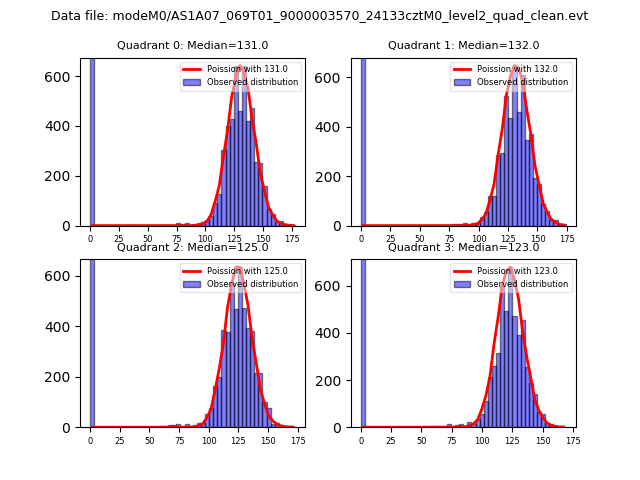 |
 |
| Quadrant-wise count rates Data is divided into 100 sec bins |
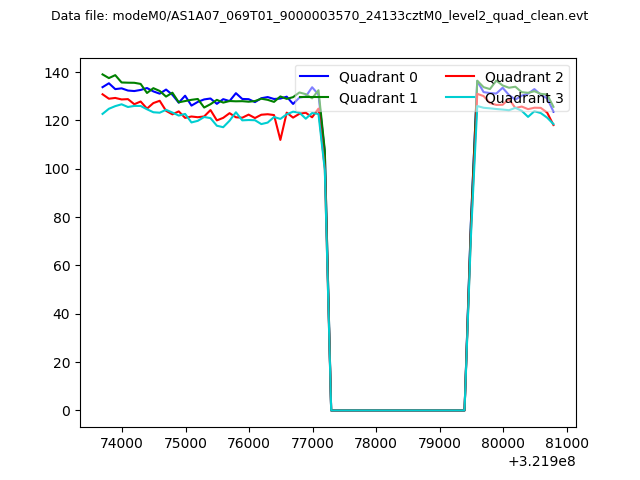 |
|
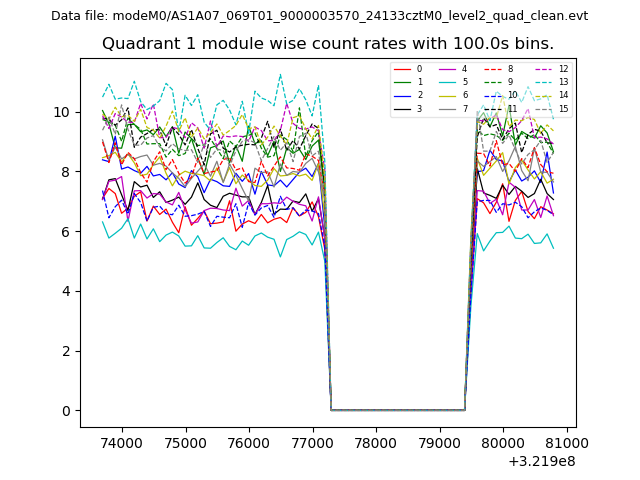
| Module-wise count rates for Quadrant A Data is divided into 100 sec bins |
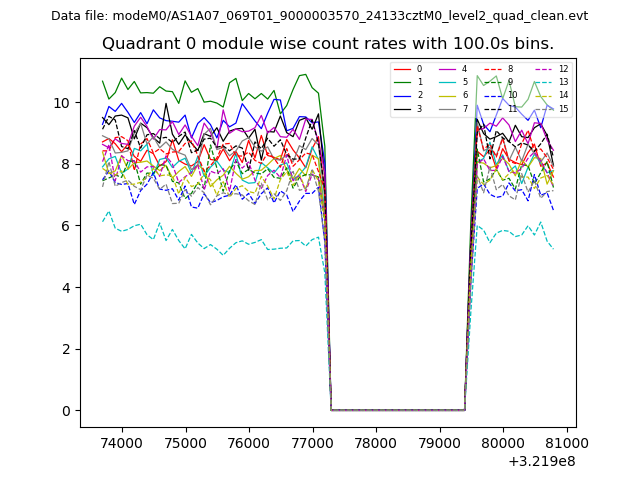 |
 |
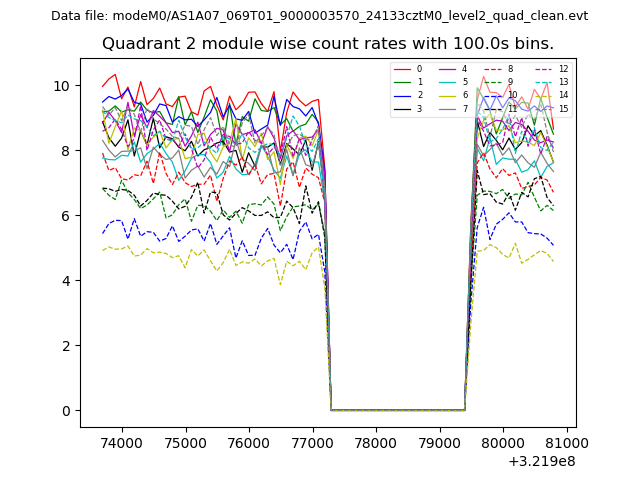
| Module-wise count rates for Quadrant B Data is divided into 100 sec bins |
 |
 |
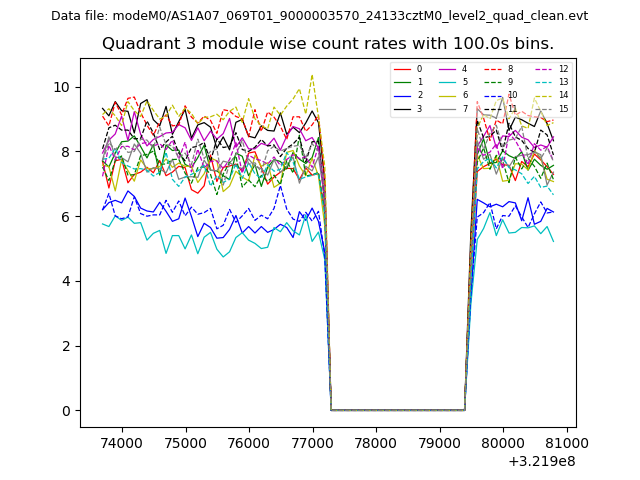
| Module-wise count rates for Quadrant C Data is divided into 100 sec bins |
 |
 |
| Module-wise count rates for Quadrant D Data is divided into 100 sec bins |
 |
 |
| Parameter | Plot |
|---|---|
| CZT HV Monitor | 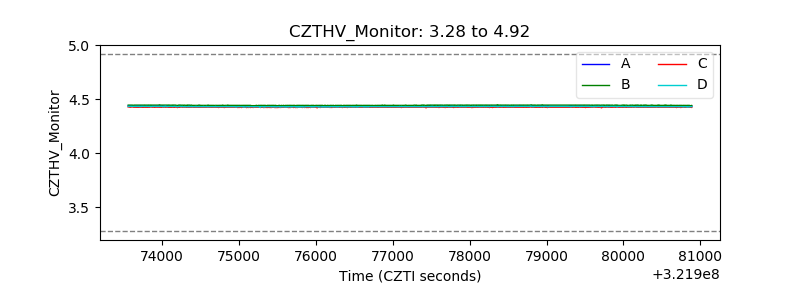 |
| D_VDD | 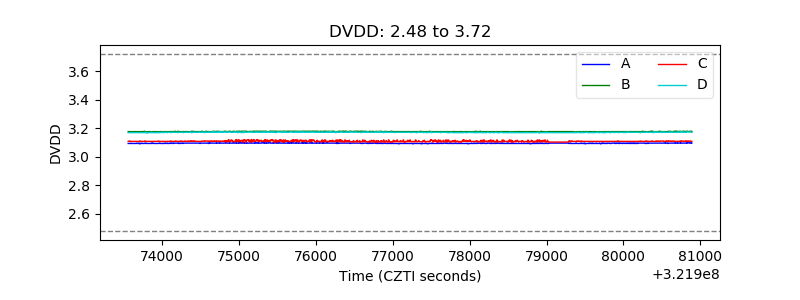 |
| Temperature 1 | 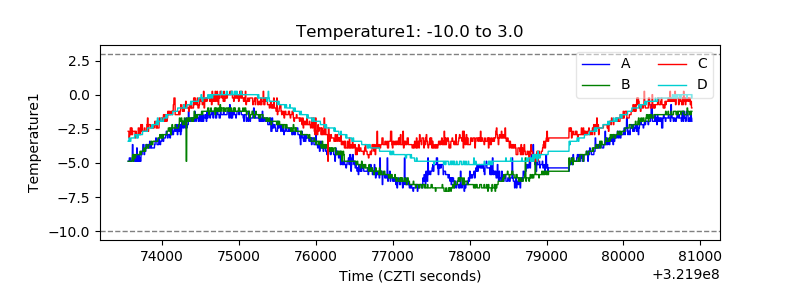 |
| Veto HV Monitor | 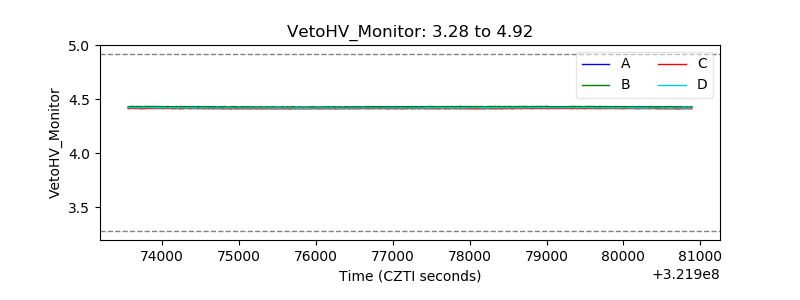 |
| Veto LLD | 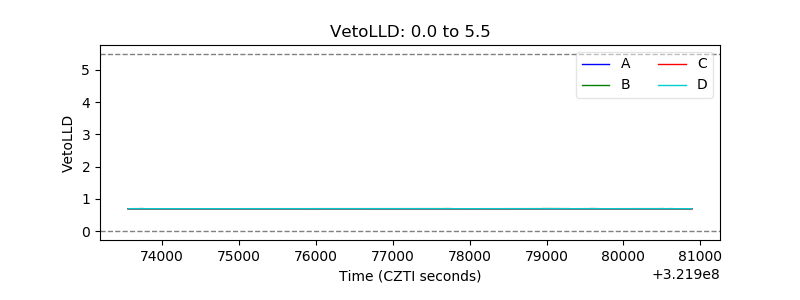 |
| Alpha Counter | 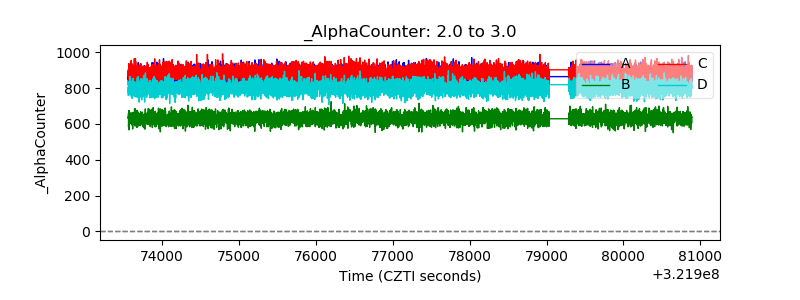 |
| _CPM_Rate | 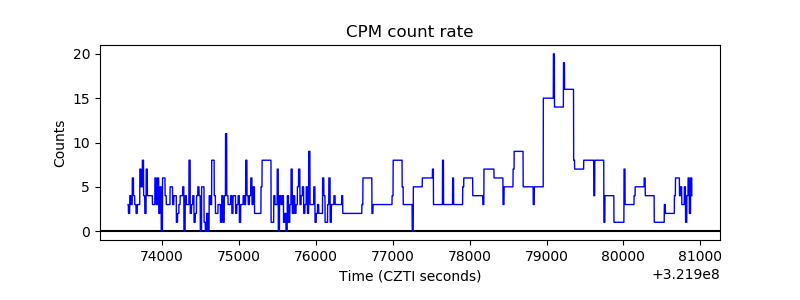 |
| CZT Counter | 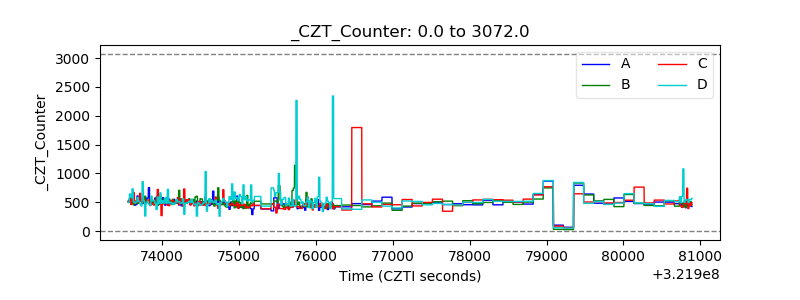 |
| +2.5 Volts monitor |  |
| +5 Volts monitor |  |
| _ROLL_ROT | 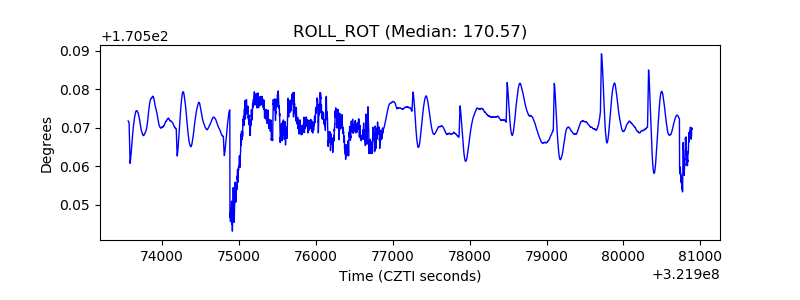 |
| _Roll_DEC | 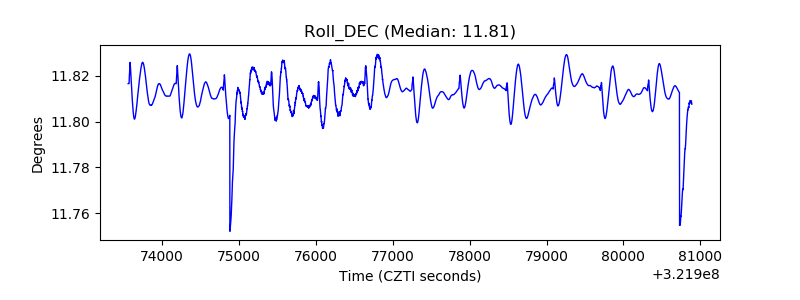 |
| _Roll_RA | 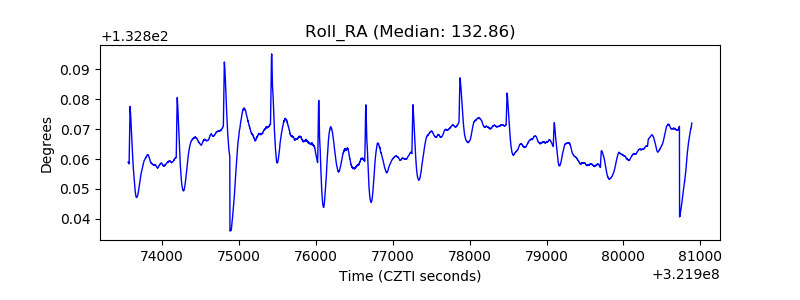 |
| Veto Counter | 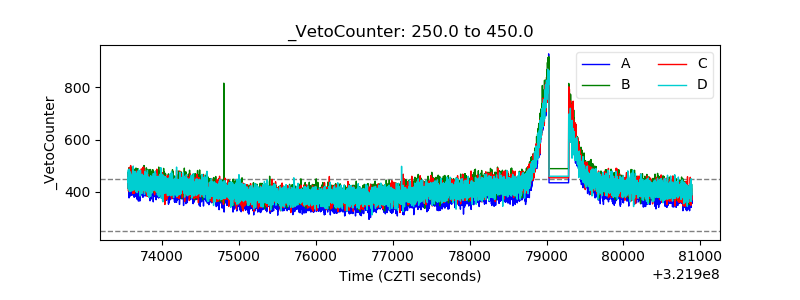 |