| Param | Original file | Final file |
|---|---|---|
| Filename | modeM0/AS1A07_069T01_9000003570_24134cztM0_level2.evt | modeM0/AS1A07_069T01_9000003570_24134cztM0_level2_quad_clean.evt |
| Size (bytes) | 508,023,360 | 101,266,560 |
| Size | 484.5 MB | 96.6 MB |
| Events in quadrant A | 3,629,903 | 653,524 |
| Events in quadrant B | 3,703,879 | 656,537 |
| Events in quadrant C | 3,696,801 | 625,446 |
| Events in quadrant D | 3,857,151 | 621,119 |
| Mode SS | |||
|---|---|---|---|
| Quadrant | BADHDUFLAG | Total packets | Discarded packets |
| A | 0 | 148 | 0 |
| B | 0 | 148 | 0 |
| C | 0 | 148 | 0 |
| D | 0 | 148 | 0 |
| Mode M0 | |||
|---|---|---|---|
| Quadrant | BADHDUFLAG | Total packets | Discarded packets |
| A | 0 | 15426 | 1 |
| B | 0 | 15526 | 1 |
| C | 0 | 15495 | 1 |
| D | 0 | 16125 | 1 |
| Quadrant | Total seconds | Saturated seconds | Saturation percentage |
|---|---|---|---|
| A | 7320 | 227 | 3.101093% |
| B | 7321 | 253 | 3.455812% |
| C | 7321 | 260 | 3.551427% |
| D | 7321 | 181 | 2.472340% |
Noise dominated data is calculated using 1-second bins in cleaned event files. If a bin has >2000 counts, and if more than 50% of those come from <1% of pixels, then it is considered to be noise-dominated and hence unusable.
| Quadrant | # 1 sec bins | Bins with >0 counts | Bins with >2000 counts | High rate bins dominated by noise | Noise dominated (total time) | Noise dominated (detector-on time) | Marked lightcurve |
|---|---|---|---|---|---|---|---|
| A | 7390 | 7320 | 0 | 0 | 0.00% | 0.00% |  |
| B | 7391 | 7321 | 1 | 1 | 0.01% | 0.01% |  |
| C | 7391 | 7322 | 0 | 0 | 0.00% | 0.00% |  |
| D | 7391 | 7322 | 21 | 21 | 0.28% | 0.29% |  |
Top three noisy pixels from each quadrant. If the there are fewer than three noisy pixels in the level2.evt file, extra rows are filled as -1
| Pixel properties | Quadrant properties | ||||||
|---|---|---|---|---|---|---|---|
| Quadrant | DetID | PixID | Counts | Sigma | Mean | Median | Sigma |
| A | 6 | 16 | 20120 | 100.28 | 935 | 914 | 191.5 |
| A | 13 | 254 | 12242 | 59.15 | 935 | 914 | 191.5 |
| A | 3 | 137 | 8494 | 39.58 | 935 | 914 | 191.5 |
| B | 0 | 189 | 55144 | 301.71 | 923 | 900 | 179.8 |
| B | 12 | 111 | 22224 | 118.6 | 923 | 900 | 179.8 |
| B | 11 | 111 | 19430 | 103.06 | 923 | 900 | 179.8 |
| C | 14 | 238 | 138309 | 657.54 | 886 | 891 | 209.0 |
| C | 10 | 91 | 83005 | 392.91 | 886 | 891 | 209.0 |
| C | 0 | 239 | 7218 | 30.27 | 886 | 891 | 209.0 |
| D | 1 | 52 | 189392 | 835.23 | 911 | 884 | 225.7 |
| D | 8 | 195 | 156765 | 690.67 | 911 | 884 | 225.7 |
| D | 2 | 234 | 34501 | 148.95 | 911 | 884 | 225.7 |
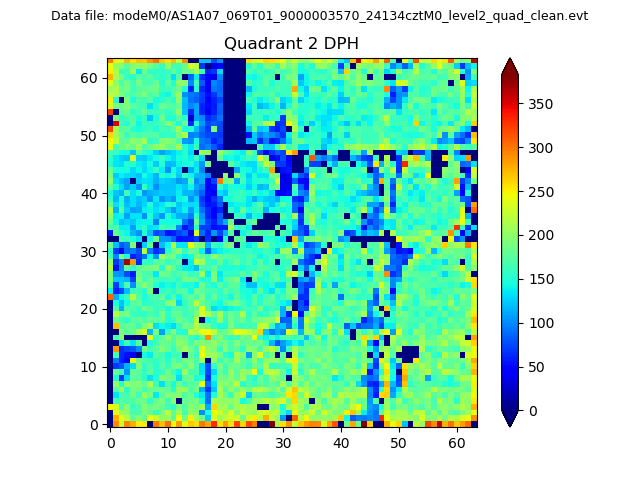
Histogram calculated using DETX and DETY for each event in the final _common_clean file
| Quadrant A | 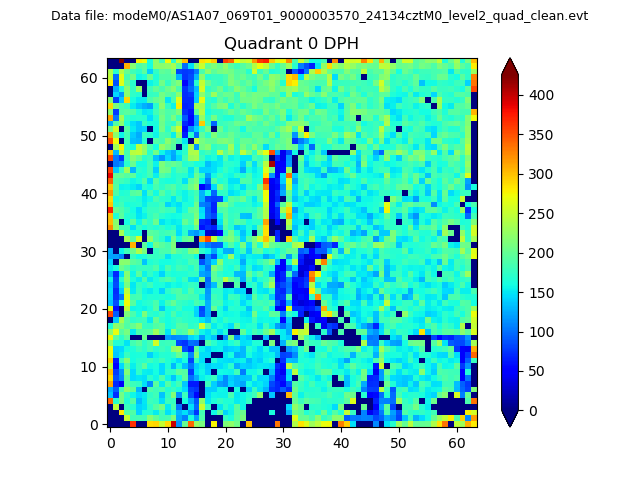 |
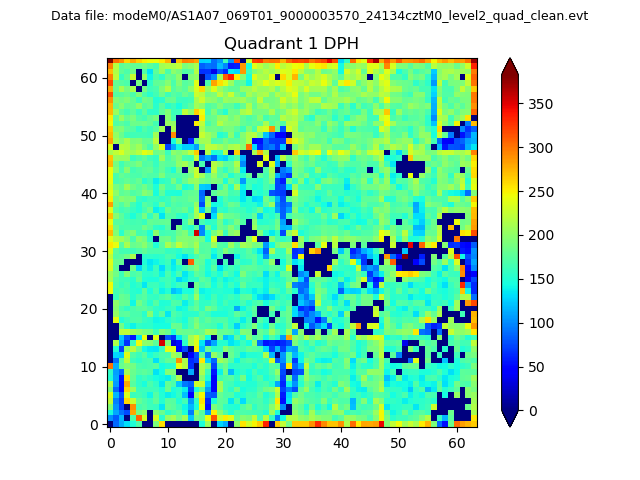 |
Quadrant B |
|---|---|---|---|
| Quadrant D | 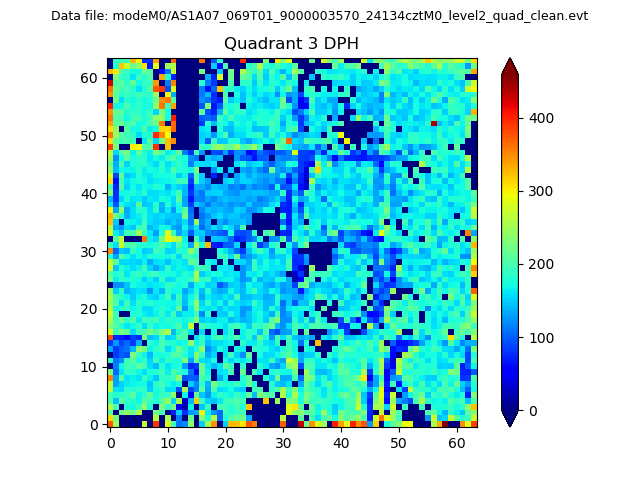 |
 |
Quadrant C |
| Plot type | Count rate plots | Images |
|---|---|---|
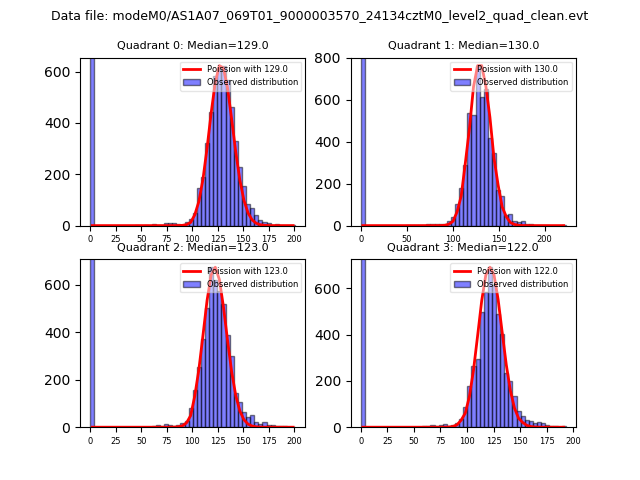
| Comparison with Poisson distribution Blue bars denote a histogram of data divided into 1 sec bins. Red curve is a Poisson curve with rate = median count rate of data. |
 |
 |
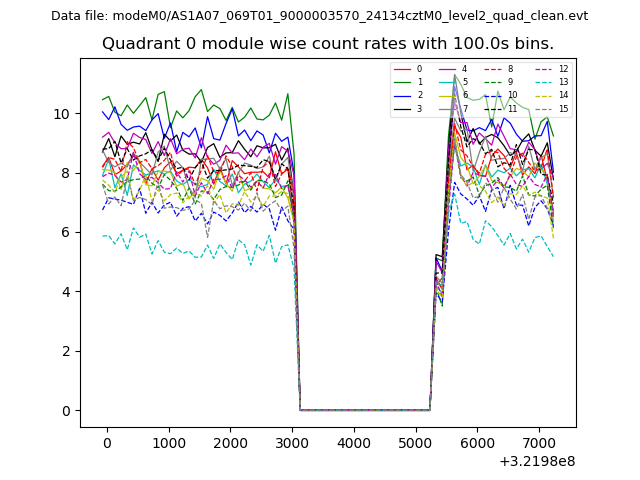
| Quadrant-wise count rates Data is divided into 100 sec bins |
 |
|
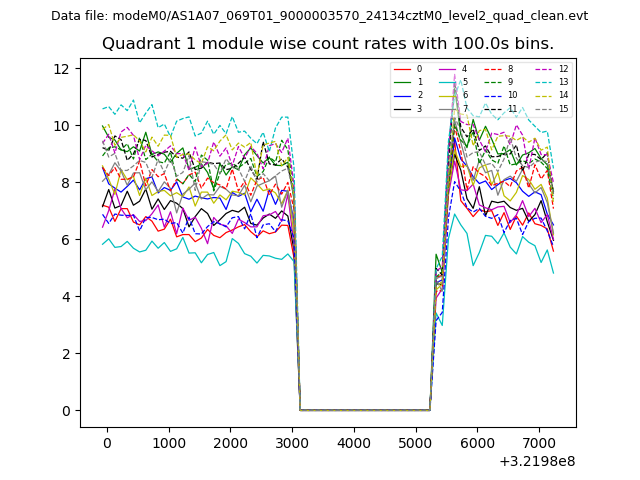
| Module-wise count rates for Quadrant A Data is divided into 100 sec bins |
 |
 |
| Module-wise count rates for Quadrant B Data is divided into 100 sec bins |
 |
 |
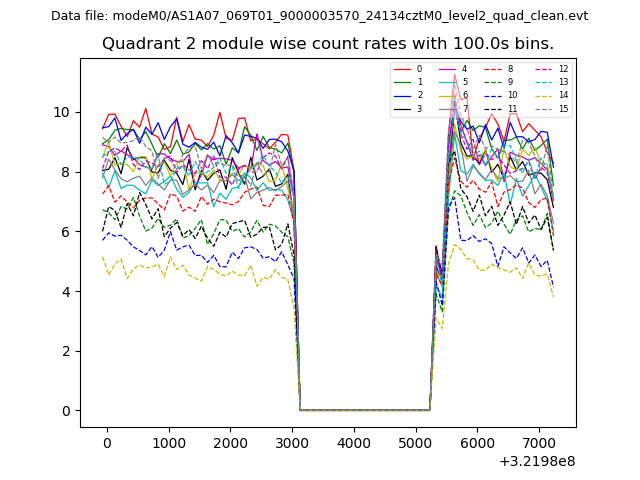
| Module-wise count rates for Quadrant C Data is divided into 100 sec bins |
 |
 |
| Module-wise count rates for Quadrant D Data is divided into 100 sec bins |
 |
 |
| Parameter | Plot |
|---|---|
| CZT HV Monitor | 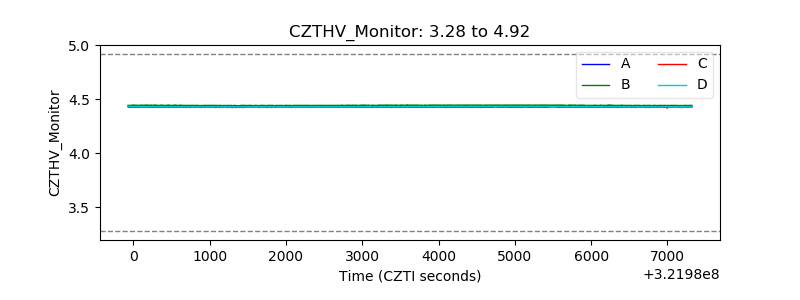 |
| D_VDD | 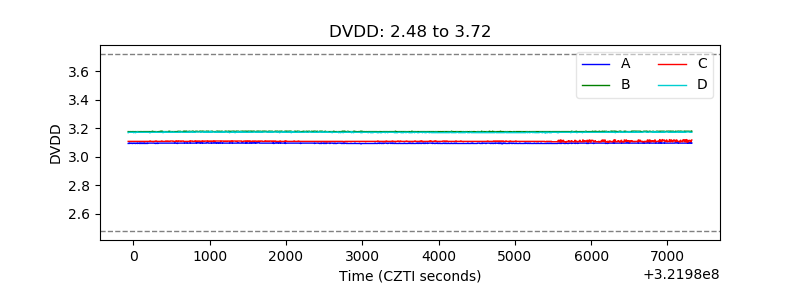 |
| Temperature 1 | 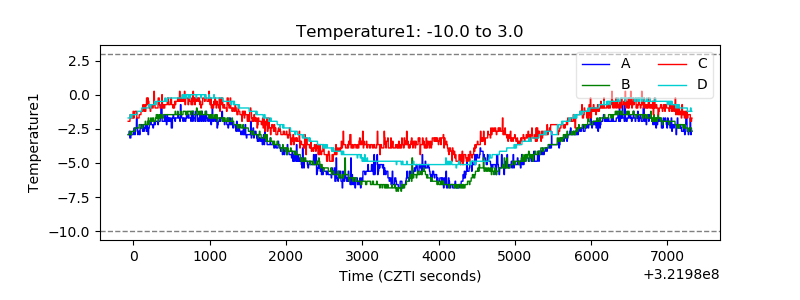 |
| Veto HV Monitor | 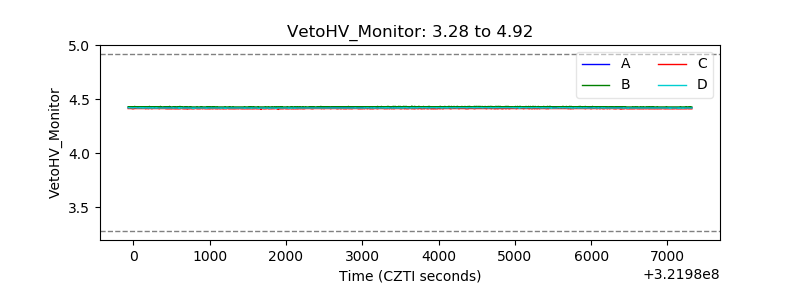 |
| Veto LLD | 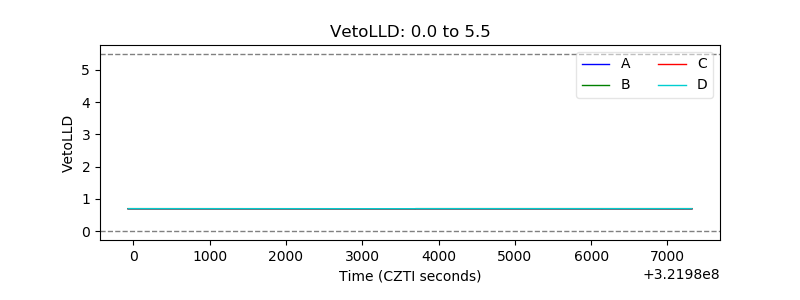 |
| Alpha Counter | 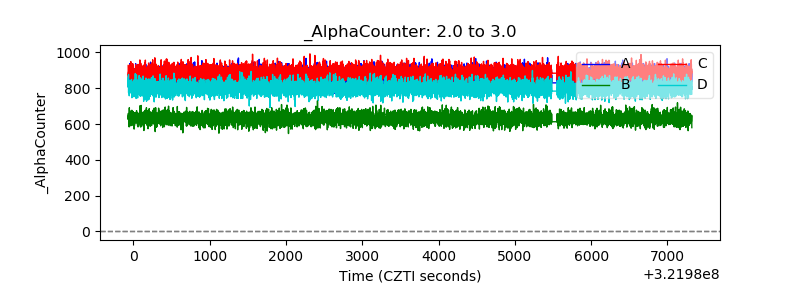 |
| _CPM_Rate | 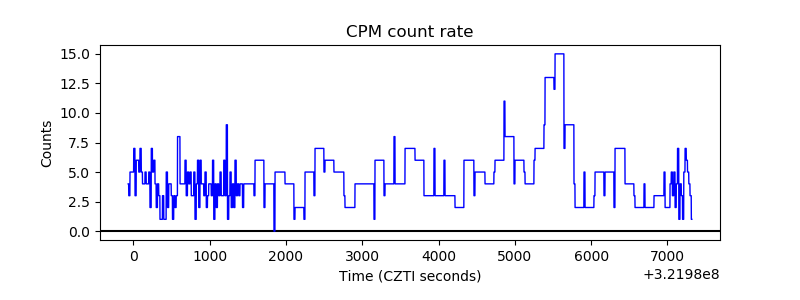 |
| CZT Counter | 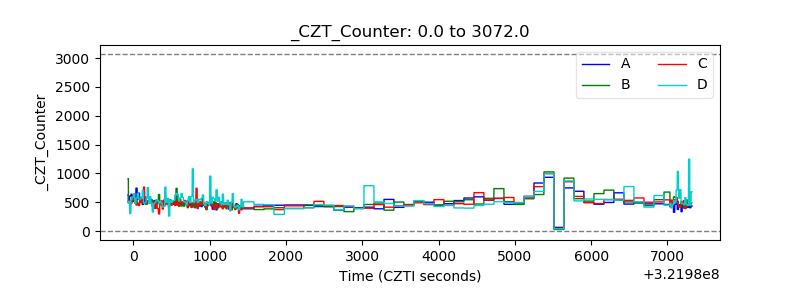 |
| +2.5 Volts monitor |  |
| +5 Volts monitor |  |
| _ROLL_ROT | 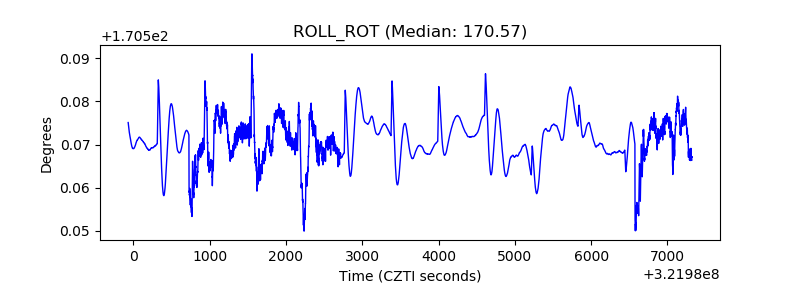 |
| _Roll_DEC | 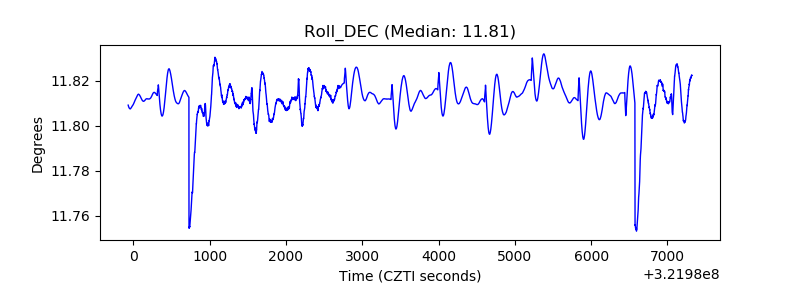 |
| _Roll_RA | 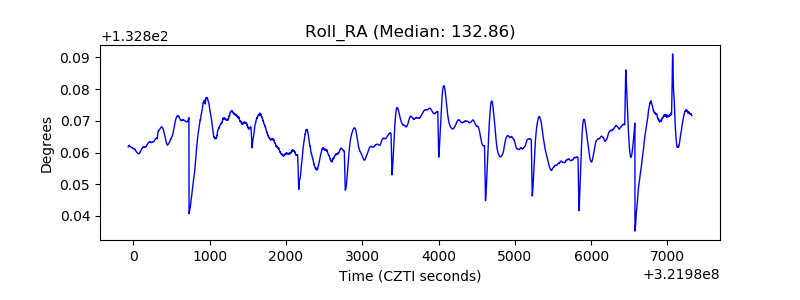 |
| Veto Counter | 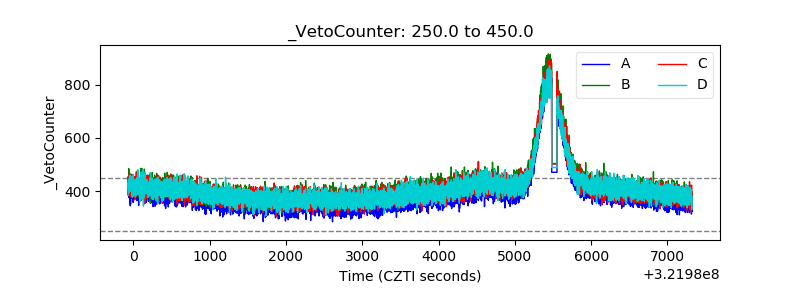 |