| Param | Original file | Final file |
|---|---|---|
| Filename | modeM0/AS1A07_069T01_9000003570_24135cztM0_level2.evt | modeM0/AS1A07_069T01_9000003570_24135cztM0_level2_quad_clean.evt |
| Size (bytes) | 546,880,320 | 105,759,360 |
| Size | 521.5 MB | 100.9 MB |
| Events in quadrant A | 3,738,539 | 685,568 |
| Events in quadrant B | 3,796,316 | 694,334 |
| Events in quadrant C | 3,987,079 | 657,173 |
| Events in quadrant D | 4,526,456 | 638,908 |
| Mode SS | |||
|---|---|---|---|
| Quadrant | BADHDUFLAG | Total packets | Discarded packets |
| A | 0 | 154 | 0 |
| B | 0 | 154 | 0 |
| C | 0 | 154 | 0 |
| D | 0 | 154 | 0 |
| Mode M0 | |||
|---|---|---|---|
| Quadrant | BADHDUFLAG | Total packets | Discarded packets |
| A | 0 | 15913 | 2 |
| B | 0 | 16037 | 2 |
| C | 0 | 16352 | 2 |
| D | 0 | 18433 | 2 |
| Mode M9 | |||
|---|---|---|---|
| Quadrant | BADHDUFLAG | Total packets | Discarded packets |
| A | 0 | 4 | 0 |
| B | 0 | 4 | 0 |
| C | 0 | 4 | 0 |
| D | 0 | 4 | 0 |
| Quadrant | Total seconds | Saturated seconds | Saturation percentage |
|---|---|---|---|
| A | 7566 | 150 | 1.982554% |
| B | 7567 | 179 | 2.365535% |
| C | 7566 | 201 | 2.656622% |
| D | 7566 | 334 | 4.414486% |
Noise dominated data is calculated using 1-second bins in cleaned event files. If a bin has >2000 counts, and if more than 50% of those come from <1% of pixels, then it is considered to be noise-dominated and hence unusable.
| Quadrant | # 1 sec bins | Bins with >0 counts | Bins with >2000 counts | High rate bins dominated by noise | Noise dominated (total time) | Noise dominated (detector-on time) | Marked lightcurve |
|---|---|---|---|---|---|---|---|
| A | 8016 | 7567 | 2 | 2 | 0.02% | 0.03% | 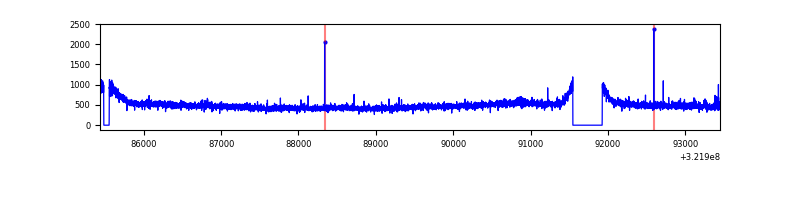 |
| B | 8017 | 7568 | 0 | 0 | 0.00% | 0.00% | 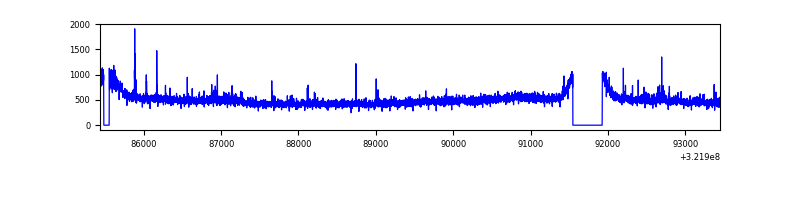 |
| C | 8016 | 7568 | 1 | 1 | 0.01% | 0.01% | 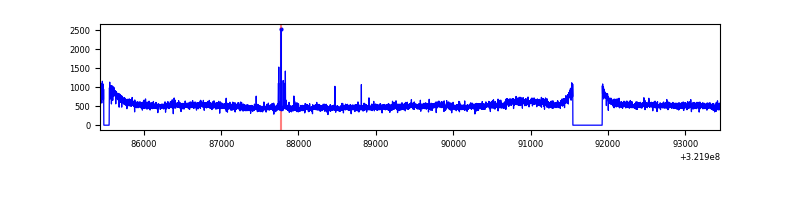 |
| D | 8015 | 7567 | 205 | 205 | 2.56% | 2.71% | 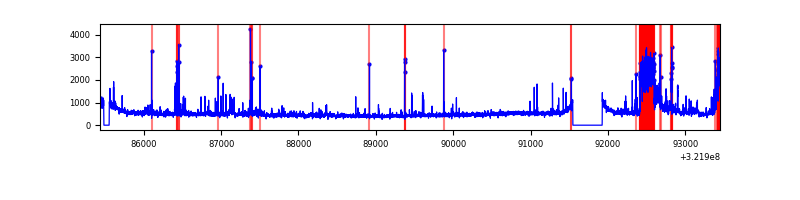 |
Top three noisy pixels from each quadrant. If the there are fewer than three noisy pixels in the level2.evt file, extra rows are filled as -1
| Pixel properties | Quadrant properties | ||||||
|---|---|---|---|---|---|---|---|
| Quadrant | DetID | PixID | Counts | Sigma | Mean | Median | Sigma |
| A | 2 | 250 | 18814 | 91.7 | 961 | 940 | 194.9 |
| A | 3 | 1 | 14128 | 67.66 | 961 | 940 | 194.9 |
| A | 13 | 254 | 13290 | 63.36 | 961 | 940 | 194.9 |
| B | 0 | 189 | 46829 | 247.38 | 949 | 927 | 185.6 |
| B | 12 | 111 | 22692 | 117.3 | 949 | 927 | 185.6 |
| B | 11 | 111 | 20082 | 103.23 | 949 | 927 | 185.6 |
| C | 10 | 91 | 266397 | 1241.06 | 908 | 913 | 213.9 |
| C | 14 | 238 | 142165 | 660.31 | 908 | 913 | 213.9 |
| C | 2 | 16 | 20949 | 93.66 | 908 | 913 | 213.9 |
| D | 7 | 238 | 662135 | 2936.23 | 922 | 897 | 225.2 |
| D | 1 | 52 | 158395 | 699.37 | 922 | 897 | 225.2 |
| D | 8 | 195 | 137051 | 604.59 | 922 | 897 | 225.2 |
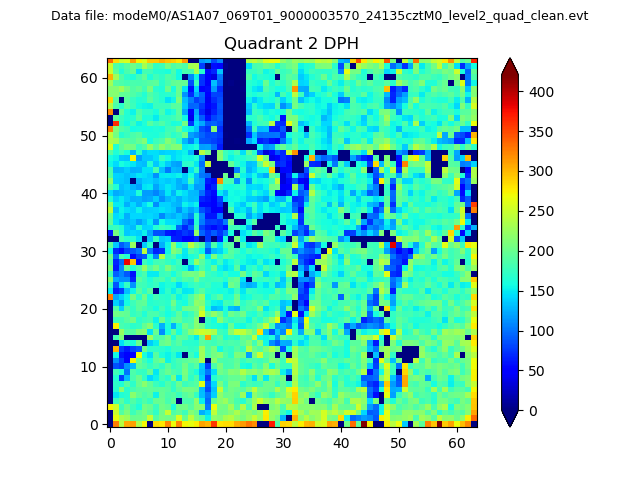
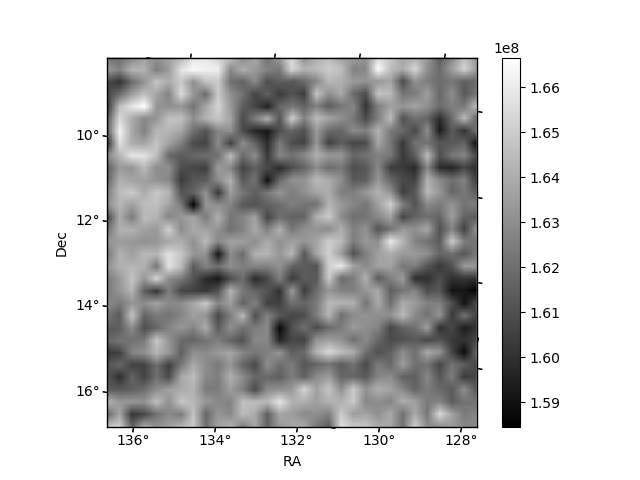
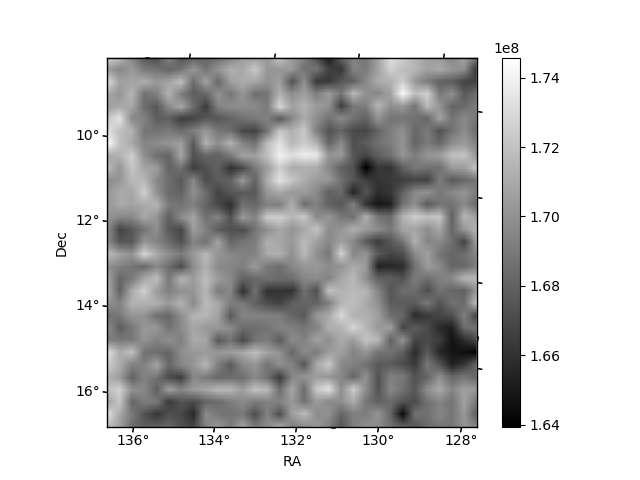
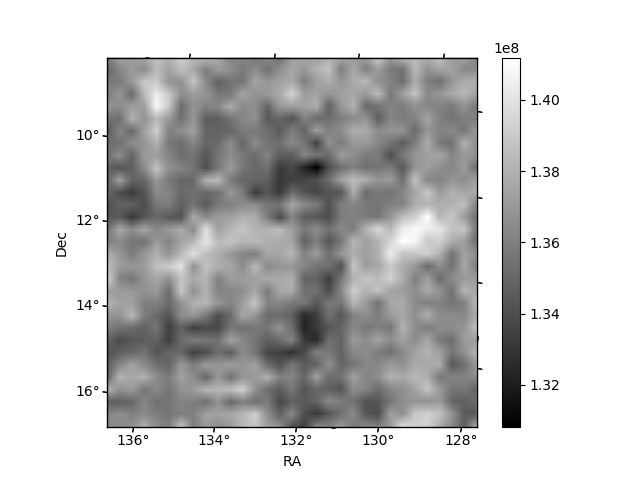
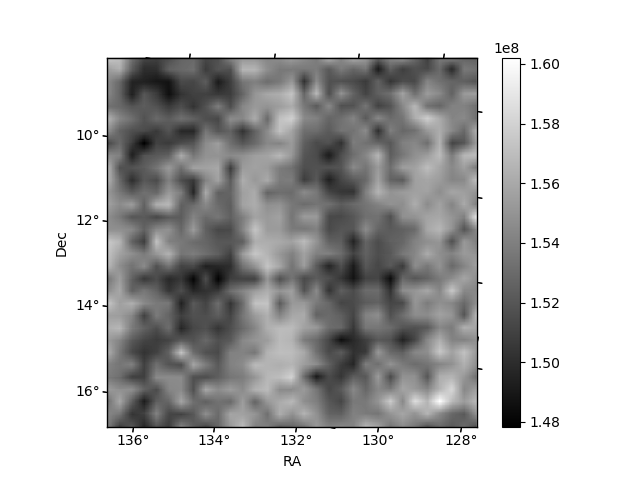
Histogram calculated using DETX and DETY for each event in the final _common_clean file
| Quadrant A | 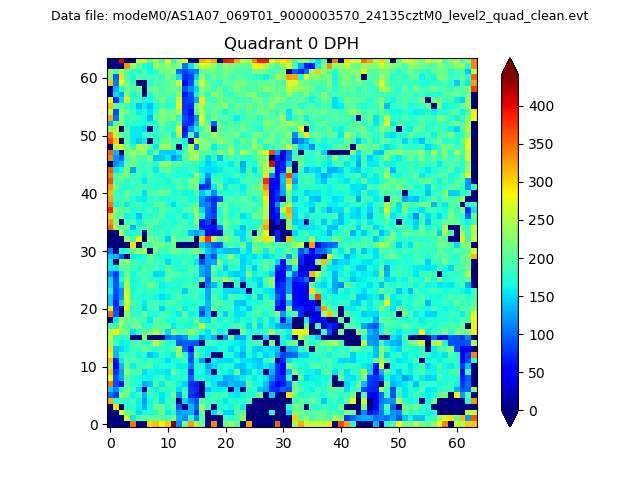 |
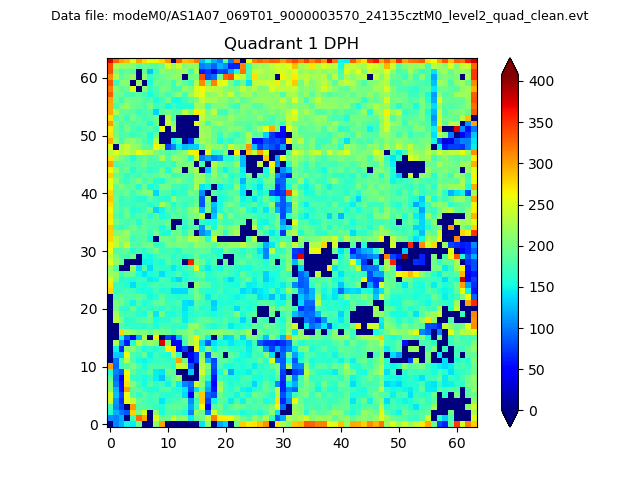 |
Quadrant B |
|---|---|---|---|
| Quadrant D | 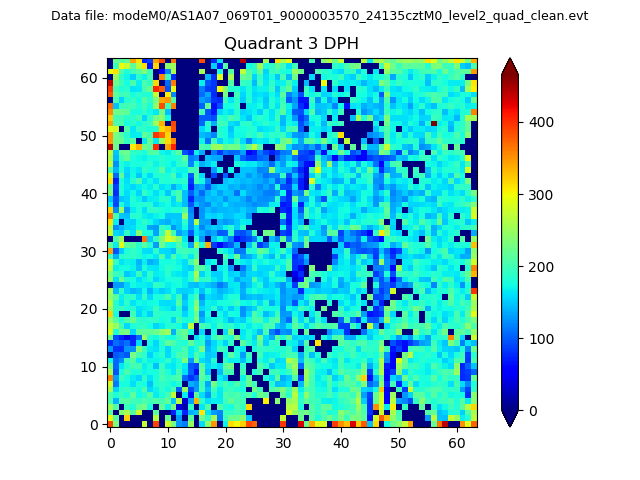 |
 |
Quadrant C |
| Plot type | Count rate plots | Images |
|---|---|---|
| Comparison with Poisson distribution Blue bars denote a histogram of data divided into 1 sec bins. Red curve is a Poisson curve with rate = median count rate of data. |
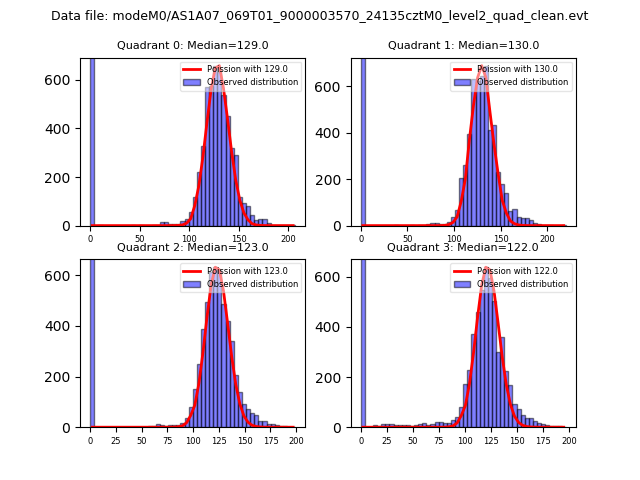 |
 |
| Quadrant-wise count rates Data is divided into 100 sec bins |
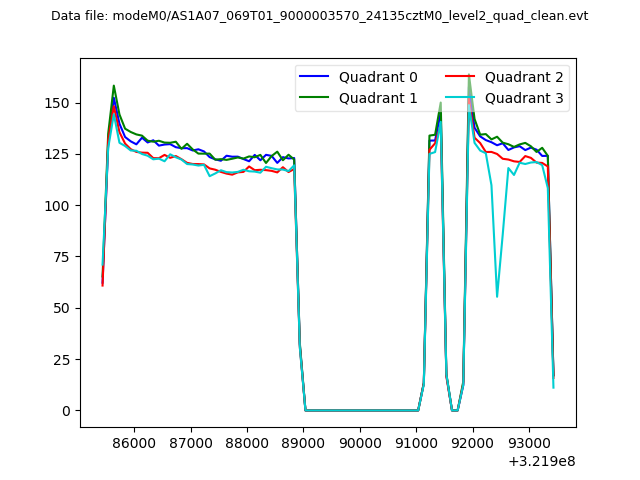 |
|
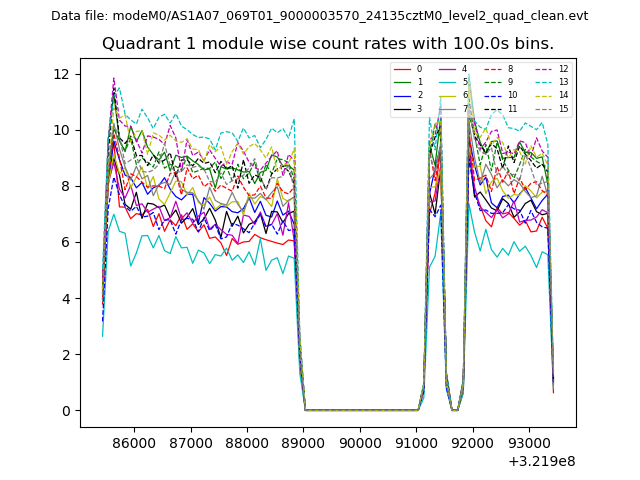
| Module-wise count rates for Quadrant A Data is divided into 100 sec bins |
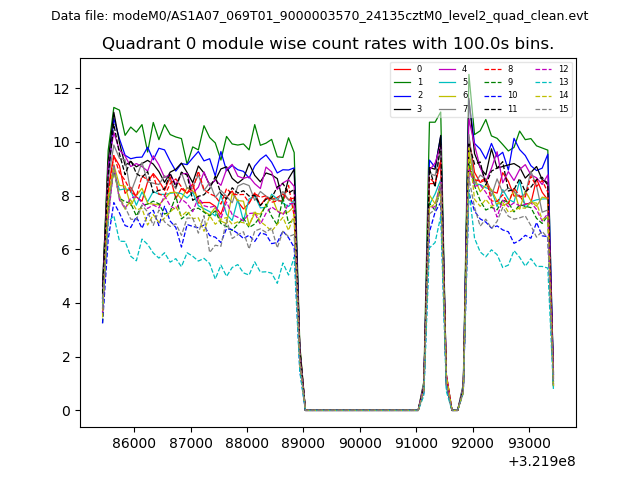 |
 |
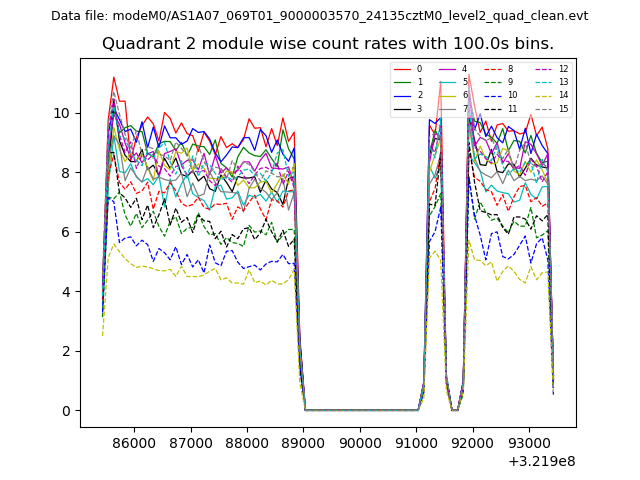
| Module-wise count rates for Quadrant B Data is divided into 100 sec bins |
 |
 |
| Module-wise count rates for Quadrant C Data is divided into 100 sec bins |
 |
 |
| Module-wise count rates for Quadrant D Data is divided into 100 sec bins |
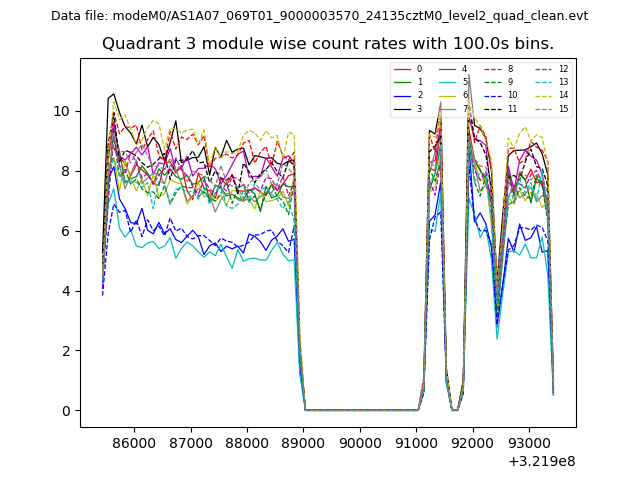 |
 |
| Parameter | Plot |
|---|---|
| CZT HV Monitor | 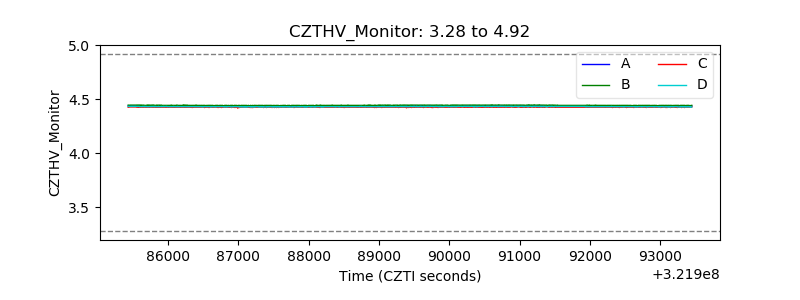 |
| D_VDD |  |
| Temperature 1 | 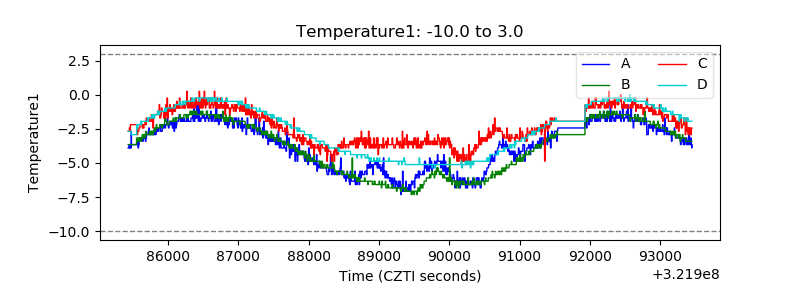 |
| Veto HV Monitor |  |
| Veto LLD | 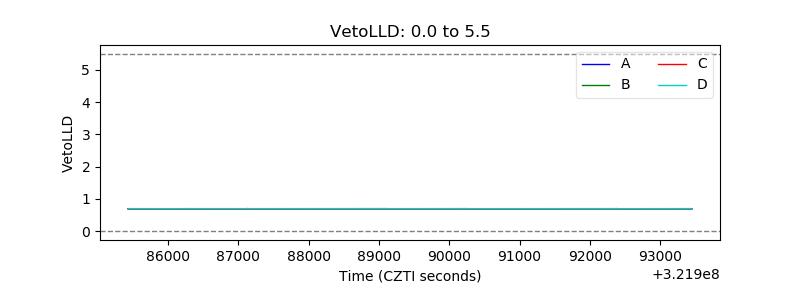 |
| Alpha Counter | 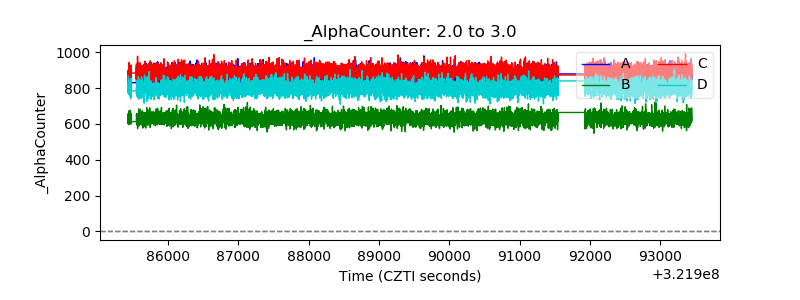 |
| _CPM_Rate | 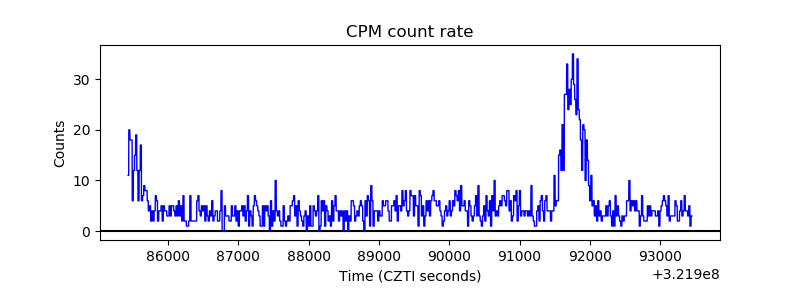 |
| CZT Counter | 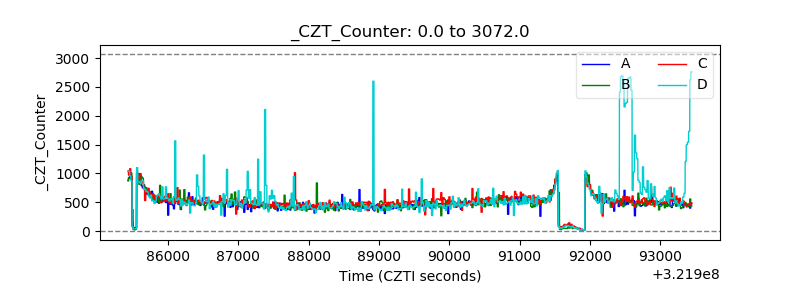 |
| +2.5 Volts monitor |  |
| +5 Volts monitor |  |
| _ROLL_ROT | 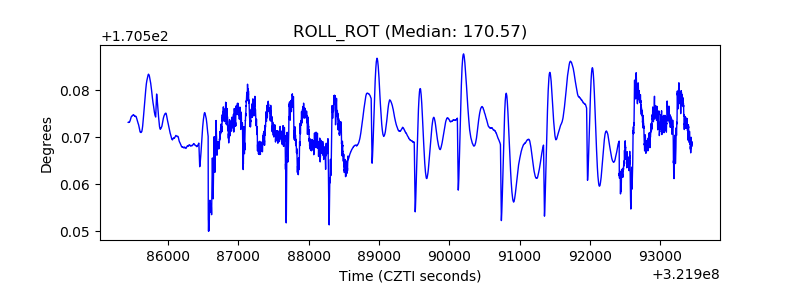 |
| _Roll_DEC | 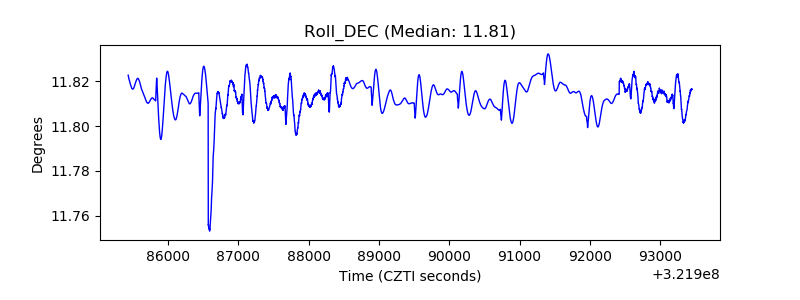 |
| _Roll_RA |  |
| Veto Counter | 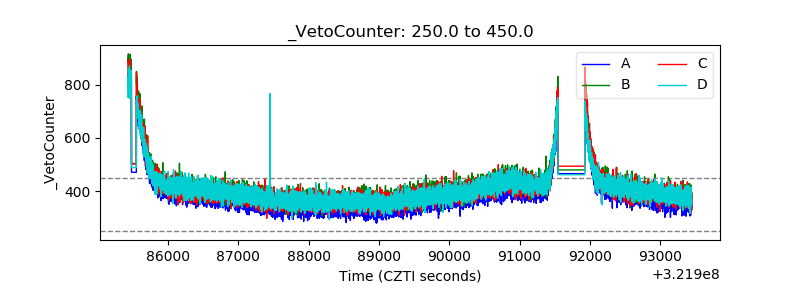 |