| Param | Original file | Final file |
|---|---|---|
| Filename | modeM0/AS1A07_069T01_9000003570_24137cztM0_level2.evt | modeM0/AS1A07_069T01_9000003570_24137cztM0_level2_quad_clean.evt |
| Size (bytes) | 1,080,262,080 | 163,592,640 |
| Size | 1.0 GB | 156.0 MB |
| Events in quadrant A | 6,084,357 | 1,070,387 |
| Events in quadrant B | 6,224,991 | 1,080,005 |
| Events in quadrant C | 6,479,410 | 1,024,882 |
| Events in quadrant D | 13,060,146 | 891,936 |
| Mode SS | |||
|---|---|---|---|
| Quadrant | BADHDUFLAG | Total packets | Discarded packets |
| A | 0 | 258 | 0 |
| B | 0 | 258 | 0 |
| C | 0 | 258 | 0 |
| D | 0 | 258 | 0 |
| Mode M0 | |||
|---|---|---|---|
| Quadrant | BADHDUFLAG | Total packets | Discarded packets |
| A | 0 | 26474 | 3 |
| B | 0 | 26742 | 3 |
| C | 0 | 27223 | 3 |
| D | 0 | 47470 | 3 |
| Mode M9 | |||
|---|---|---|---|
| Quadrant | BADHDUFLAG | Total packets | Discarded packets |
| A | 0 | 14 | 0 |
| B | 0 | 15 | 0 |
| C | 0 | 15 | 0 |
| D | 0 | 15 | 0 |
| Quadrant | Total seconds | Saturated seconds | Saturation percentage |
|---|---|---|---|
| A | 12835 | 106 | 0.825867% |
| B | 12835 | 141 | 1.098559% |
| C | 12835 | 150 | 1.168679% |
| D | 12835 | 2333 | 18.176860% |
Noise dominated data is calculated using 1-second bins in cleaned event files. If a bin has >2000 counts, and if more than 50% of those come from <1% of pixels, then it is considered to be noise-dominated and hence unusable.
| Quadrant | # 1 sec bins | Bins with >0 counts | Bins with >2000 counts | High rate bins dominated by noise | Noise dominated (total time) | Noise dominated (detector-on time) | Marked lightcurve |
|---|---|---|---|---|---|---|---|
| A | 14150 | 12836 | 1 | 1 | 0.01% | 0.01% | 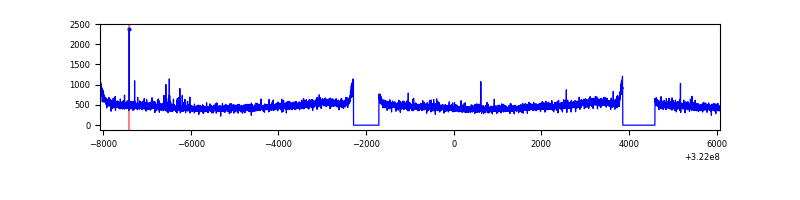 |
| B | 14150 | 12836 | 2 | 2 | 0.01% | 0.02% | 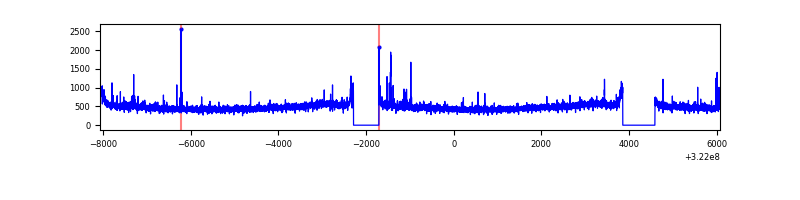 |
| C | 14150 | 12837 | 0 | 0 | 0.00% | 0.00% |  |
| D | 14150 | 12836 | 1777 | 1777 | 12.56% | 13.84% | 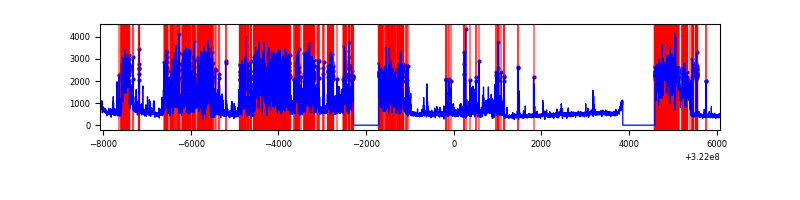 |
Top three noisy pixels from each quadrant. If the there are fewer than three noisy pixels in the level2.evt file, extra rows are filled as -1
| Pixel properties | Quadrant properties | ||||||
|---|---|---|---|---|---|---|---|
| Quadrant | DetID | PixID | Counts | Sigma | Mean | Median | Sigma |
| A | 3 | 1 | 23520 | 69.28 | 1569 | 1535 | 317.4 |
| A | 13 | 254 | 22534 | 66.17 | 1569 | 1535 | 317.4 |
| A | 3 | 137 | 13989 | 39.24 | 1569 | 1535 | 317.4 |
| B | 0 | 189 | 75552 | 247.98 | 1558 | 1520 | 298.5 |
| B | 12 | 111 | 36736 | 117.96 | 1558 | 1520 | 298.5 |
| B | 11 | 111 | 32511 | 103.81 | 1558 | 1520 | 298.5 |
| C | 10 | 91 | 381256 | 1076.42 | 1497 | 1509 | 352.8 |
| C | 14 | 238 | 234598 | 660.71 | 1497 | 1509 | 352.8 |
| C | 1 | 16 | 10779 | 26.28 | 1497 | 1509 | 352.8 |
| D | 7 | 238 | 7190548 | 21066.39 | 1395 | 1355 | 341.3 |
| D | 1 | 52 | 259522 | 756.5 | 1395 | 1355 | 341.3 |
| D | 8 | 195 | 235572 | 686.32 | 1395 | 1355 | 341.3 |
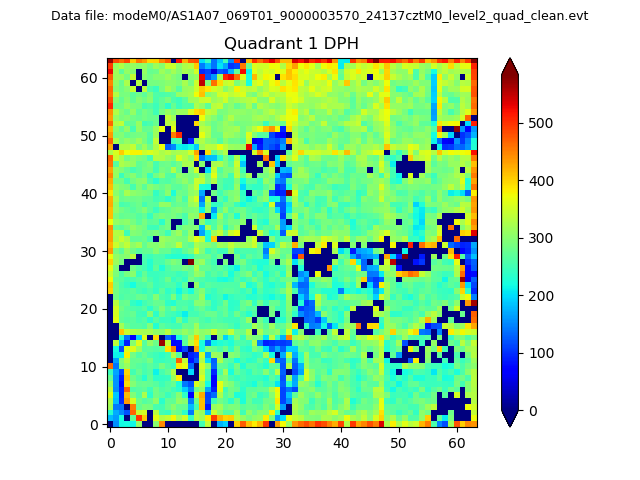
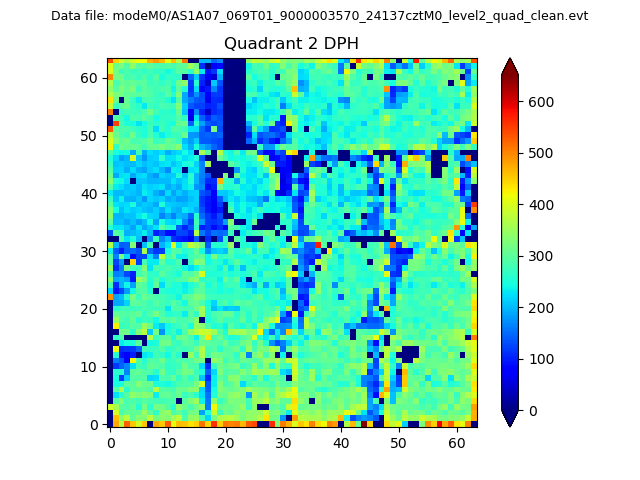
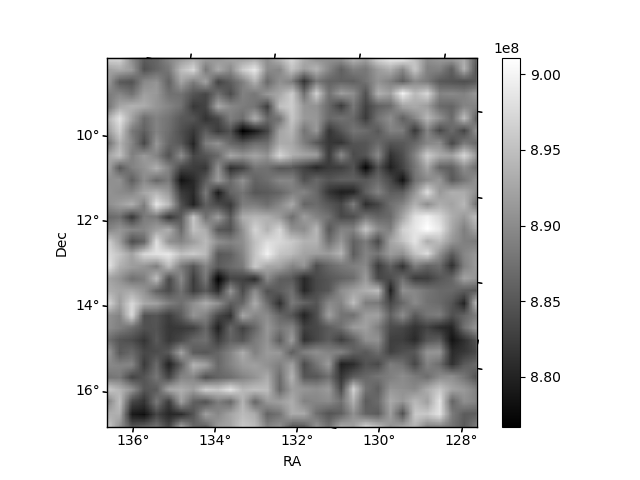
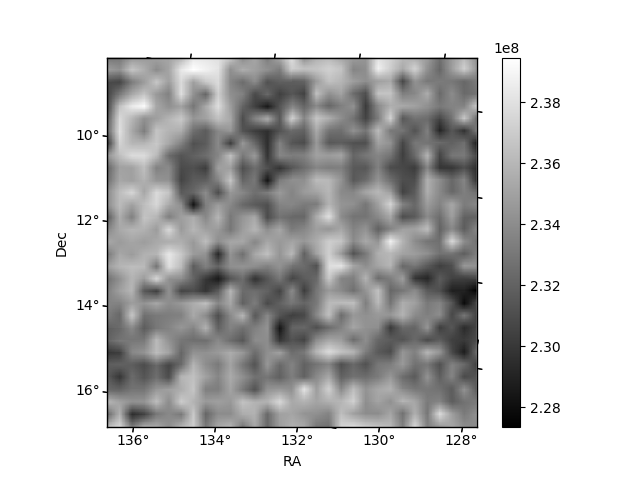
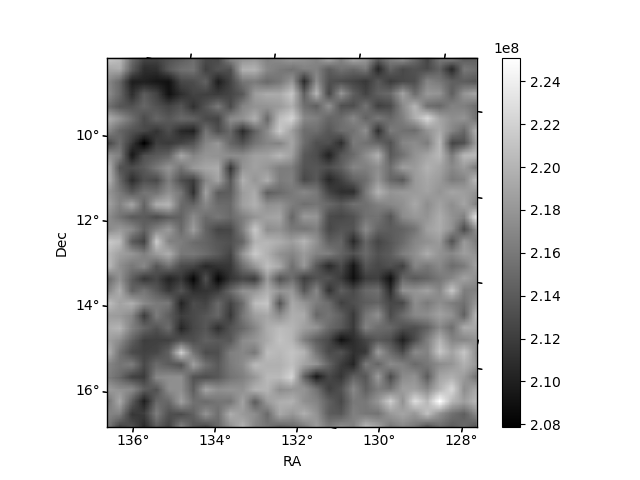
Histogram calculated using DETX and DETY for each event in the final _common_clean file
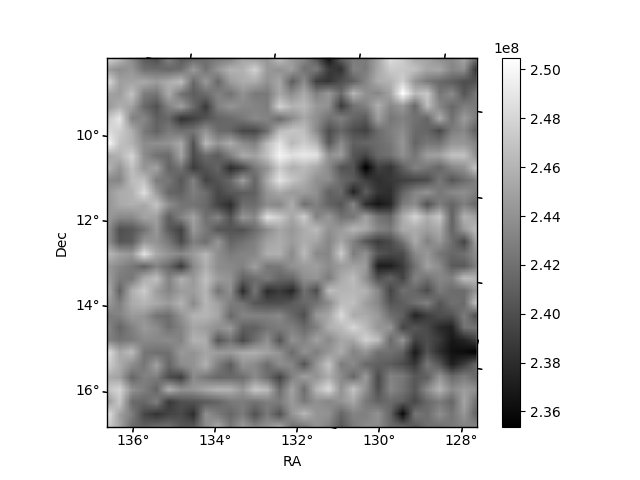
| Quadrant A | 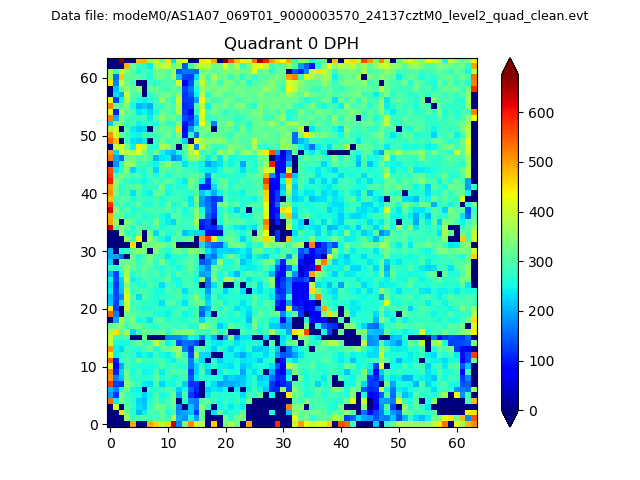 |
 |
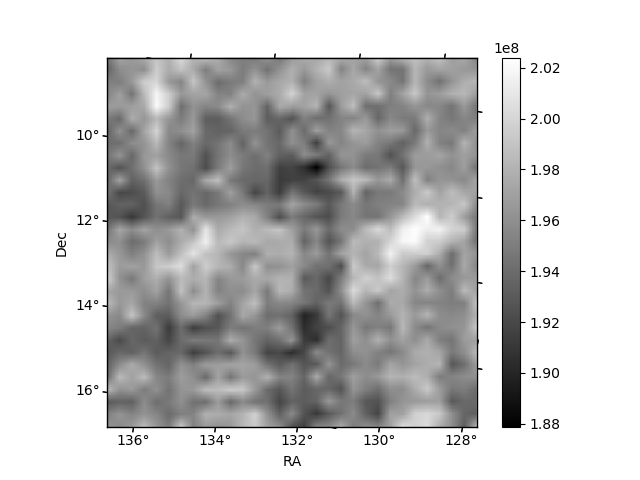
Quadrant B |
|---|---|---|---|
| Quadrant D | 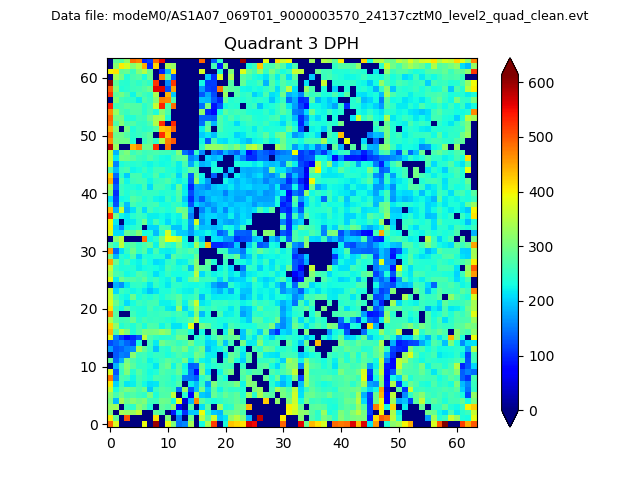 |
 |
Quadrant C |
| Plot type | Count rate plots | Images |
|---|---|---|
| Comparison with Poisson distribution Blue bars denote a histogram of data divided into 1 sec bins. Red curve is a Poisson curve with rate = median count rate of data. |
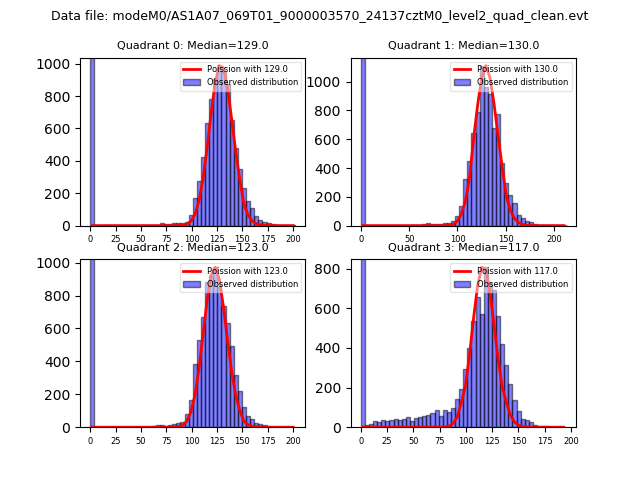 |
 |
| Quadrant-wise count rates Data is divided into 100 sec bins |
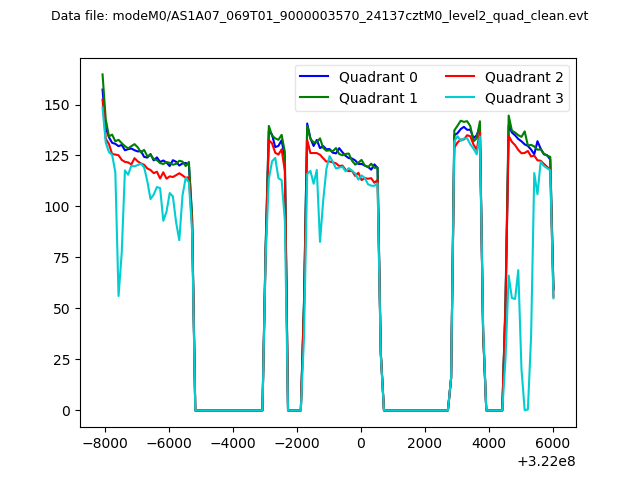 |
|
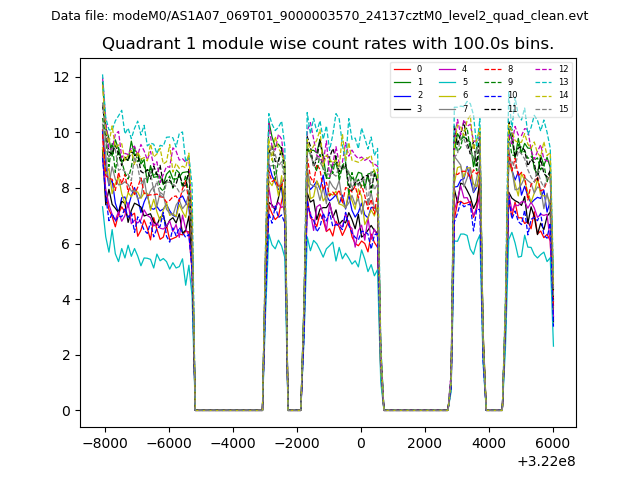
| Module-wise count rates for Quadrant A Data is divided into 100 sec bins |
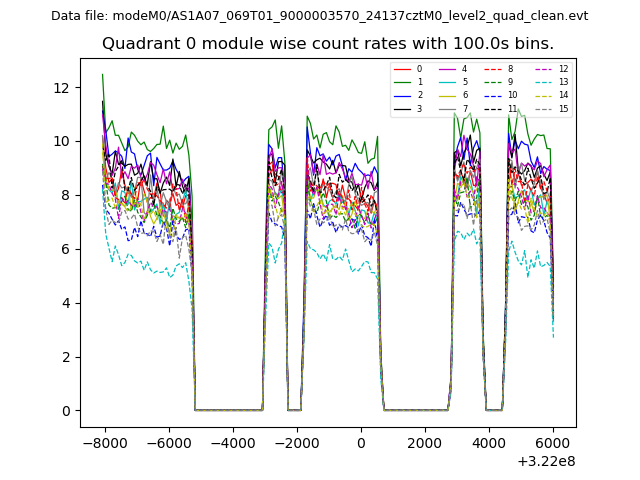 |
 |
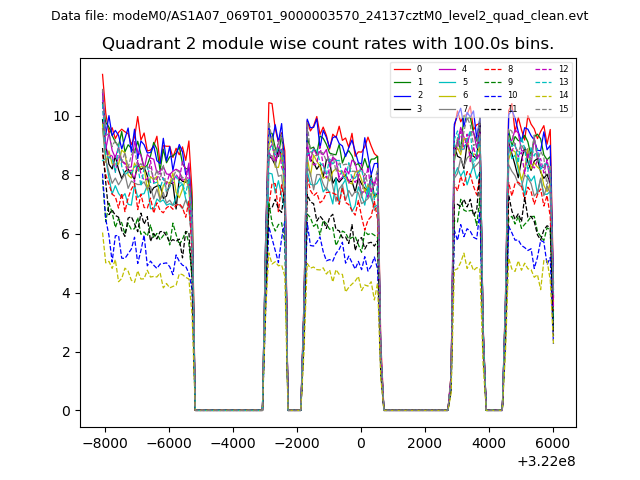
| Module-wise count rates for Quadrant B Data is divided into 100 sec bins |
 |
 |
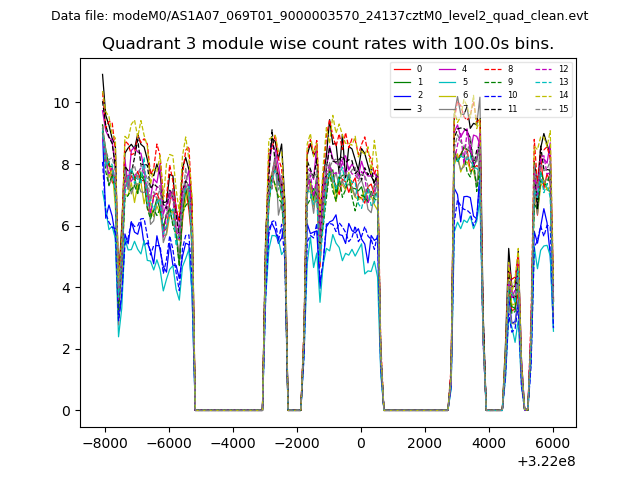
| Module-wise count rates for Quadrant C Data is divided into 100 sec bins |
 |
 |
| Module-wise count rates for Quadrant D Data is divided into 100 sec bins |
 |
 |
| Parameter | Plot |
|---|---|
| CZT HV Monitor | 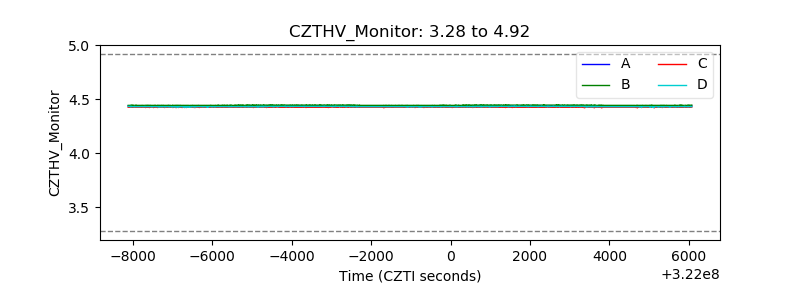 |
| D_VDD | 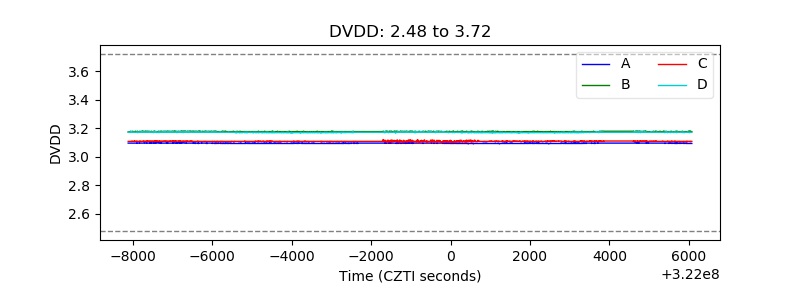 |
| Temperature 1 | 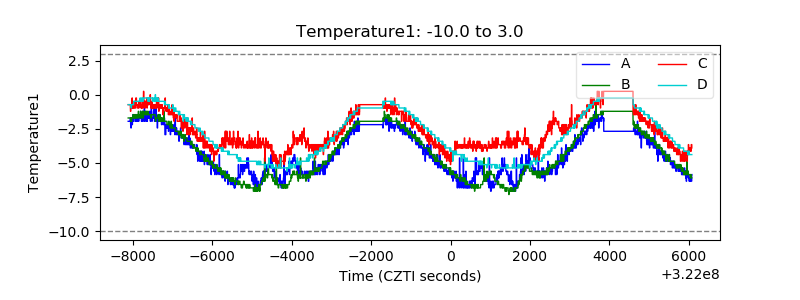 |
| Veto HV Monitor | 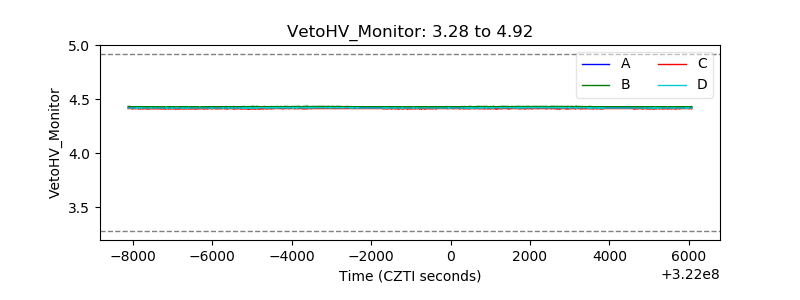 |
| Veto LLD | 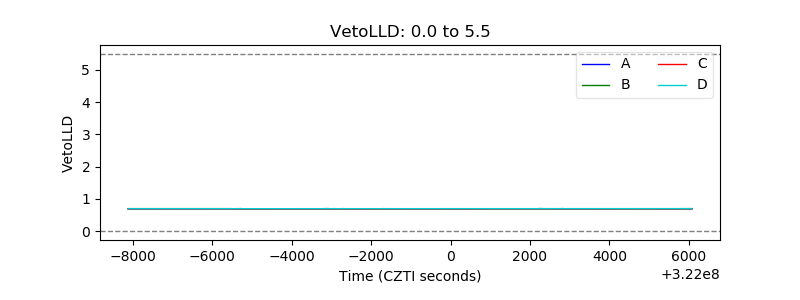 |
| Alpha Counter | 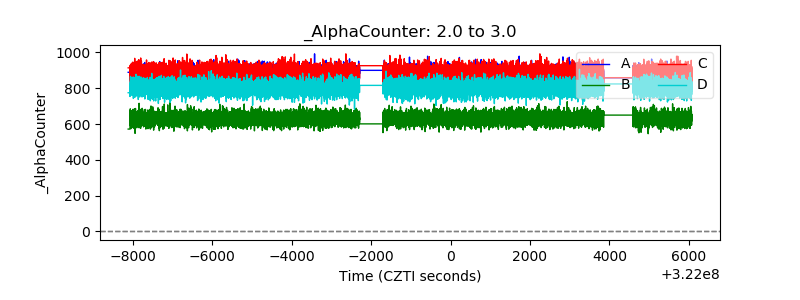 |
| _CPM_Rate | 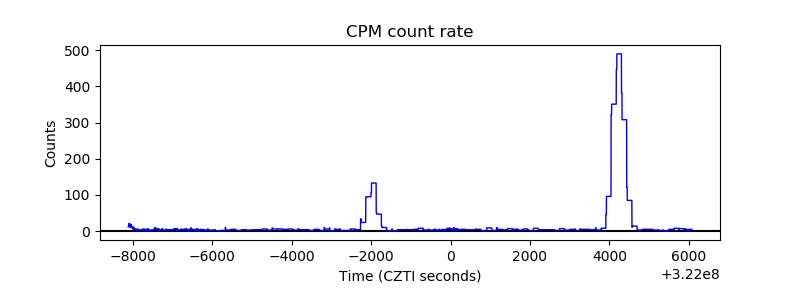 |
| CZT Counter | 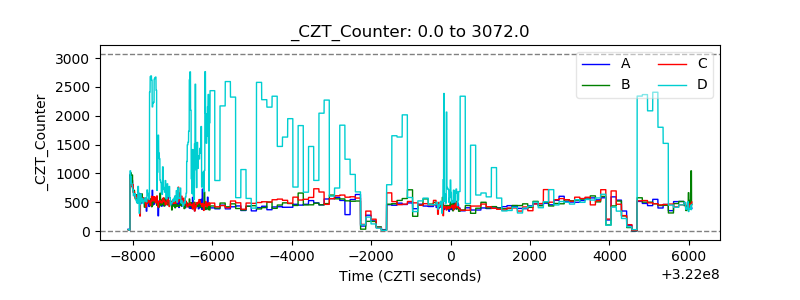 |
| +2.5 Volts monitor |  |
| +5 Volts monitor | 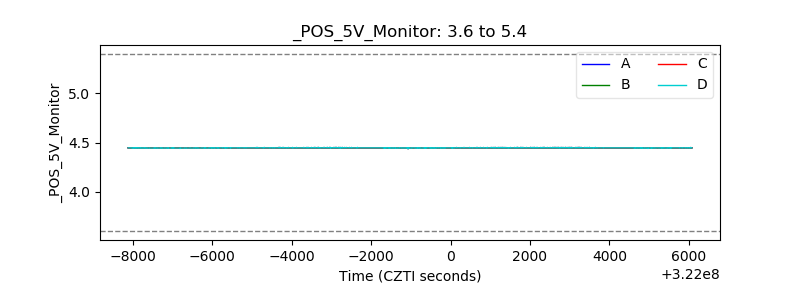 |
| _ROLL_ROT | 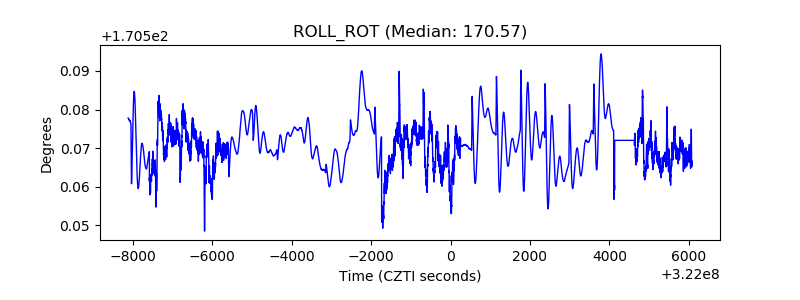 |
| _Roll_DEC |  |
| _Roll_RA | 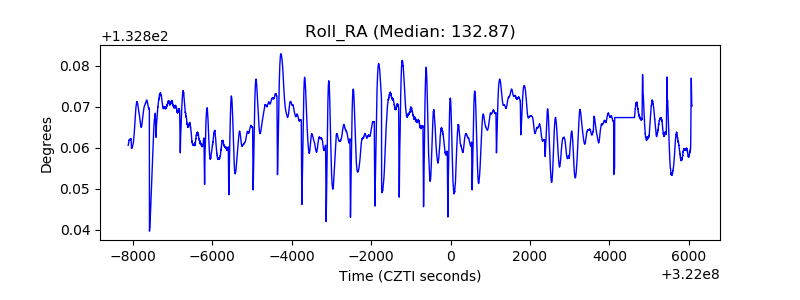 |
| Veto Counter | 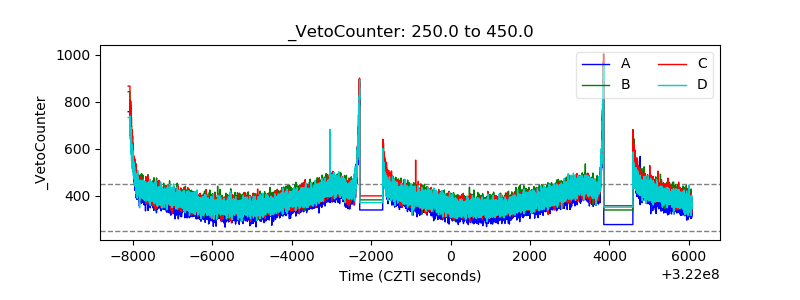 |