| Param | Original file | Final file |
|---|---|---|
| Filename | modeM0/AS1A07_069T01_9000003570_24138cztM0_level2.evt | modeM0/AS1A07_069T01_9000003570_24138cztM0_level2_quad_clean.evt |
| Size (bytes) | 663,004,800 | 88,214,400 |
| Size | 632.3 MB | 84.1 MB |
| Events in quadrant A | 3,207,300 | 607,549 |
| Events in quadrant B | 3,283,952 | 618,276 |
| Events in quadrant C | 3,310,013 | 583,458 |
| Events in quadrant D | 9,814,668 | 384,786 |
| Mode SS | |||
|---|---|---|---|
| Quadrant | BADHDUFLAG | Total packets | Discarded packets |
| A | 0 | 136 | 0 |
| B | 0 | 136 | 0 |
| C | 0 | 136 | 0 |
| D | 0 | 136 | 0 |
| Mode M0 | |||
|---|---|---|---|
| Quadrant | BADHDUFLAG | Total packets | Discarded packets |
| A | 0 | 13959 | 2 |
| B | 0 | 14077 | 1 |
| C | 0 | 14160 | 1 |
| D | 0 | 33983 | 1 |
| Mode M9 | |||
|---|---|---|---|
| Quadrant | BADHDUFLAG | Total packets | Discarded packets |
| A | 0 | 12 | 0 |
| B | 0 | 13 | 0 |
| C | 0 | 13 | 0 |
| D | 0 | 13 | 0 |
| Quadrant | Total seconds | Saturated seconds | Saturation percentage |
|---|---|---|---|
| A | 6841 | 30 | 0.438532% |
| B | 6841 | 44 | 0.643181% |
| C | 6841 | 56 | 0.818594% |
| D | 6841 | 2739 | 40.038006% |
Noise dominated data is calculated using 1-second bins in cleaned event files. If a bin has >2000 counts, and if more than 50% of those come from <1% of pixels, then it is considered to be noise-dominated and hence unusable.
| Quadrant | # 1 sec bins | Bins with >0 counts | Bins with >2000 counts | High rate bins dominated by noise | Noise dominated (total time) | Noise dominated (detector-on time) | Marked lightcurve |
|---|---|---|---|---|---|---|---|
| A | 7746 | 6842 | 0 | 0 | 0.00% | 0.00% | 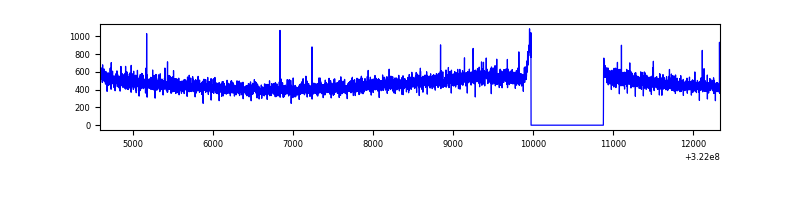 |
| B | 7746 | 6841 | 1 | 1 | 0.01% | 0.01% | 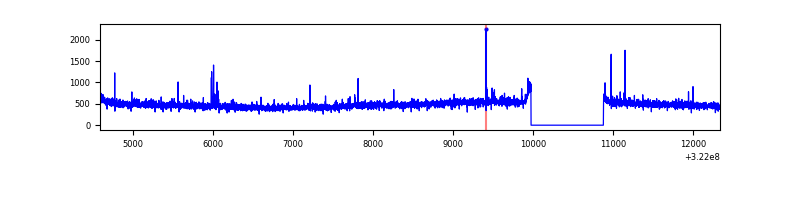 |
| C | 7746 | 6842 | 0 | 0 | 0.00% | 0.00% | 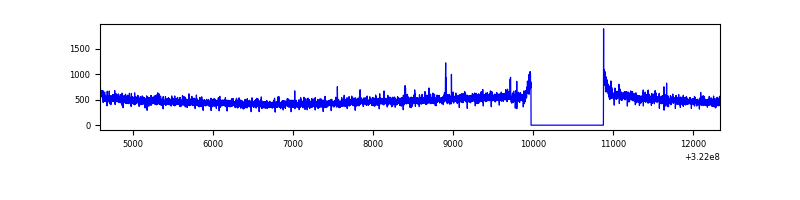 |
| D | 7746 | 6842 | 2196 | 2196 | 28.35% | 32.10% | 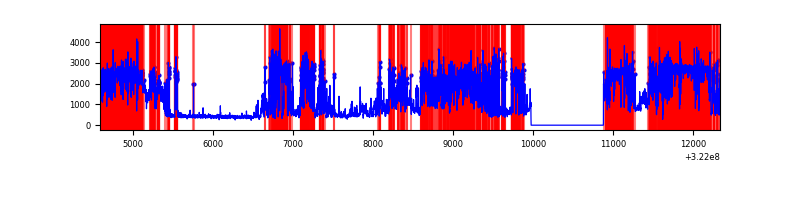 |
Top three noisy pixels from each quadrant. If the there are fewer than three noisy pixels in the level2.evt file, extra rows are filled as -1
| Pixel properties | Quadrant properties | ||||||
|---|---|---|---|---|---|---|---|
| Quadrant | DetID | PixID | Counts | Sigma | Mean | Median | Sigma |
| A | 13 | 254 | 12271 | 68.52 | 830 | 811 | 167.2 |
| A | 0 | 226 | 7433 | 39.6 | 830 | 811 | 167.2 |
| A | 3 | 137 | 7410 | 39.46 | 830 | 811 | 167.2 |
| B | 12 | 111 | 19271 | 115.4 | 828 | 809 | 160.0 |
| B | 11 | 111 | 17366 | 103.49 | 828 | 809 | 160.0 |
| B | 0 | 245 | 16226 | 96.37 | 828 | 809 | 160.0 |
| C | 14 | 238 | 124394 | 661.61 | 795 | 802 | 186.8 |
| C | 1 | 16 | 56864 | 300.11 | 795 | 802 | 186.8 |
| C | 2 | 16 | 14587 | 73.79 | 795 | 802 | 186.8 |
| D | 7 | 238 | 7373282 | 47587.0 | 630 | 611 | 154.9 |
| D | 2 | 234 | 24723 | 155.63 | 630 | 611 | 154.9 |
| D | 8 | 195 | 23215 | 145.89 | 630 | 611 | 154.9 |
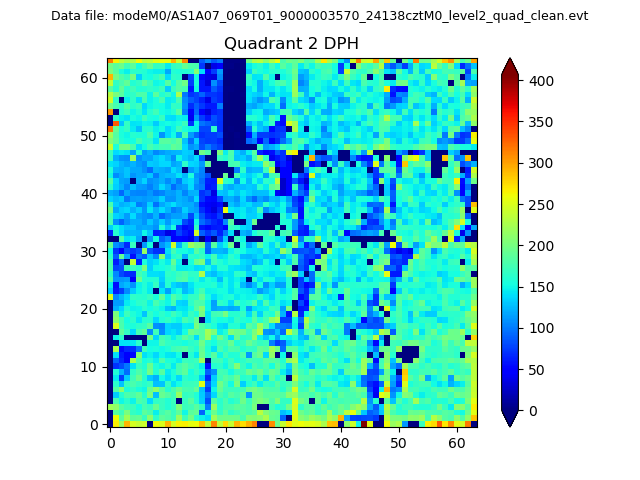
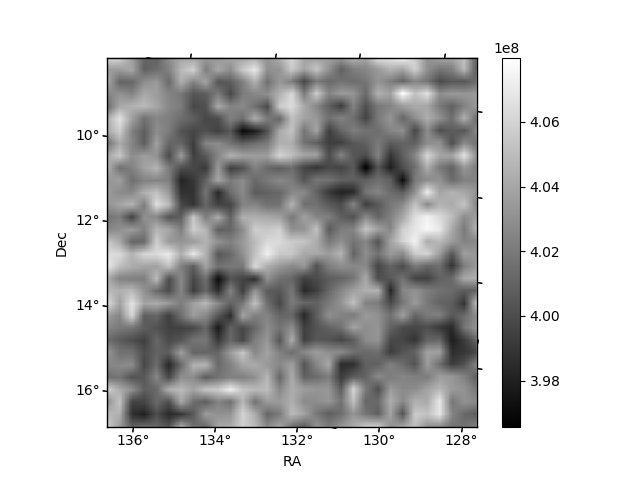
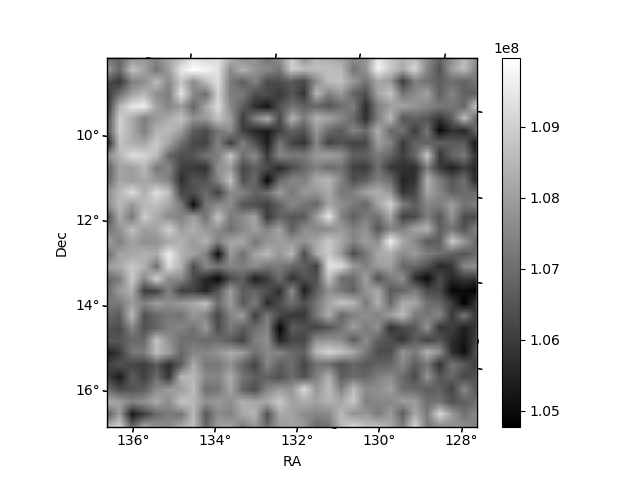
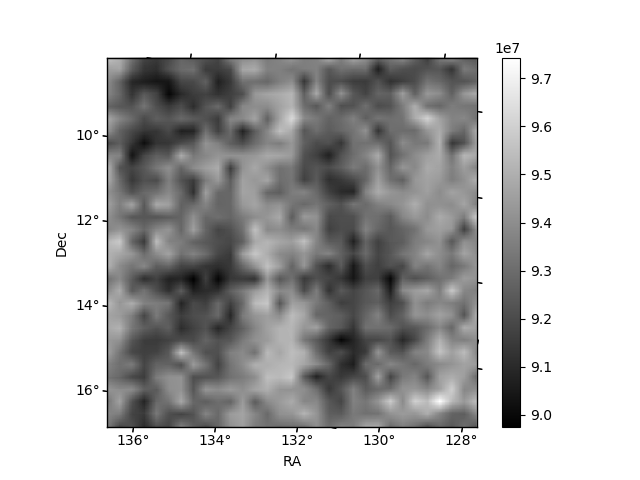
Histogram calculated using DETX and DETY for each event in the final _common_clean file
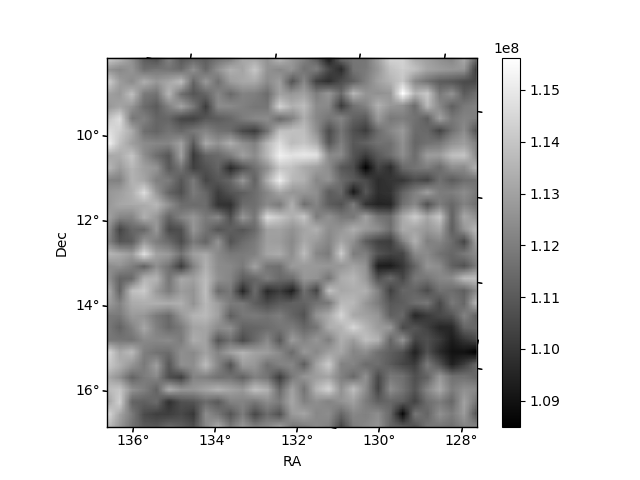
| Quadrant A | 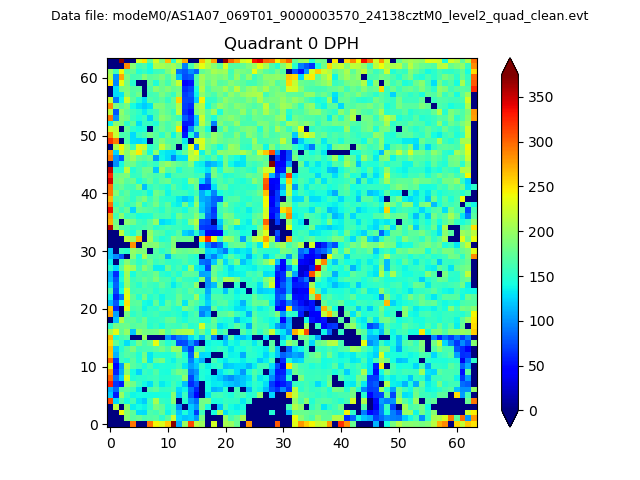 |
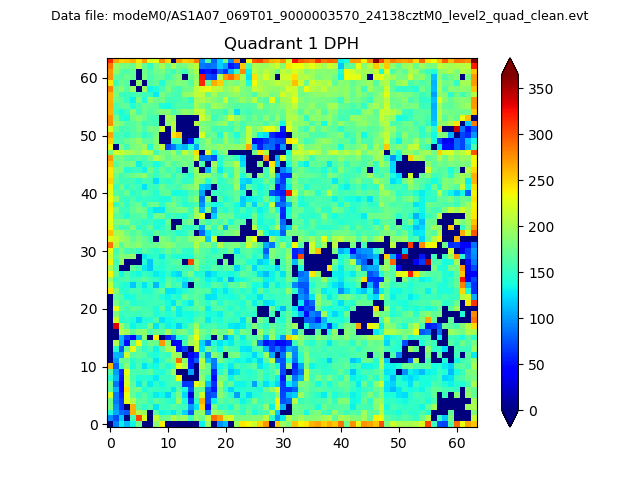 |
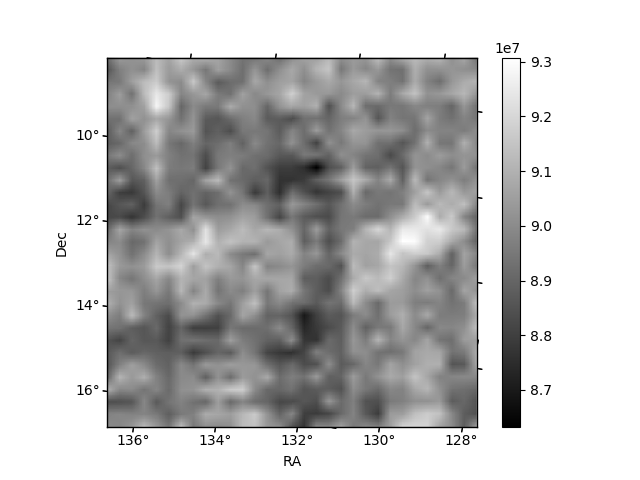
Quadrant B |
|---|---|---|---|
| Quadrant D | 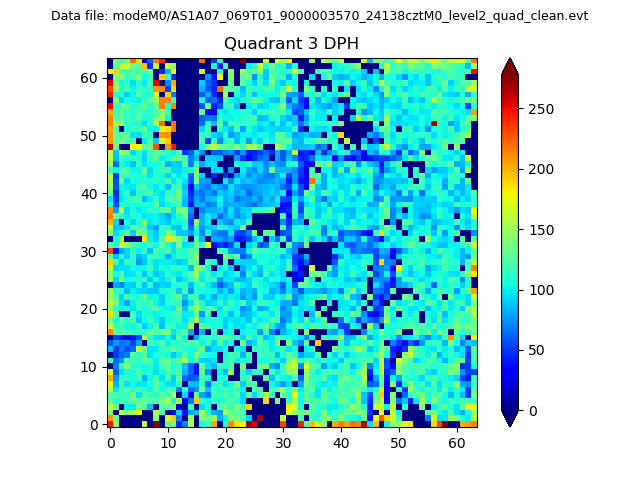 |
 |
Quadrant C |
| Plot type | Count rate plots | Images |
|---|---|---|
| Comparison with Poisson distribution Blue bars denote a histogram of data divided into 1 sec bins. Red curve is a Poisson curve with rate = median count rate of data. |
 |
 |
| Quadrant-wise count rates Data is divided into 100 sec bins |
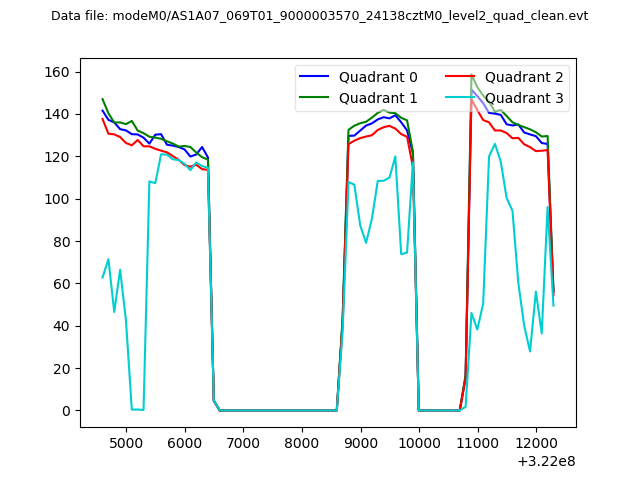 |
|
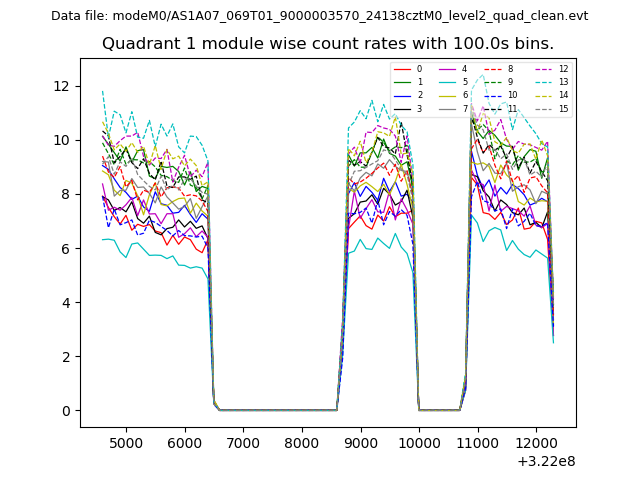
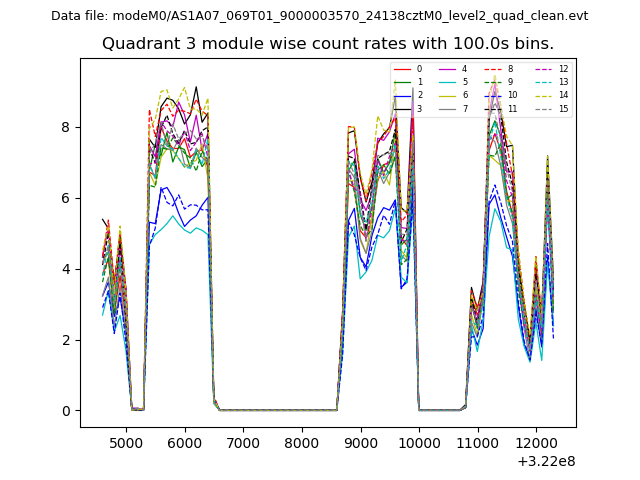
| Module-wise count rates for Quadrant A Data is divided into 100 sec bins |
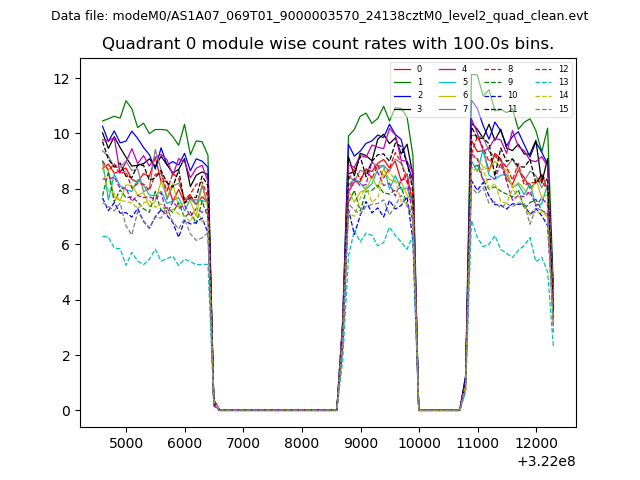 |
 |
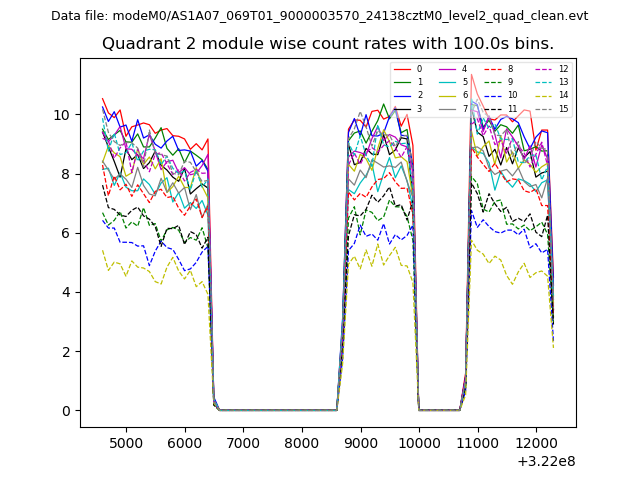
| Module-wise count rates for Quadrant B Data is divided into 100 sec bins |
 |
 |
| Module-wise count rates for Quadrant C Data is divided into 100 sec bins |
 |
 |
| Module-wise count rates for Quadrant D Data is divided into 100 sec bins |
 |
 |
| Parameter | Plot |
|---|---|
| CZT HV Monitor | 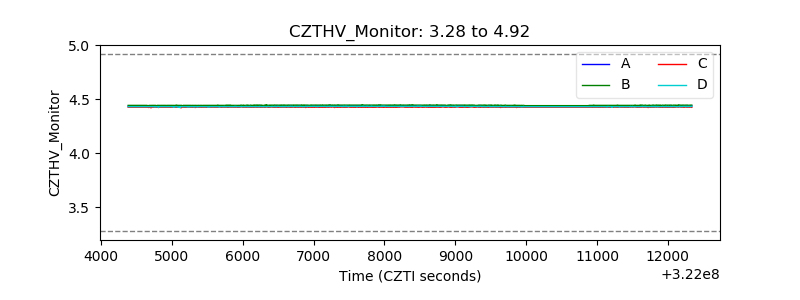 |
| D_VDD | 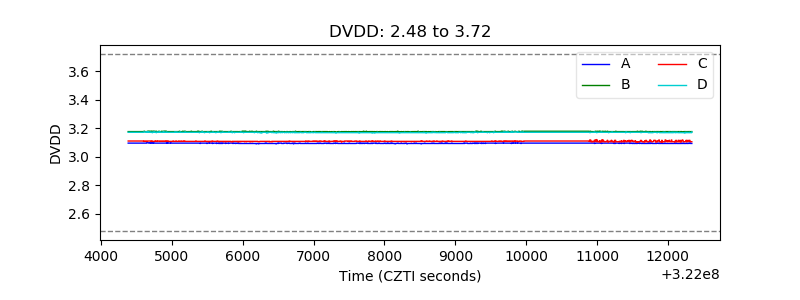 |
| Temperature 1 | 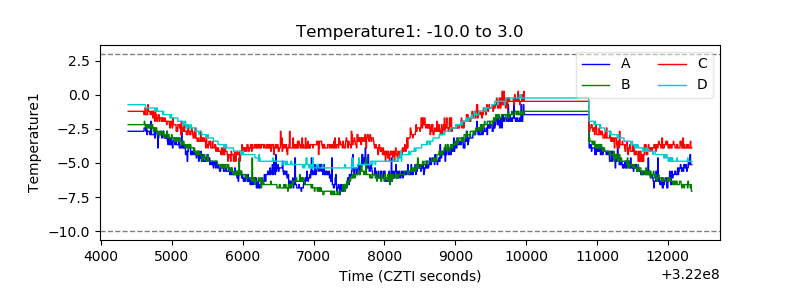 |
| Veto HV Monitor | 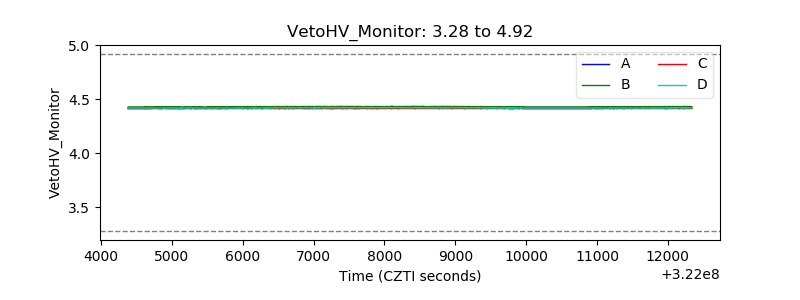 |
| Veto LLD |  |
| Alpha Counter | 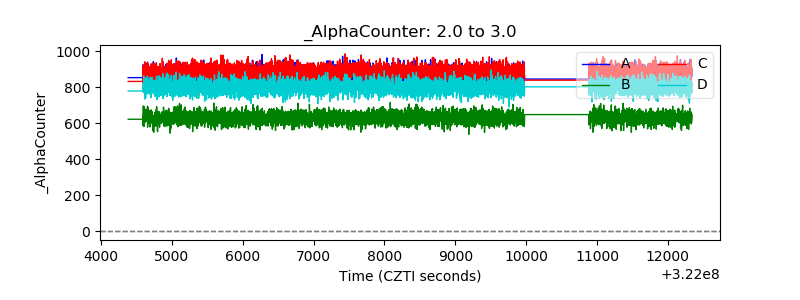 |
| _CPM_Rate | 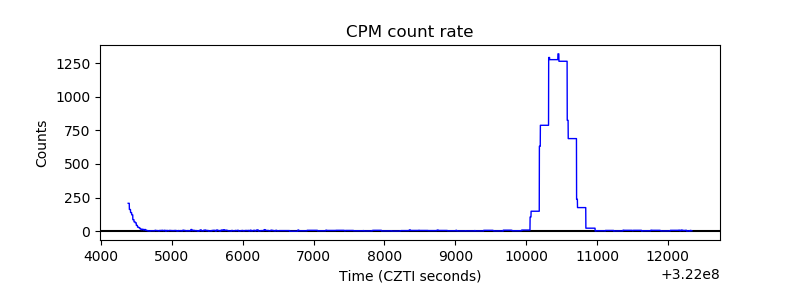 |
| CZT Counter | 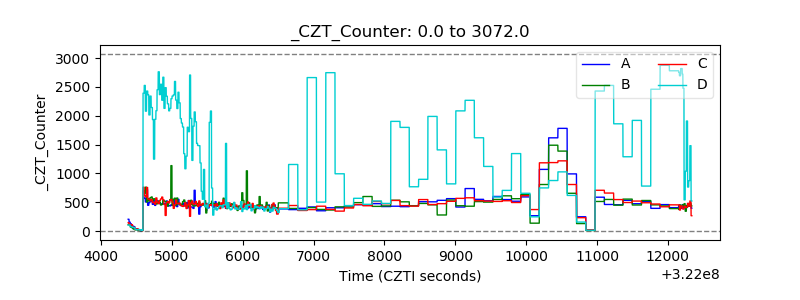 |
| +2.5 Volts monitor |  |
| +5 Volts monitor | 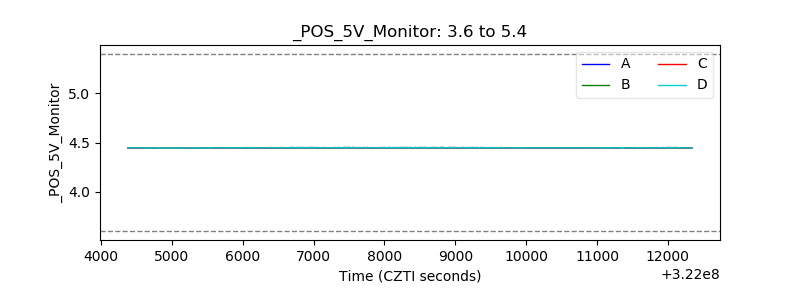 |
| _ROLL_ROT | 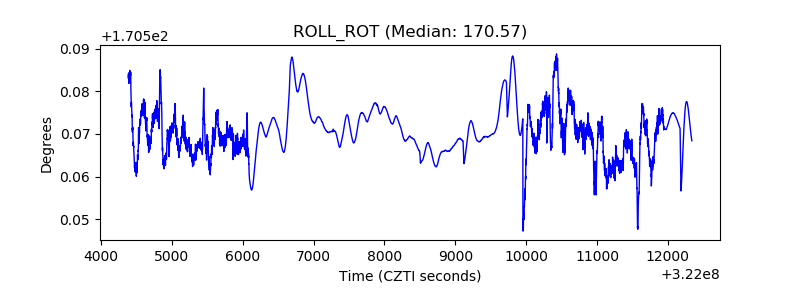 |
| _Roll_DEC | 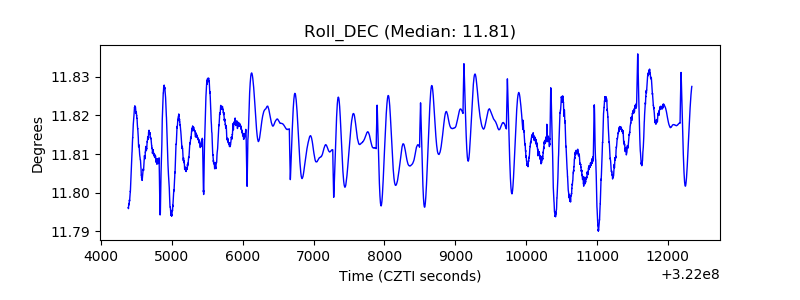 |
| _Roll_RA | 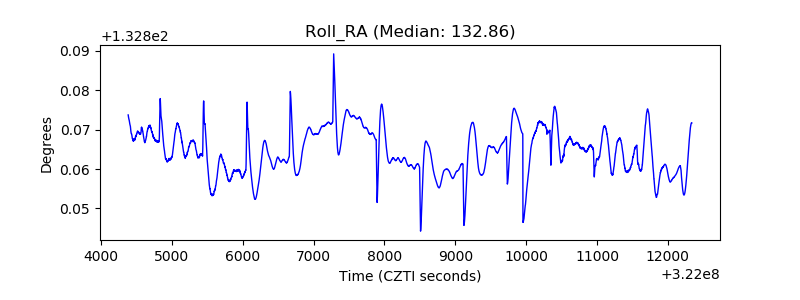 |
| Veto Counter | 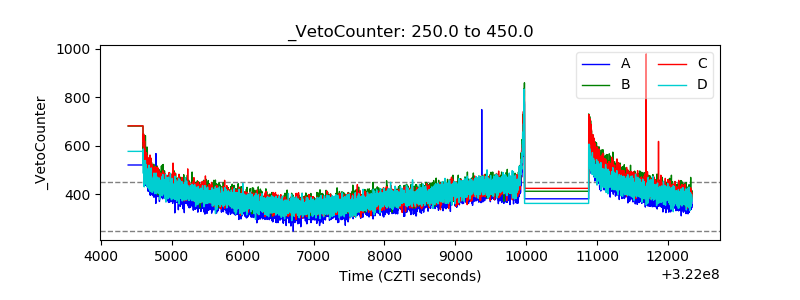 |