| Param | Original file | Final file |
|---|---|---|
| Filename | modeM0/AS1A07_069T01_9000003570_24139cztM0_level2.evt | modeM0/AS1A07_069T01_9000003570_24139cztM0_level2_quad_clean.evt |
| Size (bytes) | 817,778,880 | 80,424,000 |
| Size | 779.9 MB | 76.7 MB |
| Events in quadrant A | 3,159,607 | 560,358 |
| Events in quadrant B | 5,104,260 | 520,740 |
| Events in quadrant C | 3,286,871 | 533,653 |
| Events in quadrant D | 12,770,809 | 360,465 |
| Mode SS | |||
|---|---|---|---|
| Quadrant | BADHDUFLAG | Total packets | Discarded packets |
| A | 0 | 134 | 0 |
| B | 0 | 134 | 0 |
| C | 0 | 134 | 0 |
| D | 0 | 134 | 0 |
| Mode M0 | |||
|---|---|---|---|
| Quadrant | BADHDUFLAG | Total packets | Discarded packets |
| A | 0 | 13484 | 2 |
| B | 0 | 19323 | 1 |
| C | 0 | 13810 | 1 |
| D | 0 | 42500 | 1 |
| Mode M9 | |||
|---|---|---|---|
| Quadrant | BADHDUFLAG | Total packets | Discarded packets |
| A | 0 | 14 | 0 |
| B | 0 | 15 | 0 |
| C | 0 | 15 | 0 |
| D | 0 | 15 | 0 |
| Quadrant | Total seconds | Saturated seconds | Saturation percentage |
|---|---|---|---|
| A | 6578 | 32 | 0.486470% |
| B | 6578 | 936 | 14.229249% |
| C | 6578 | 57 | 0.866525% |
| D | 6578 | 3796 | 57.707510% |
Noise dominated data is calculated using 1-second bins in cleaned event files. If a bin has >2000 counts, and if more than 50% of those come from <1% of pixels, then it is considered to be noise-dominated and hence unusable.
| Quadrant | # 1 sec bins | Bins with >0 counts | Bins with >2000 counts | High rate bins dominated by noise | Noise dominated (total time) | Noise dominated (detector-on time) | Marked lightcurve |
|---|---|---|---|---|---|---|---|
| A | 7638 | 6578 | 0 | 0 | 0.00% | 0.00% | 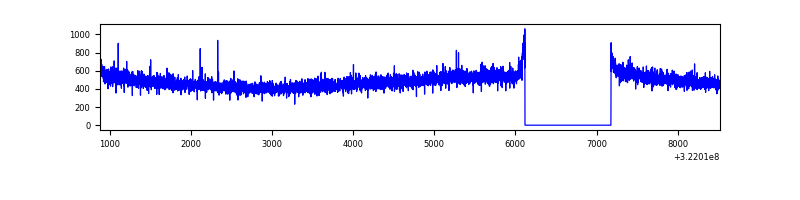 |
| B | 7637 | 6578 | 854 | 854 | 11.18% | 12.98% | 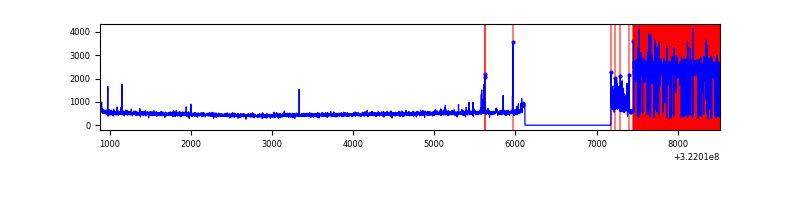 |
| C | 7638 | 6579 | 1 | 1 | 0.01% | 0.02% | 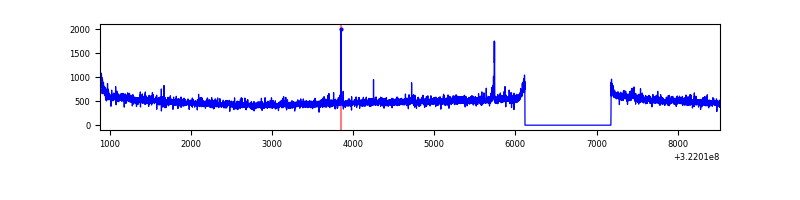 |
| D | 7638 | 6578 | 3502 | 3502 | 45.85% | 53.24% | 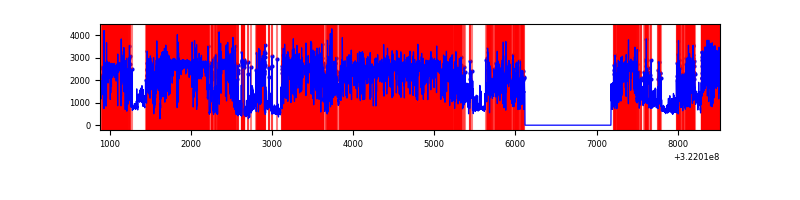 |
Top three noisy pixels from each quadrant. If the there are fewer than three noisy pixels in the level2.evt file, extra rows are filled as -1
| Pixel properties | Quadrant properties | ||||||
|---|---|---|---|---|---|---|---|
| Quadrant | DetID | PixID | Counts | Sigma | Mean | Median | Sigma |
| A | 13 | 254 | 10771 | 60.83 | 819 | 805 | 163.8 |
| A | 3 | 137 | 7262 | 39.41 | 819 | 805 | 163.8 |
| A | 0 | 226 | 7254 | 39.36 | 819 | 805 | 163.8 |
| B | 4 | 200 | 2040823 | 13779.81 | 769 | 750 | 148.0 |
| B | 0 | 229 | 23289 | 152.24 | 769 | 750 | 148.0 |
| B | 12 | 111 | 17447 | 112.78 | 769 | 750 | 148.0 |
| C | 14 | 238 | 123640 | 670.4 | 783 | 790 | 183.2 |
| C | 1 | 16 | 57592 | 309.97 | 783 | 790 | 183.2 |
| C | 2 | 16 | 22745 | 119.81 | 783 | 790 | 183.2 |
| D | 7 | 238 | 10427059 | 72706.6 | 585 | 567 | 143.4 |
| D | 8 | 195 | 59949 | 414.08 | 585 | 567 | 143.4 |
| D | 1 | 52 | 45417 | 312.75 | 585 | 567 | 143.4 |
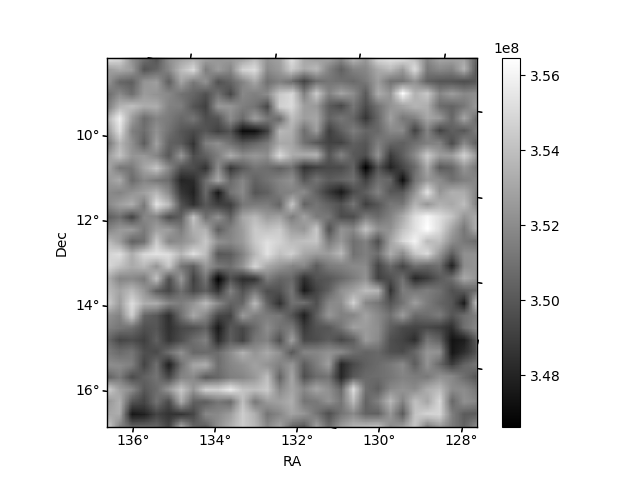
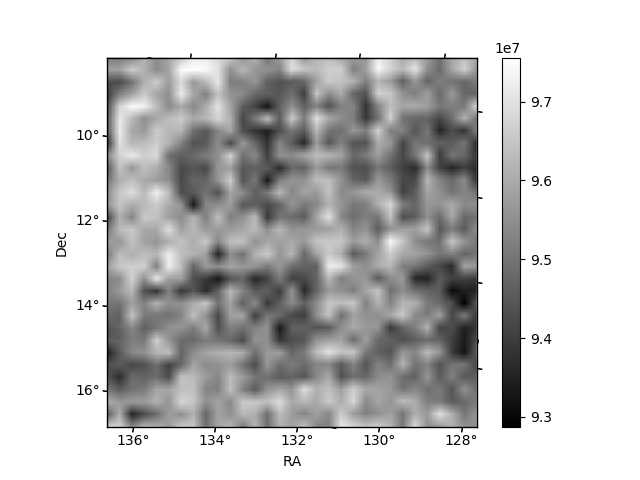
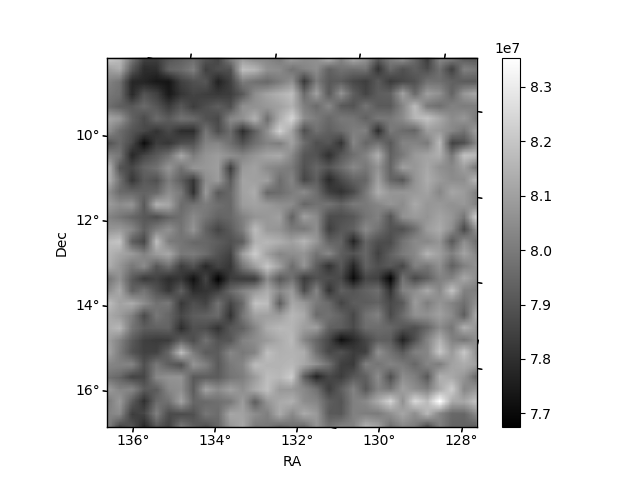
Histogram calculated using DETX and DETY for each event in the final _common_clean file
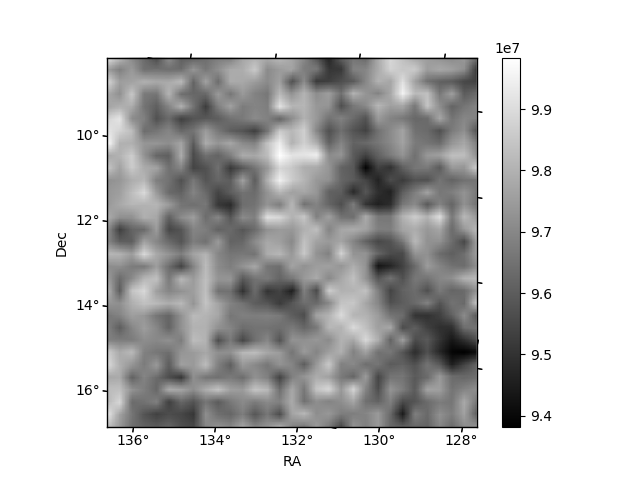
| Quadrant A | 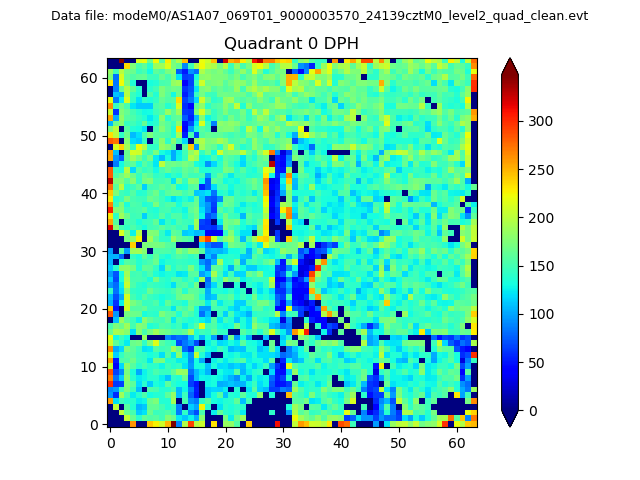 |
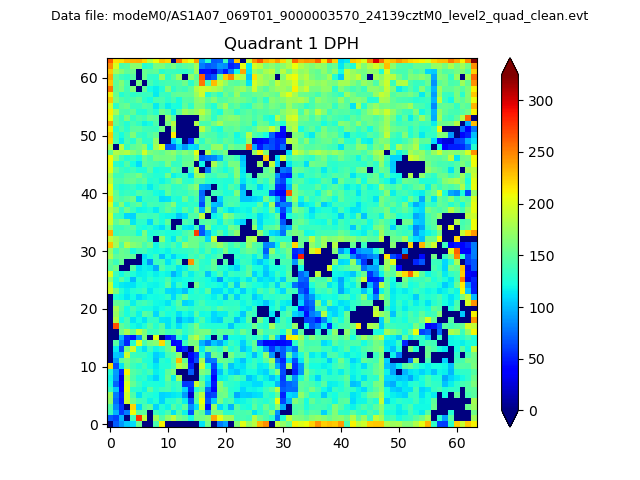 |
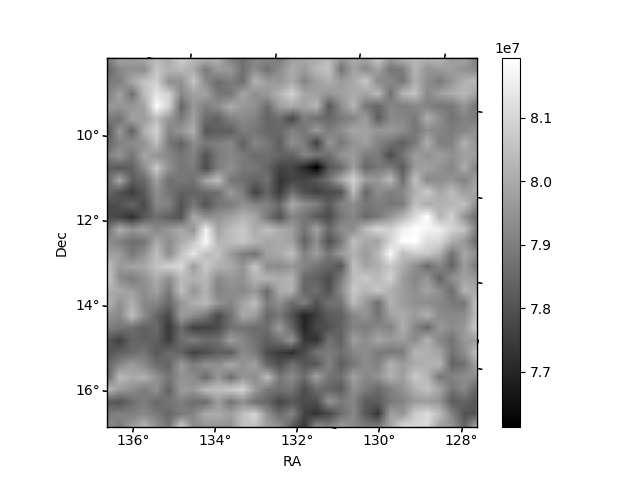
Quadrant B |
|---|---|---|---|
| Quadrant D |  |
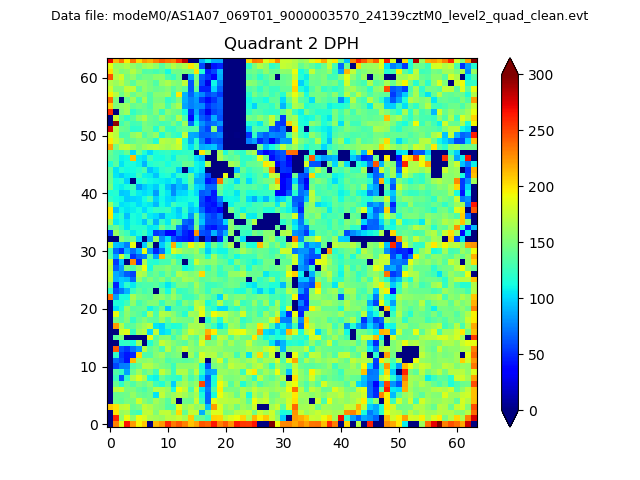 |
Quadrant C |
| Plot type | Count rate plots | Images |
|---|---|---|
| Comparison with Poisson distribution Blue bars denote a histogram of data divided into 1 sec bins. Red curve is a Poisson curve with rate = median count rate of data. |
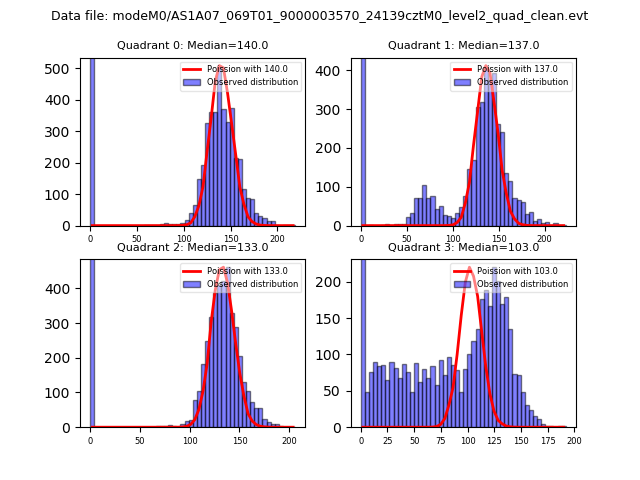 |
 |
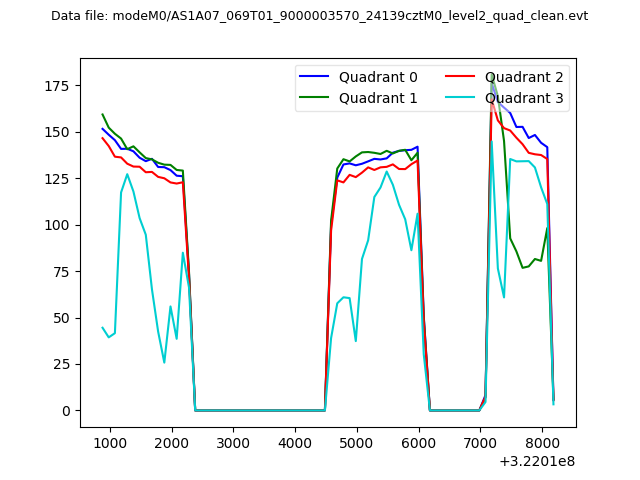
| Quadrant-wise count rates Data is divided into 100 sec bins |
 |
|
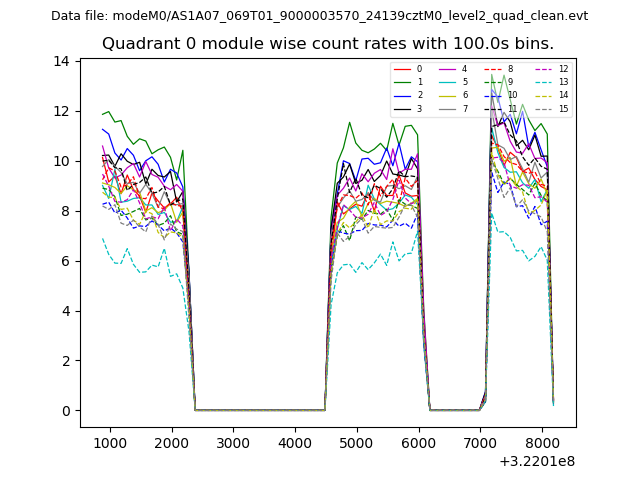
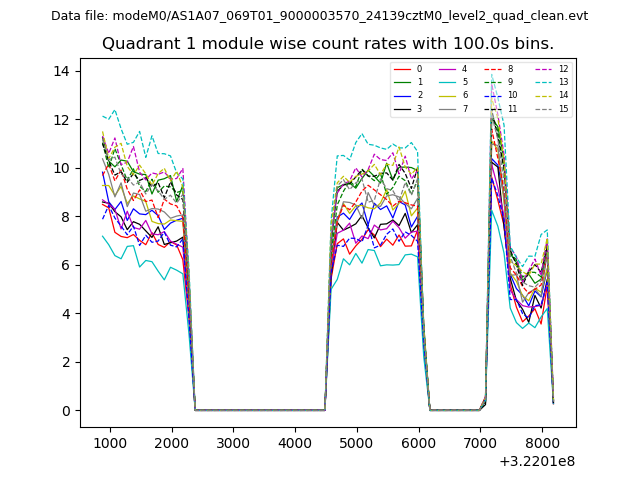
| Module-wise count rates for Quadrant A Data is divided into 100 sec bins |
 |
 |
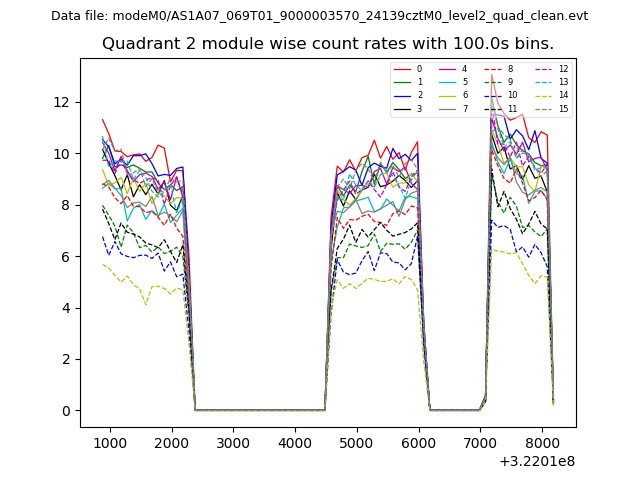
| Module-wise count rates for Quadrant B Data is divided into 100 sec bins |
 |
 |
| Module-wise count rates for Quadrant C Data is divided into 100 sec bins |
 |
 |
| Module-wise count rates for Quadrant D Data is divided into 100 sec bins |
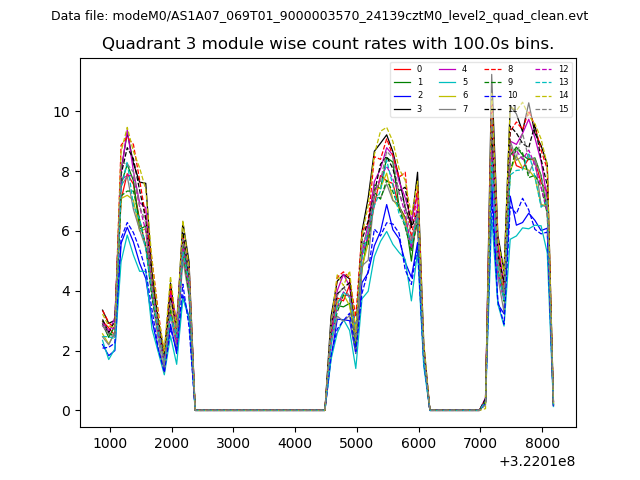 |
 |
| Parameter | Plot |
|---|---|
| CZT HV Monitor | 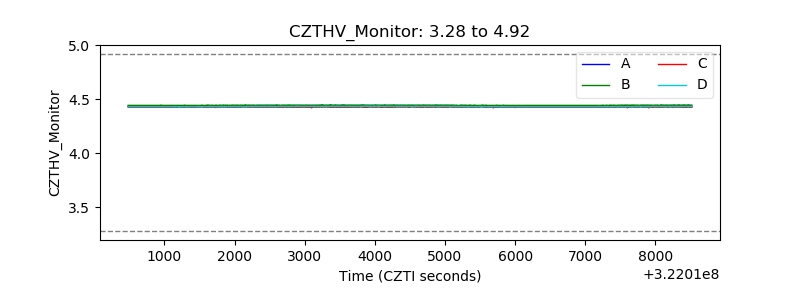 |
| D_VDD | 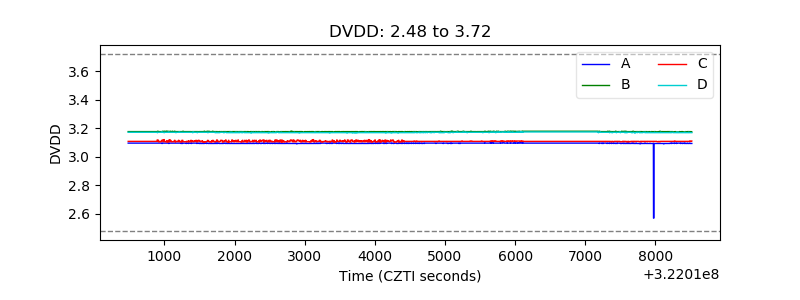 |
| Temperature 1 | 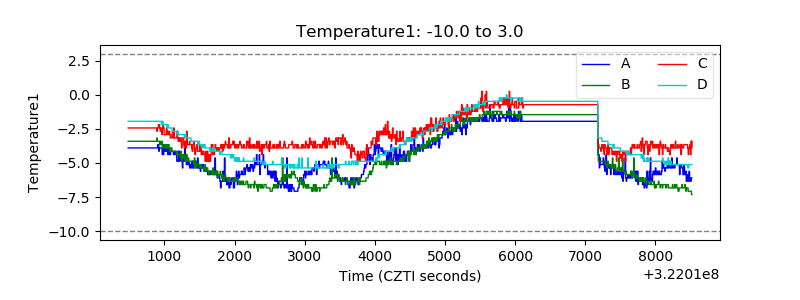 |
| Veto HV Monitor | 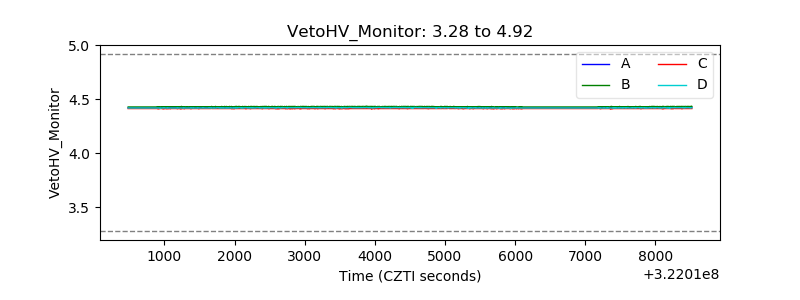 |
| Veto LLD |  |
| Alpha Counter | 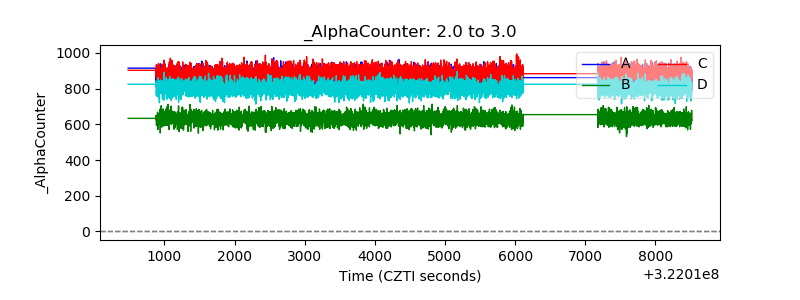 |
| _CPM_Rate | 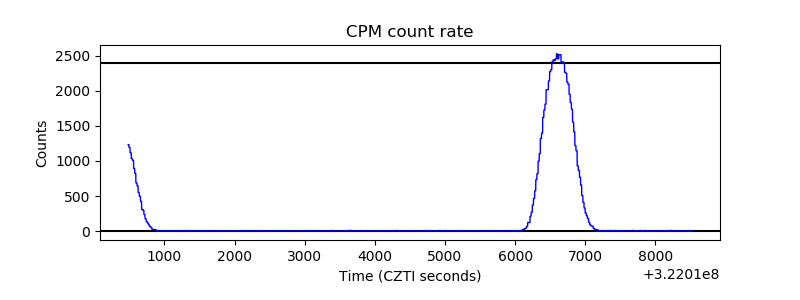 |
| CZT Counter | 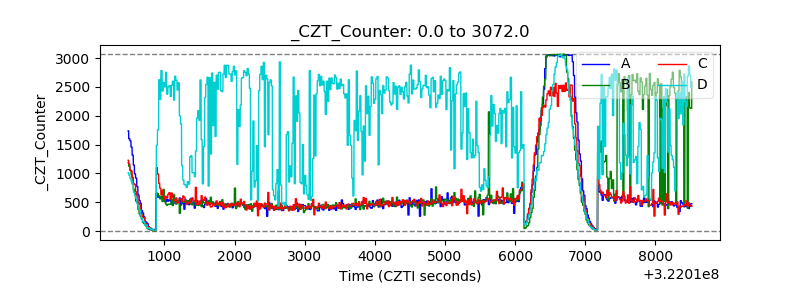 |
| +2.5 Volts monitor |  |
| +5 Volts monitor |  |
| _ROLL_ROT | 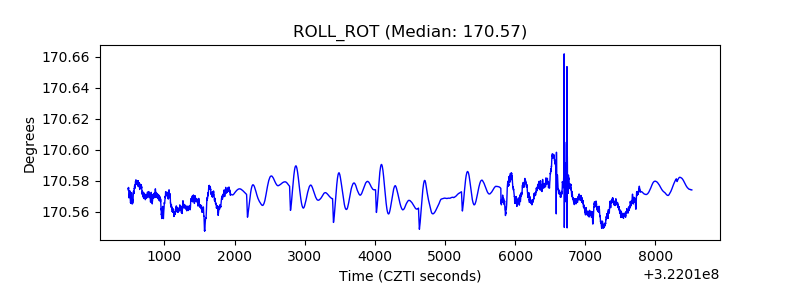 |
| _Roll_DEC | 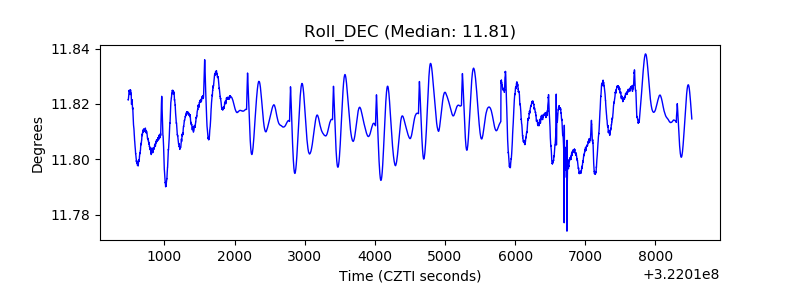 |
| _Roll_RA | 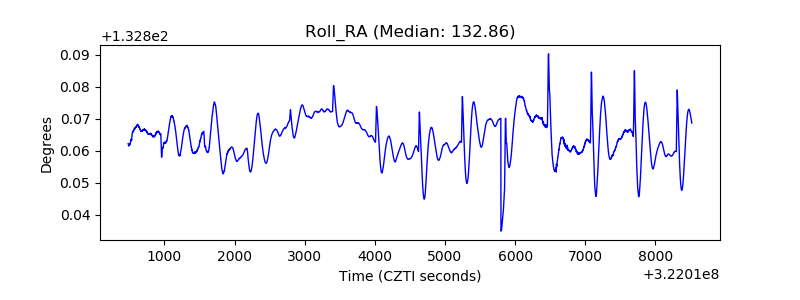 |
| Veto Counter |  |