| Param | Original file | Final file |
|---|---|---|
| Filename | modeM0/AS1A07_069T01_9000003570_24141cztM0_level2.evt | modeM0/AS1A07_069T01_9000003570_24141cztM0_level2_quad_clean.evt |
| Size (bytes) | 873,725,760 | 71,654,400 |
| Size | 833.2 MB | 68.3 MB |
| Events in quadrant A | 3,112,471 | 488,625 |
| Events in quadrant B | 8,282,207 | 431,799 |
| Events in quadrant C | 3,123,546 | 463,510 |
| Events in quadrant D | 11,525,085 | 352,444 |
| Mode SS | |||
|---|---|---|---|
| Quadrant | BADHDUFLAG | Total packets | Discarded packets |
| A | 0 | 126 | 0 |
| B | 0 | 126 | 0 |
| C | 0 | 126 | 0 |
| D | 0 | 126 | 0 |
| Mode M0 | |||
|---|---|---|---|
| Quadrant | BADHDUFLAG | Total packets | Discarded packets |
| A | 0 | 12949 | 1 |
| B | 0 | 28460 | 1 |
| C | 0 | 12978 | 1 |
| D | 0 | 38519 | 1 |
| Mode M9 | |||
|---|---|---|---|
| Quadrant | BADHDUFLAG | Total packets | Discarded packets |
| A | 0 | 12 | 0 |
| B | 0 | 12 | 0 |
| C | 0 | 12 | 0 |
| D | 0 | 12 | 0 |
| Quadrant | Total seconds | Saturated seconds | Saturation percentage |
|---|---|---|---|
| A | 6192 | 22 | 0.355297% |
| B | 6192 | 2644 | 42.700258% |
| C | 6193 | 34 | 0.549007% |
| D | 6193 | 3205 | 51.751978% |
Noise dominated data is calculated using 1-second bins in cleaned event files. If a bin has >2000 counts, and if more than 50% of those come from <1% of pixels, then it is considered to be noise-dominated and hence unusable.
| Quadrant | # 1 sec bins | Bins with >0 counts | Bins with >2000 counts | High rate bins dominated by noise | Noise dominated (total time) | Noise dominated (detector-on time) | Marked lightcurve |
|---|---|---|---|---|---|---|---|
| A | 7382 | 6193 | 0 | 0 | 0.00% | 0.00% | 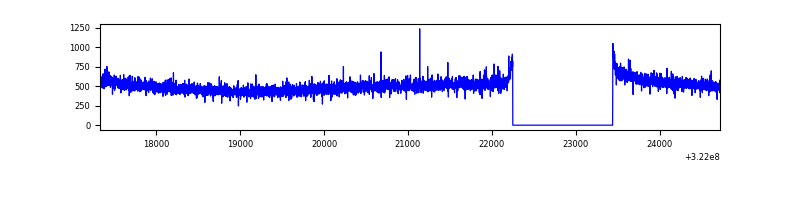 |
| B | 7382 | 6193 | 2479 | 2479 | 33.58% | 40.03% | 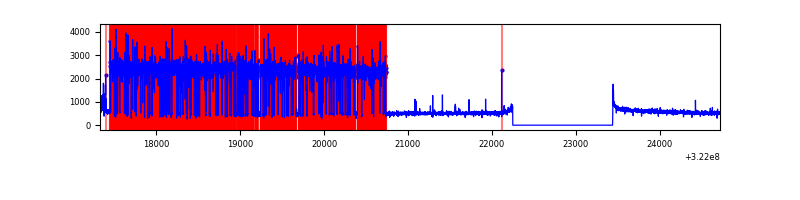 |
| C | 7383 | 6194 | 0 | 0 | 0.00% | 0.00% | 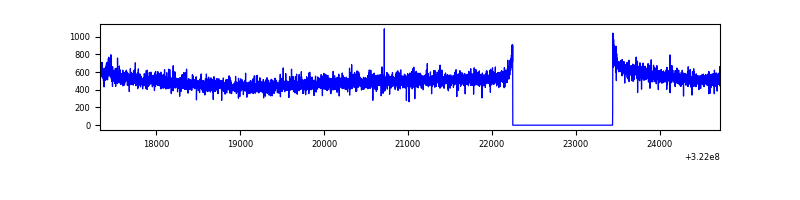 |
| D | 7383 | 6194 | 3108 | 3108 | 42.10% | 50.18% | 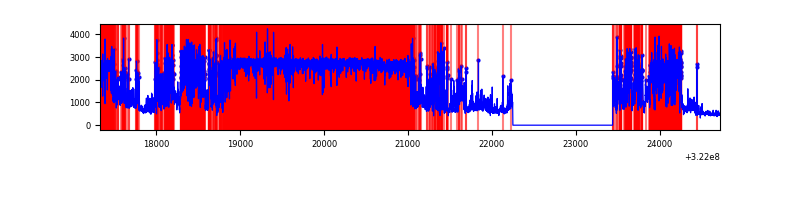 |
Top three noisy pixels from each quadrant. If the there are fewer than three noisy pixels in the level2.evt file, extra rows are filled as -1
| Pixel properties | Quadrant properties | ||||||
|---|---|---|---|---|---|---|---|
| Quadrant | DetID | PixID | Counts | Sigma | Mean | Median | Sigma |
| A | 13 | 254 | 10326 | 59.22 | 806 | 792 | 161.0 |
| A | 0 | 226 | 7059 | 38.93 | 806 | 792 | 161.0 |
| A | 3 | 137 | 6975 | 38.41 | 806 | 792 | 161.0 |
| B | 4 | 200 | 5570259 | 43234.04 | 688 | 671 | 128.8 |
| B | 12 | 111 | 14974 | 111.03 | 688 | 671 | 128.8 |
| B | 11 | 111 | 13346 | 98.39 | 688 | 671 | 128.8 |
| C | 14 | 238 | 122722 | 679.78 | 764 | 770 | 179.4 |
| C | 1 | 16 | 13020 | 68.28 | 764 | 770 | 179.4 |
| C | 0 | 239 | 6729 | 33.22 | 764 | 770 | 179.4 |
| D | 7 | 238 | 9160361 | 67434.86 | 563 | 550 | 135.8 |
| D | 8 | 195 | 120720 | 884.7 | 563 | 550 | 135.8 |
| D | 1 | 52 | 99966 | 731.9 | 563 | 550 | 135.8 |
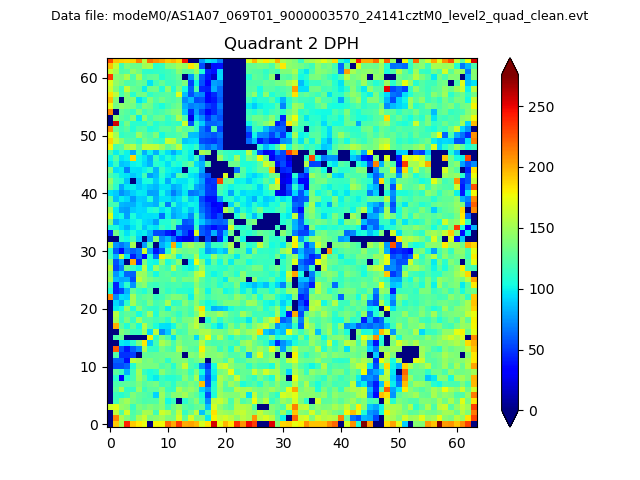
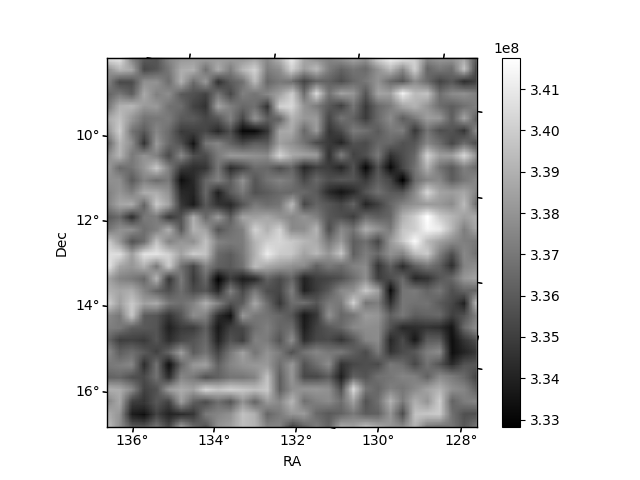
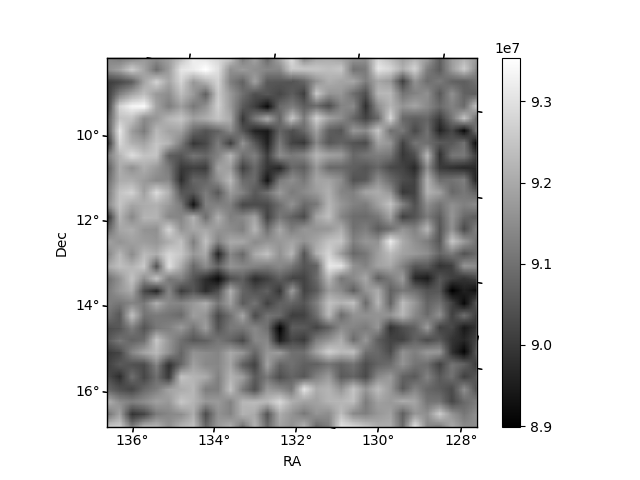
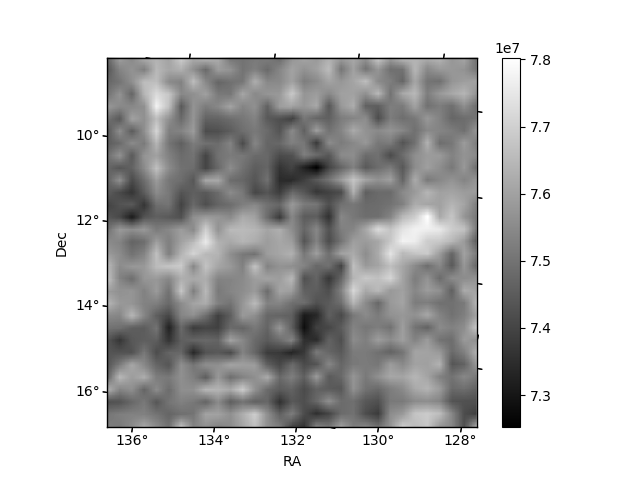
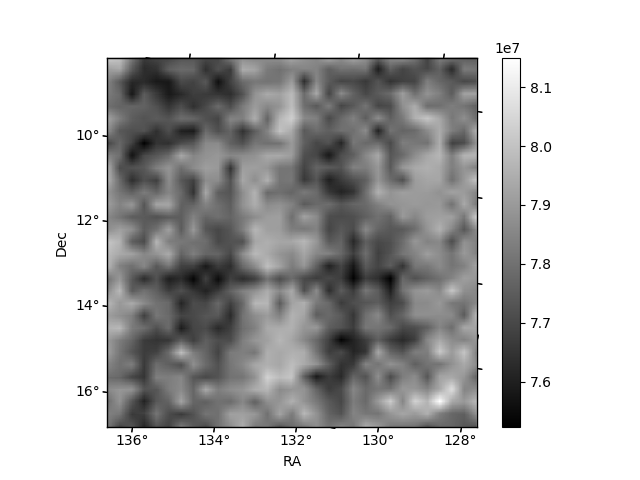
Histogram calculated using DETX and DETY for each event in the final _common_clean file
| Quadrant A | 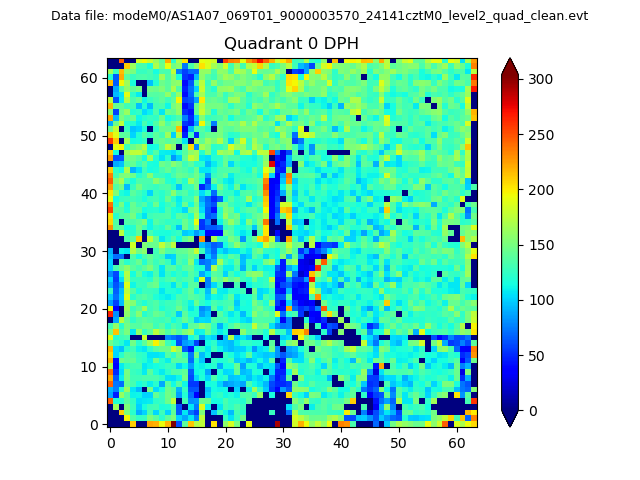 |
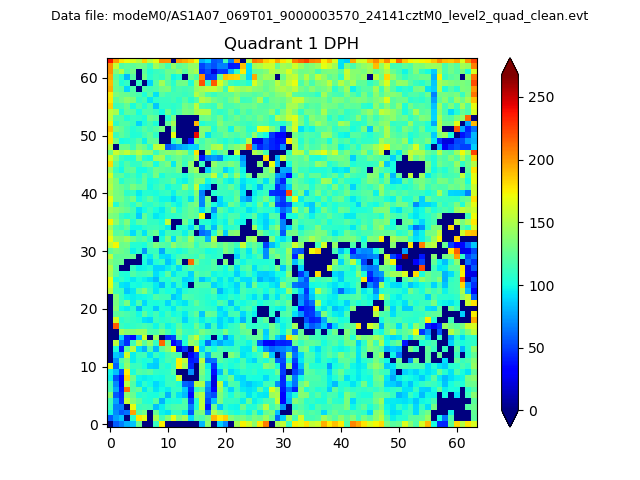 |
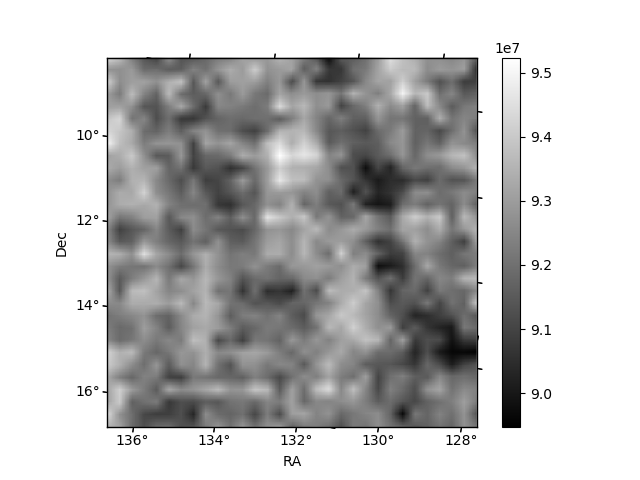
Quadrant B |
|---|---|---|---|
| Quadrant D | 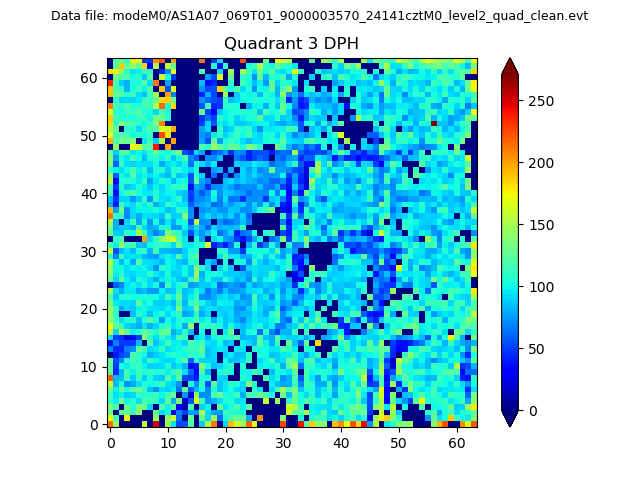 |
 |
Quadrant C |
| Plot type | Count rate plots | Images |
|---|---|---|
| Comparison with Poisson distribution Blue bars denote a histogram of data divided into 1 sec bins. Red curve is a Poisson curve with rate = median count rate of data. |
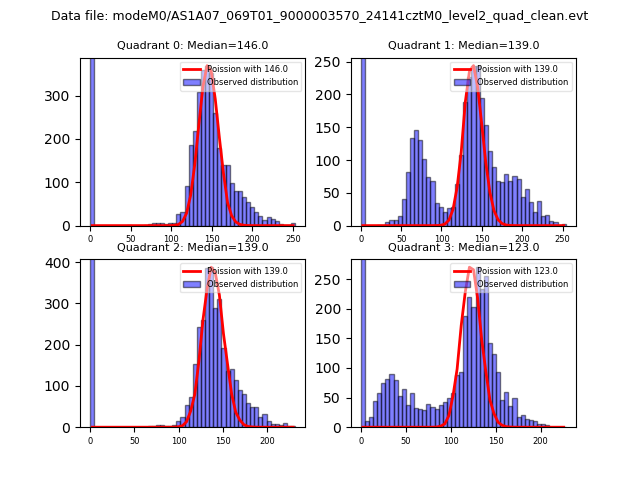 |
 |
| Quadrant-wise count rates Data is divided into 100 sec bins |
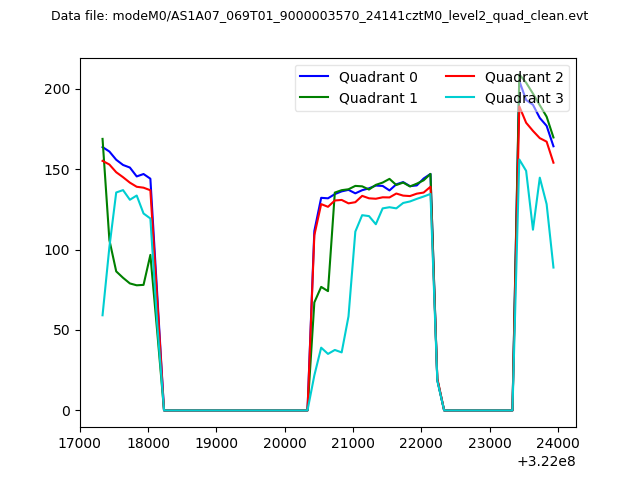 |
|
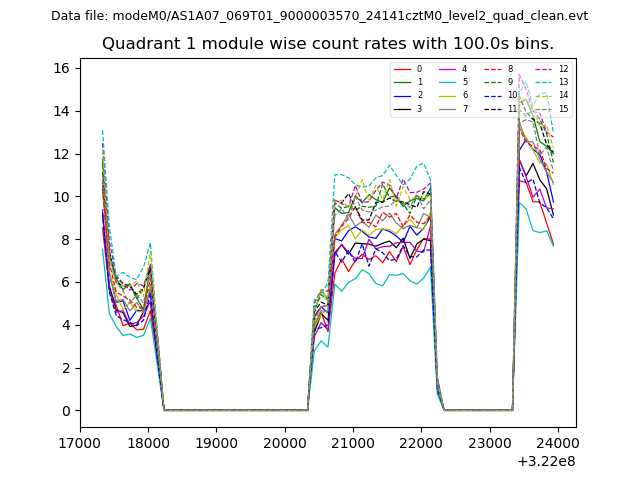
| Module-wise count rates for Quadrant A Data is divided into 100 sec bins |
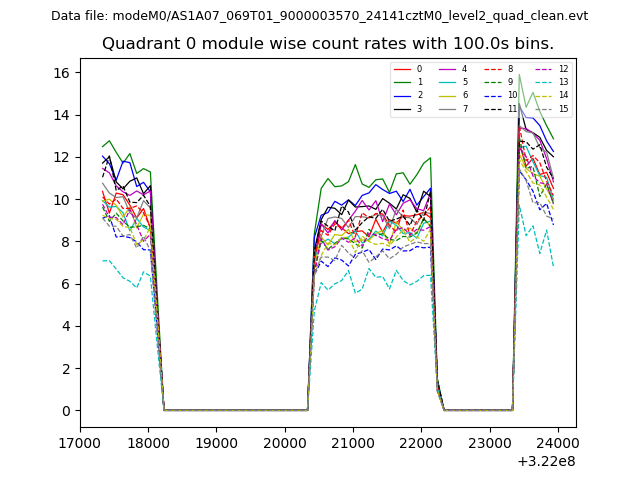 |
 |
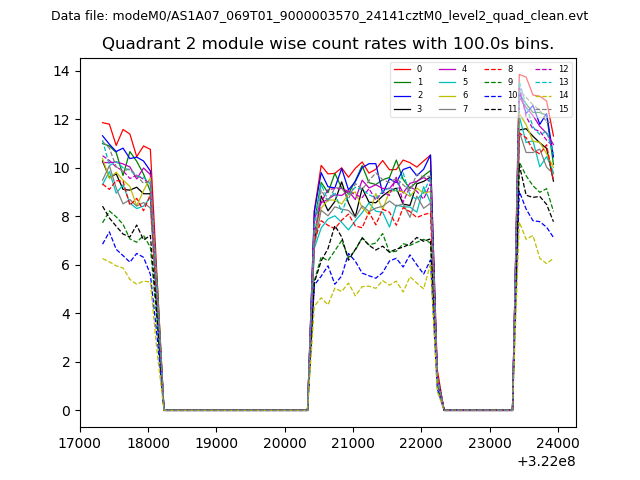
| Module-wise count rates for Quadrant B Data is divided into 100 sec bins |
 |
 |
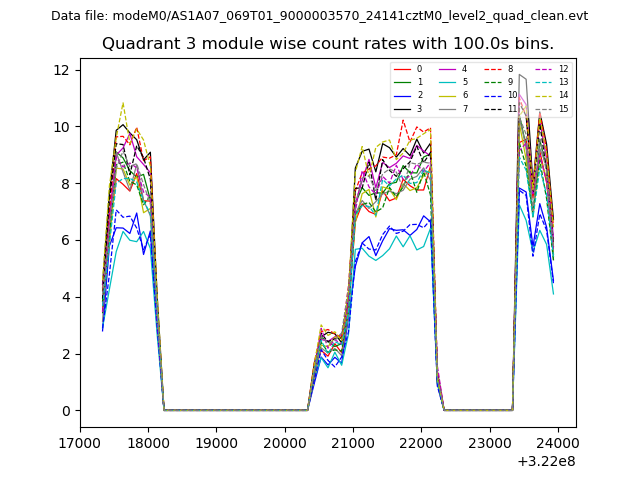
| Module-wise count rates for Quadrant C Data is divided into 100 sec bins |
 |
 |
| Module-wise count rates for Quadrant D Data is divided into 100 sec bins |
 |
 |
| Parameter | Plot |
|---|---|
| CZT HV Monitor | 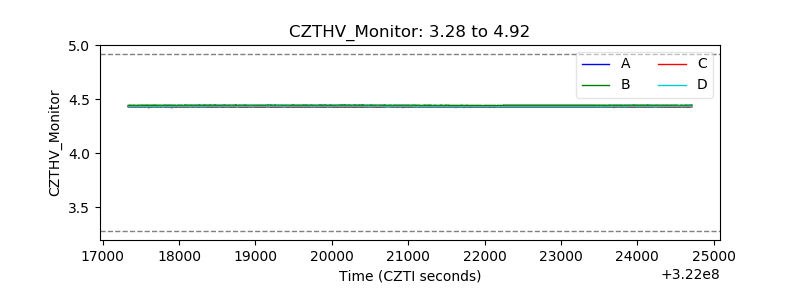 |
| D_VDD | 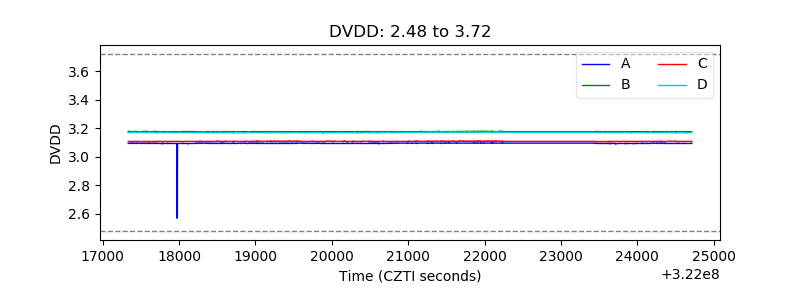 |
| Temperature 1 | 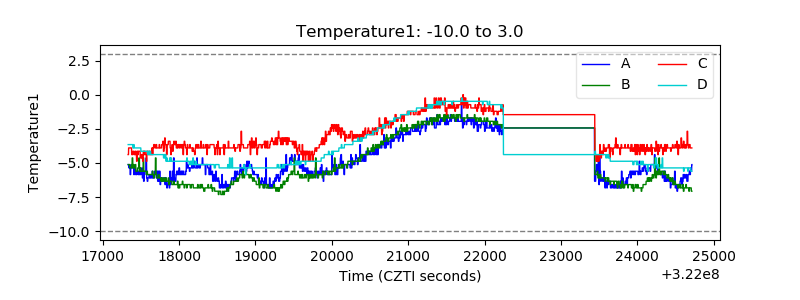 |
| Veto HV Monitor | 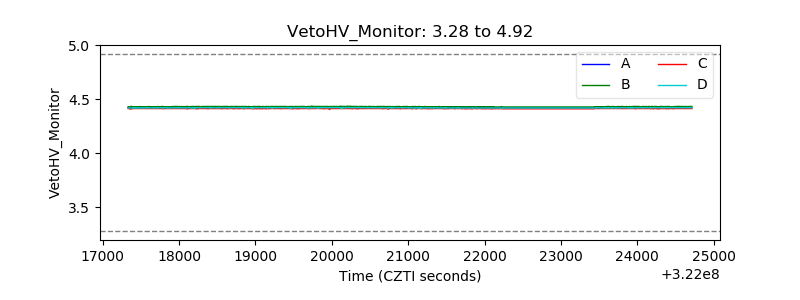 |
| Veto LLD |  |
| Alpha Counter | 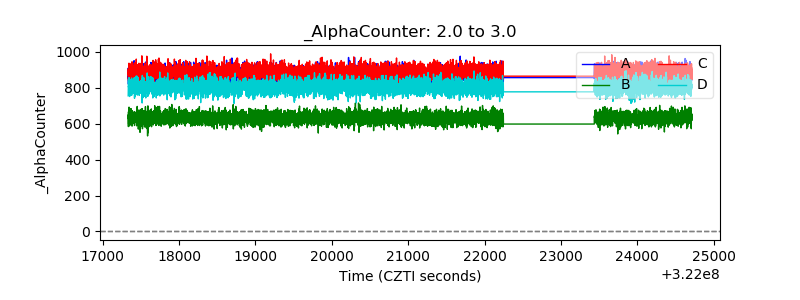 |
| _CPM_Rate | 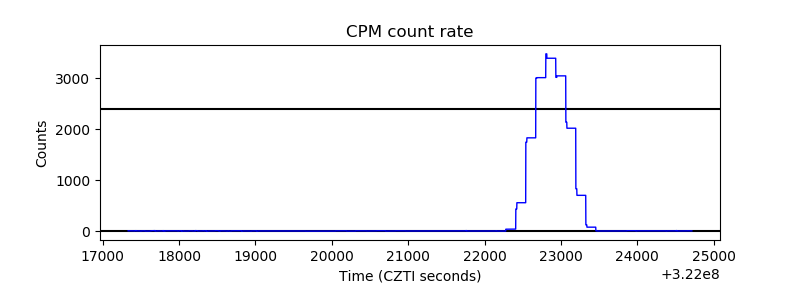 |
| CZT Counter | 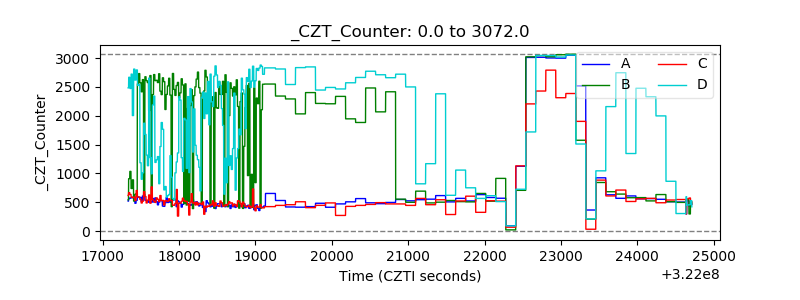 |
| +2.5 Volts monitor |  |
| +5 Volts monitor |  |
| _ROLL_ROT |  |
| _Roll_DEC | 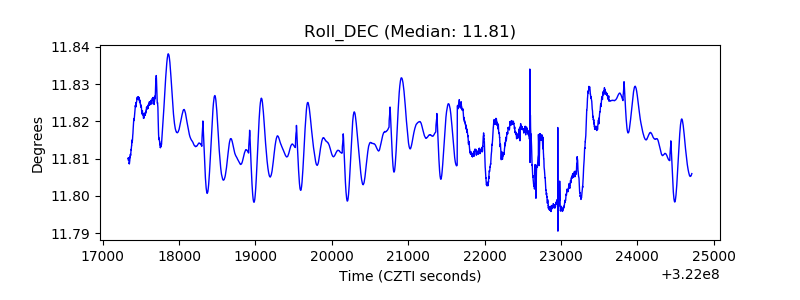 |
| _Roll_RA | 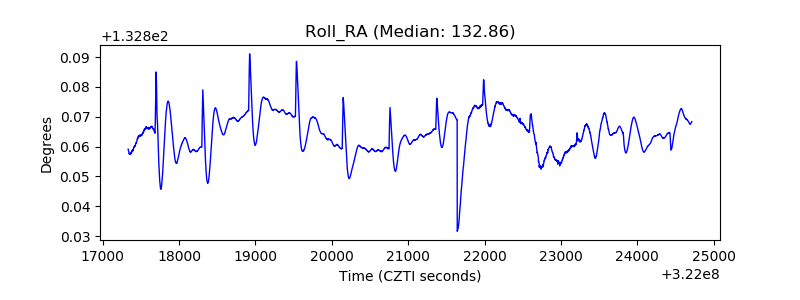 |
| Veto Counter | 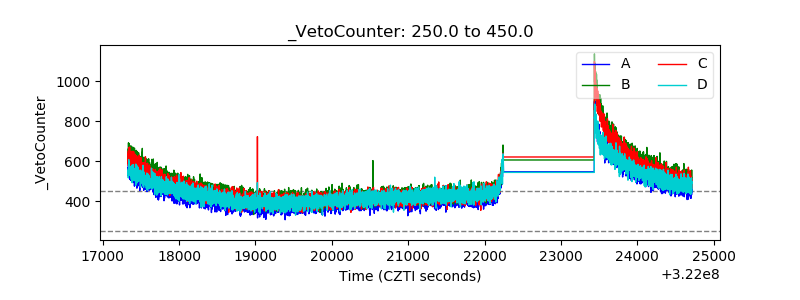 |