| Param | Original file | Final file |
|---|---|---|
| Filename | modeM0/AS1A07_069T01_9000003570_24142cztM0_level2.evt | modeM0/AS1A07_069T01_9000003570_24142cztM0_level2_quad_clean.evt |
| Size (bytes) | 563,365,440 | 69,477,120 |
| Size | 537.3 MB | 66.3 MB |
| Events in quadrant A | 3,370,096 | 442,767 |
| Events in quadrant B | 3,476,787 | 454,057 |
| Events in quadrant C | 3,405,196 | 417,574 |
| Events in quadrant D | 6,381,459 | 347,942 |
| Mode SS | |||
|---|---|---|---|
| Quadrant | BADHDUFLAG | Total packets | Discarded packets |
| A | 0 | 128 | 0 |
| B | 0 | 128 | 0 |
| C | 0 | 128 | 0 |
| D | 0 | 128 | 0 |
| Mode M0 | |||
|---|---|---|---|
| Quadrant | BADHDUFLAG | Total packets | Discarded packets |
| A | 0 | 13700 | 0 |
| B | 0 | 14106 | 0 |
| C | 0 | 13799 | 0 |
| D | 0 | 23194 | 0 |
| Mode M9 | |||
|---|---|---|---|
| Quadrant | BADHDUFLAG | Total packets | Discarded packets |
| A | 0 | 13 | 0 |
| B | 0 | 13 | 0 |
| C | 0 | 13 | 0 |
| D | 0 | 13 | 0 |
| Quadrant | Total seconds | Saturated seconds | Saturation percentage |
|---|---|---|---|
| A | 6320 | 22 | 0.348101% |
| B | 6320 | 34 | 0.537975% |
| C | 6321 | 51 | 0.806834% |
| D | 6321 | 961 | 15.203291% |
Noise dominated data is calculated using 1-second bins in cleaned event files. If a bin has >2000 counts, and if more than 50% of those come from <1% of pixels, then it is considered to be noise-dominated and hence unusable.
| Quadrant | # 1 sec bins | Bins with >0 counts | Bins with >2000 counts | High rate bins dominated by noise | Noise dominated (total time) | Noise dominated (detector-on time) | Marked lightcurve |
|---|---|---|---|---|---|---|---|
| A | 7600 | 6321 | 0 | 0 | 0.00% | 0.00% | 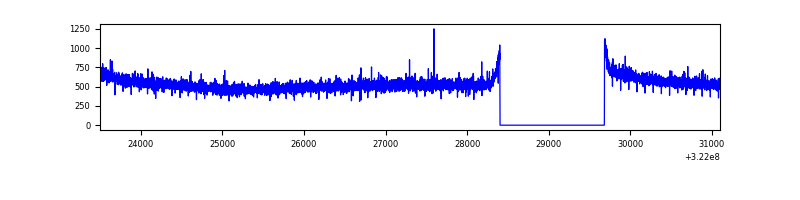 |
| B | 7600 | 6320 | 2 | 2 | 0.03% | 0.03% |  |
| C | 7601 | 6322 | 0 | 0 | 0.00% | 0.00% | 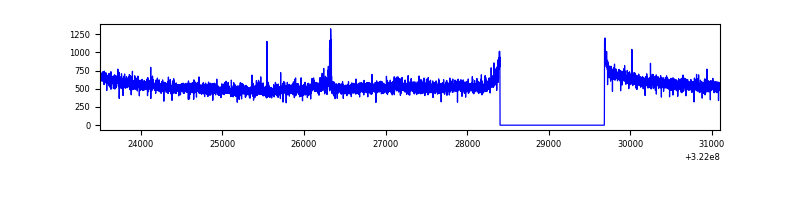 |
| D | 7601 | 6321 | 855 | 855 | 11.25% | 13.53% | 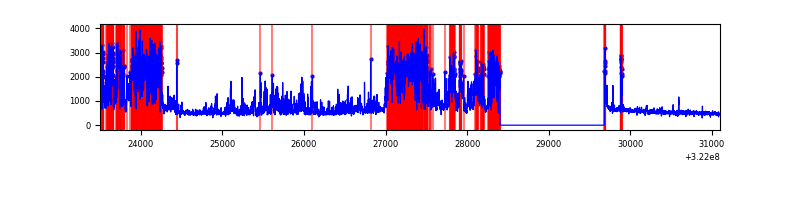 |
Top three noisy pixels from each quadrant. If the there are fewer than three noisy pixels in the level2.evt file, extra rows are filled as -1
| Pixel properties | Quadrant properties | ||||||
|---|---|---|---|---|---|---|---|
| Quadrant | DetID | PixID | Counts | Sigma | Mean | Median | Sigma |
| A | 13 | 254 | 10581 | 56.45 | 874 | 861 | 172.2 |
| A | 0 | 226 | 7503 | 38.57 | 874 | 861 | 172.2 |
| A | 3 | 137 | 7070 | 36.06 | 874 | 861 | 172.2 |
| B | 12 | 111 | 18676 | 110.5 | 876 | 858 | 161.2 |
| B | 11 | 111 | 16370 | 96.2 | 876 | 858 | 161.2 |
| B | 15 | 32 | 15512 | 90.88 | 876 | 858 | 161.2 |
| C | 14 | 238 | 132010 | 693.0 | 821 | 830 | 189.3 |
| C | 3 | 233 | 28172 | 144.44 | 821 | 830 | 189.3 |
| C | 1 | 16 | 25847 | 132.16 | 821 | 830 | 189.3 |
| D | 7 | 238 | 3172435 | 17141.65 | 769 | 749 | 185.0 |
| D | 1 | 52 | 155481 | 836.26 | 769 | 749 | 185.0 |
| D | 8 | 195 | 141018 | 758.1 | 769 | 749 | 185.0 |
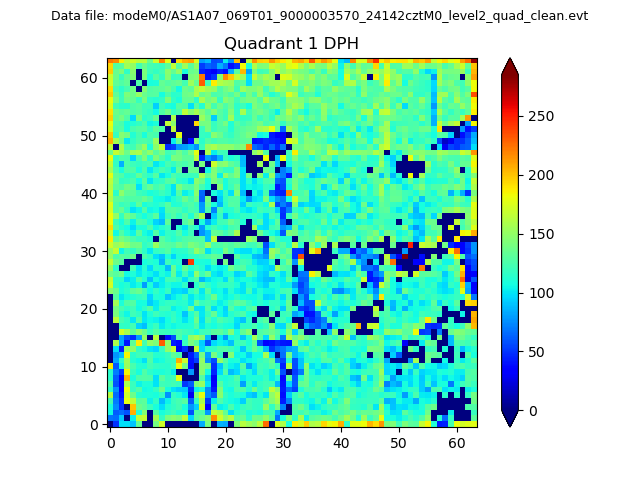
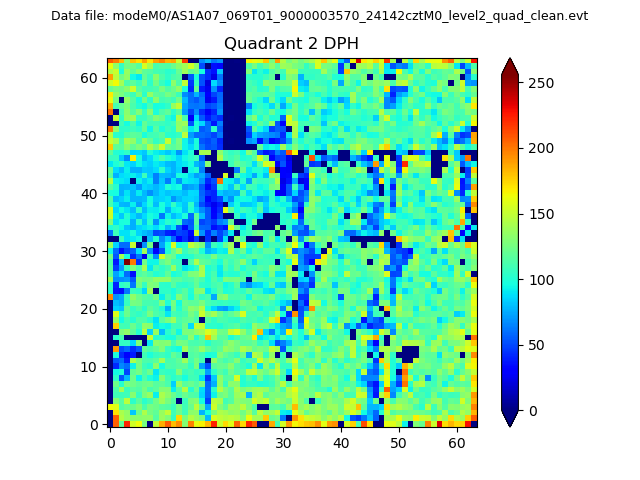
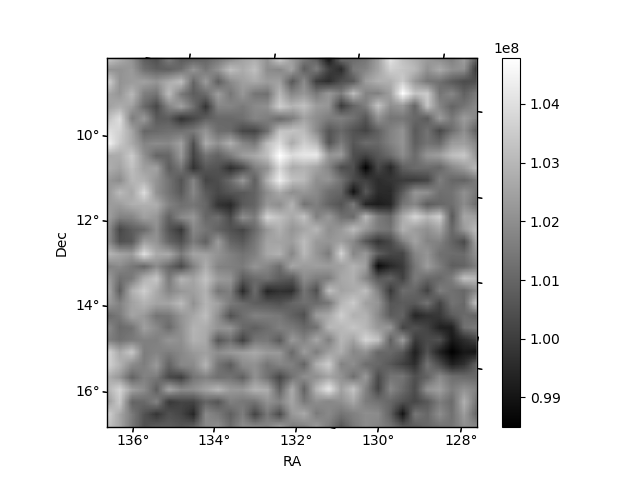
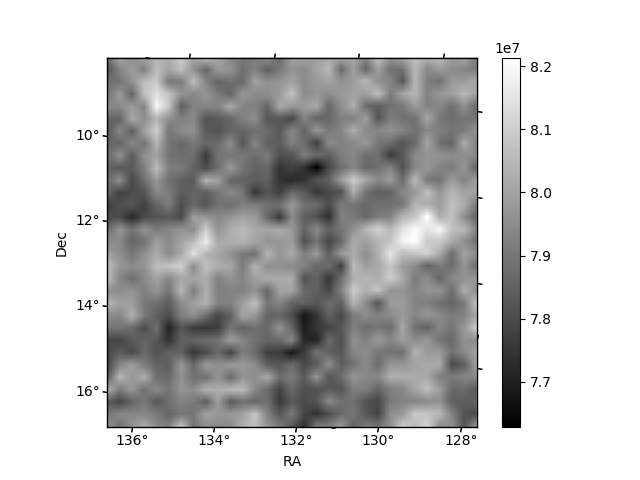
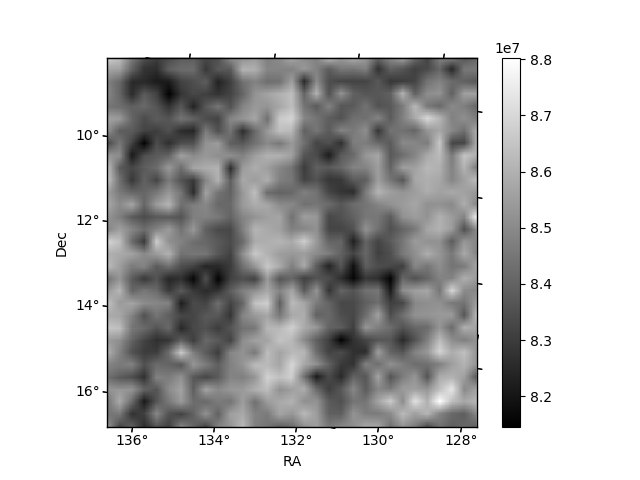
Histogram calculated using DETX and DETY for each event in the final _common_clean file
| Quadrant A |  |
 |
Quadrant B |
|---|---|---|---|
| Quadrant D | 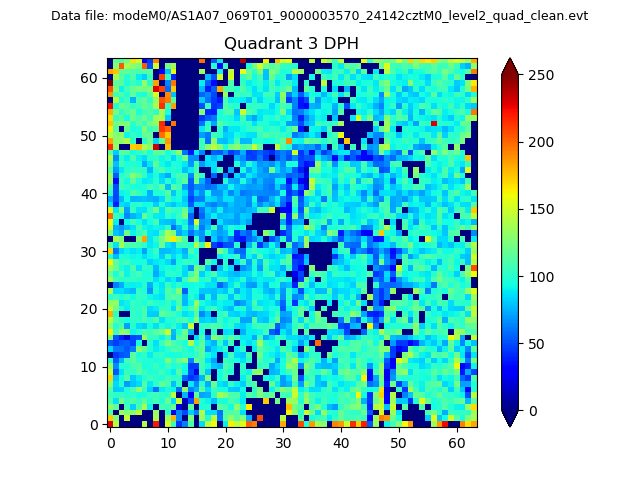 |
 |
Quadrant C |
| Plot type | Count rate plots | Images |
|---|---|---|
| Comparison with Poisson distribution Blue bars denote a histogram of data divided into 1 sec bins. Red curve is a Poisson curve with rate = median count rate of data. |
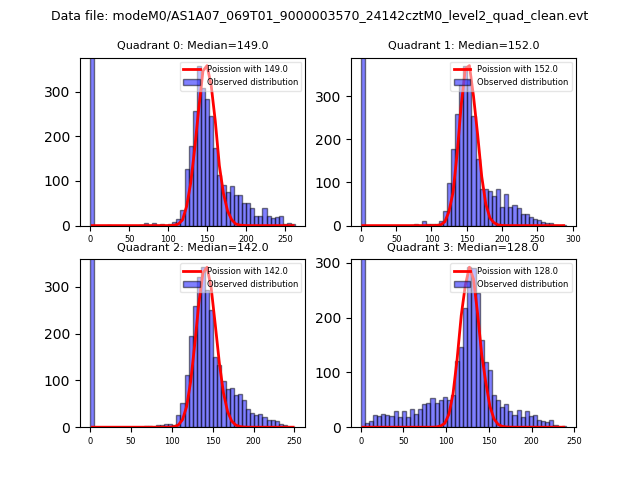 |
 |
| Quadrant-wise count rates Data is divided into 100 sec bins |
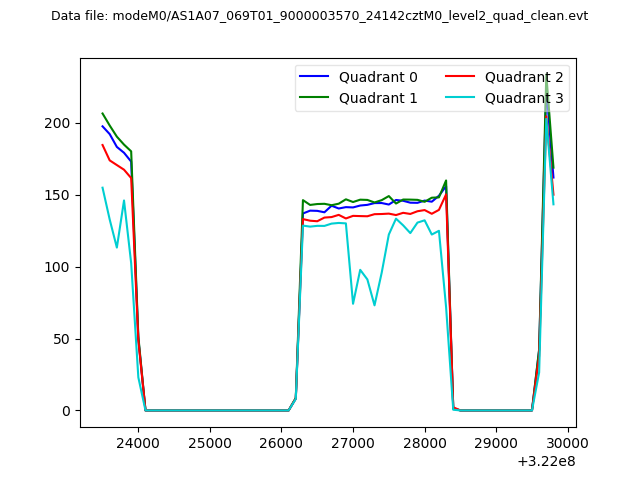 |
|
| Module-wise count rates for Quadrant A Data is divided into 100 sec bins |
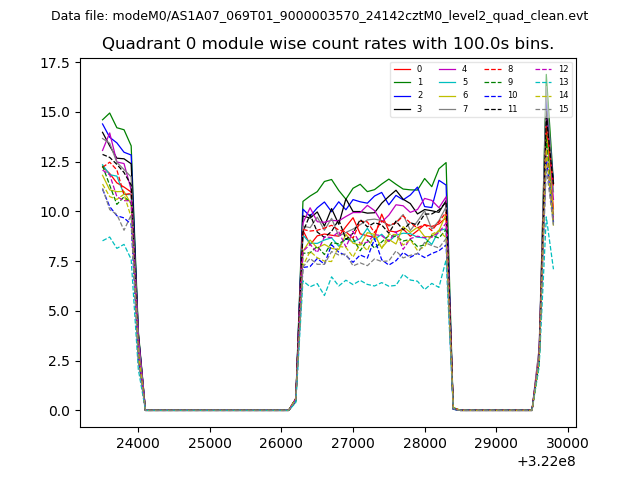 |
 |
| Module-wise count rates for Quadrant B Data is divided into 100 sec bins |
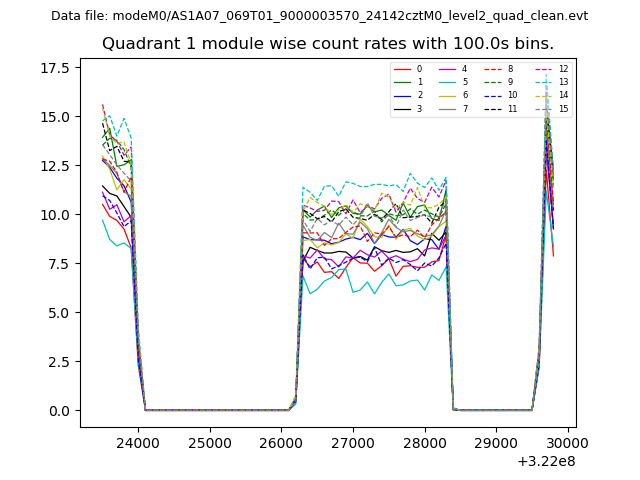 |
 |
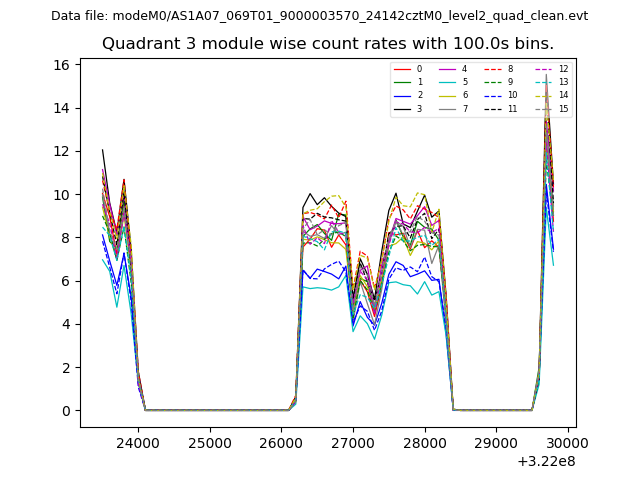
| Module-wise count rates for Quadrant C Data is divided into 100 sec bins |
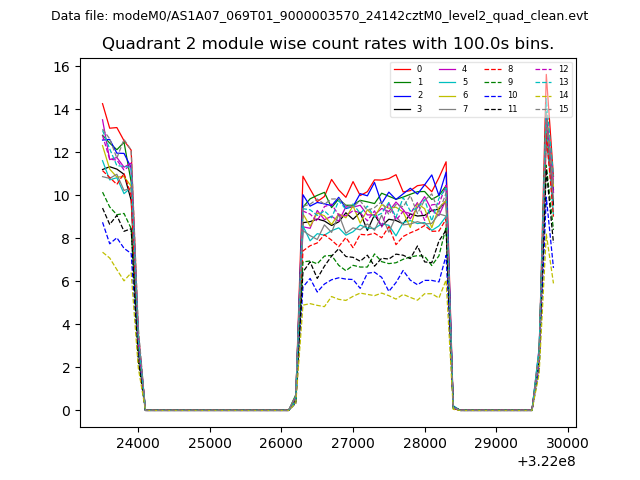 |
 |
| Module-wise count rates for Quadrant D Data is divided into 100 sec bins |
 |
 |
| Parameter | Plot |
|---|---|
| CZT HV Monitor | 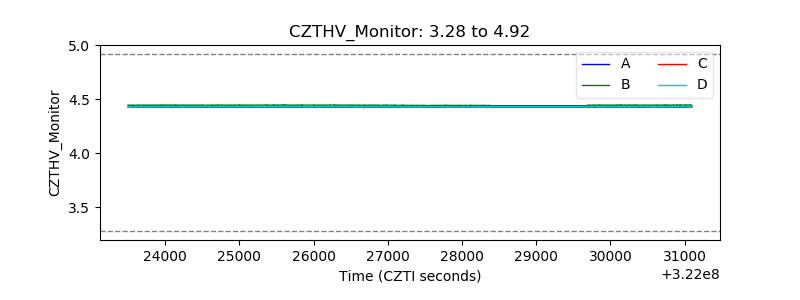 |
| D_VDD | 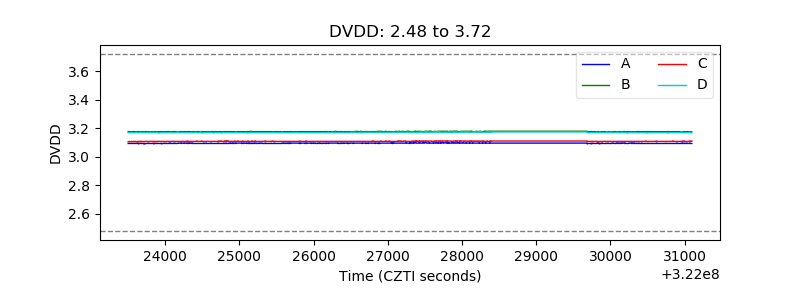 |
| Temperature 1 | 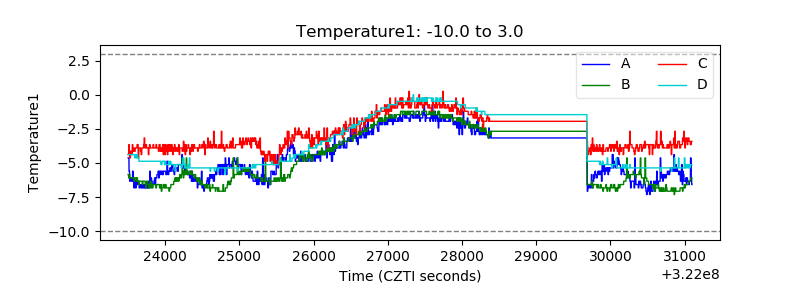 |
| Veto HV Monitor | 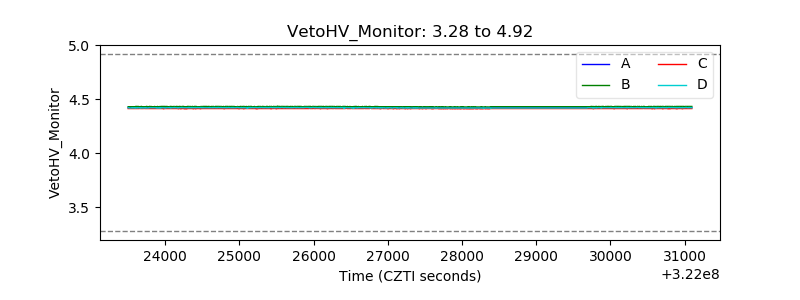 |
| Veto LLD | 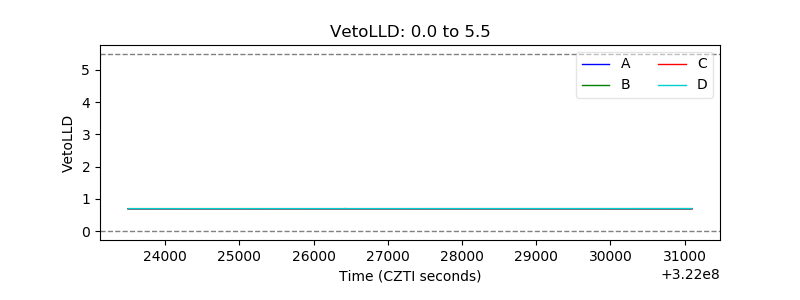 |
| Alpha Counter | 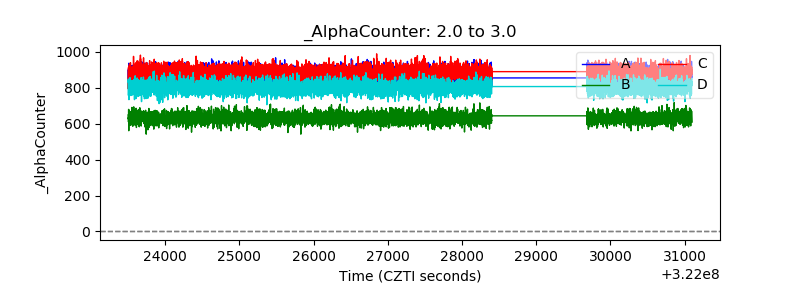 |
| _CPM_Rate | 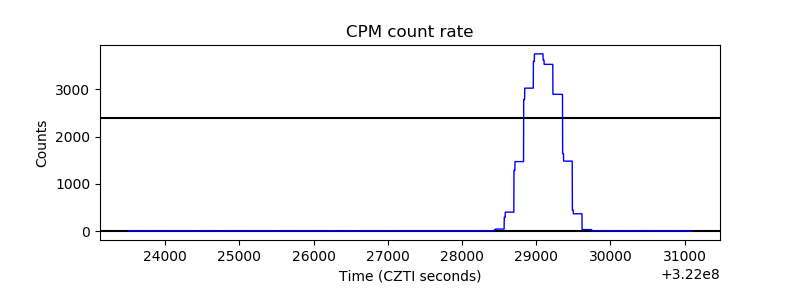 |
| CZT Counter | 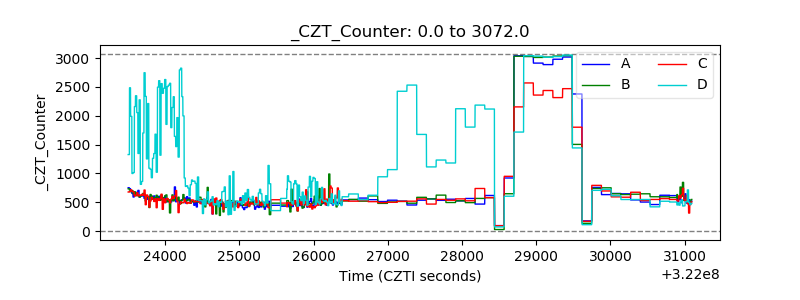 |
| +2.5 Volts monitor |  |
| +5 Volts monitor |  |
| _ROLL_ROT | 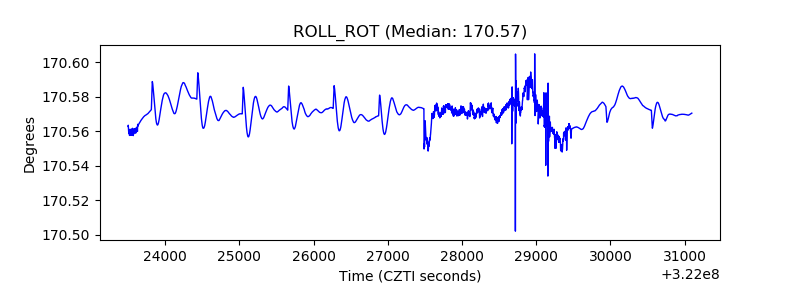 |
| _Roll_DEC | 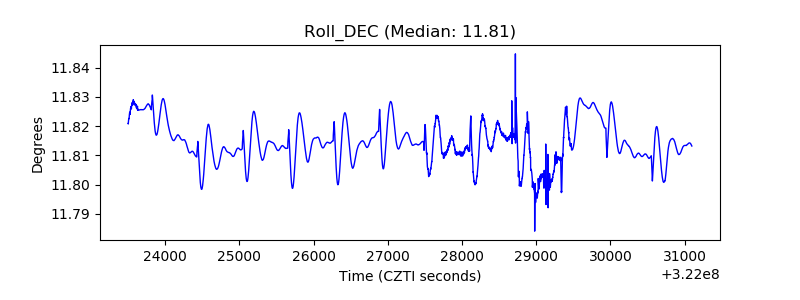 |
| _Roll_RA | 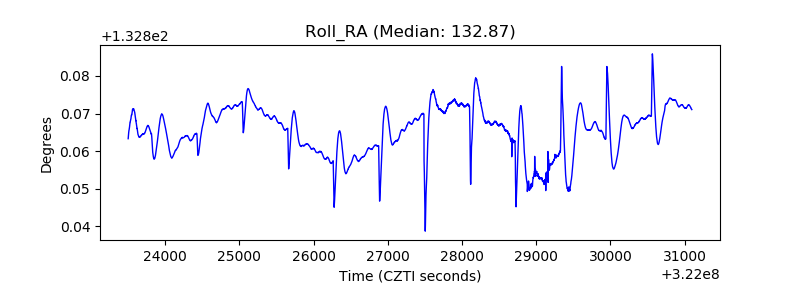 |
| Veto Counter | 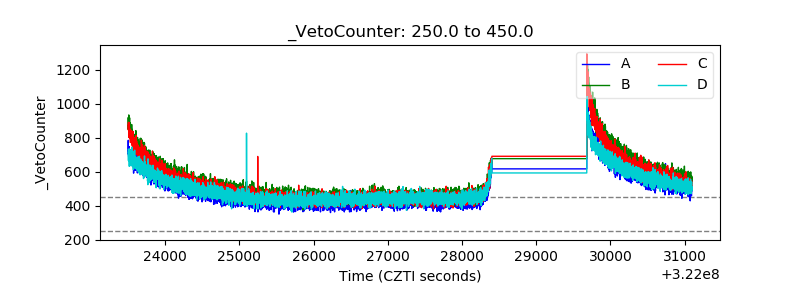 |