| Param | Original file | Final file |
|---|---|---|
| Filename | modeM0/AS1A07_069T01_9000003570_24143cztM0_level2.evt | modeM0/AS1A07_069T01_9000003570_24143cztM0_level2_quad_clean.evt |
| Size (bytes) | 615,329,280 | 64,575,360 |
| Size | 586.8 MB | 61.6 MB |
| Events in quadrant A | 3,514,424 | 408,680 |
| Events in quadrant B | 3,609,166 | 415,827 |
| Events in quadrant C | 3,500,408 | 383,344 |
| Events in quadrant D | 7,585,787 | 308,285 |
| Mode SS | |||
|---|---|---|---|
| Quadrant | BADHDUFLAG | Total packets | Discarded packets |
| A | 0 | 126 | 0 |
| B | 0 | 126 | 0 |
| C | 0 | 126 | 0 |
| D | 0 | 126 | 0 |
| Mode M0 | |||
|---|---|---|---|
| Quadrant | BADHDUFLAG | Total packets | Discarded packets |
| A | 0 | 14122 | 1 |
| B | 0 | 14543 | 1 |
| C | 0 | 14118 | 2 |
| D | 0 | 26700 | 1 |
| Mode M9 | |||
|---|---|---|---|
| Quadrant | BADHDUFLAG | Total packets | Discarded packets |
| A | 0 | 17 | 0 |
| B | 0 | 18 | 0 |
| C | 0 | 18 | 0 |
| D | 0 | 18 | 0 |
| Quadrant | Total seconds | Saturated seconds | Saturation percentage |
|---|---|---|---|
| A | 6292 | 34 | 0.540369% |
| B | 6292 | 61 | 0.969485% |
| C | 6291 | 92 | 1.462407% |
| D | 6291 | 1662 | 26.418693% |
Noise dominated data is calculated using 1-second bins in cleaned event files. If a bin has >2000 counts, and if more than 50% of those come from <1% of pixels, then it is considered to be noise-dominated and hence unusable.
| Quadrant | # 1 sec bins | Bins with >0 counts | Bins with >2000 counts | High rate bins dominated by noise | Noise dominated (total time) | Noise dominated (detector-on time) | Marked lightcurve |
|---|---|---|---|---|---|---|---|
| A | 7662 | 6293 | 0 | 0 | 0.00% | 0.00% | 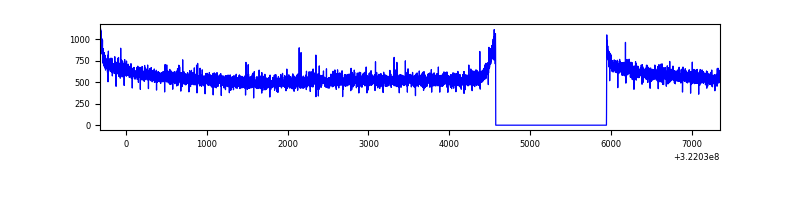 |
| B | 7662 | 6293 | 0 | 0 | 0.00% | 0.00% | 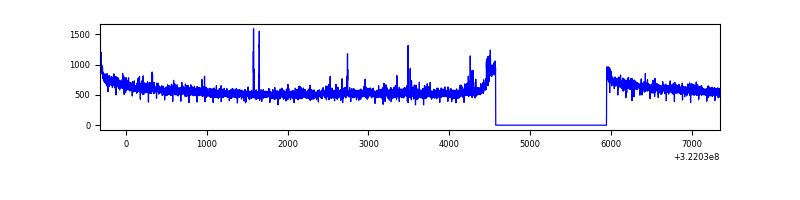 |
| C | 7661 | 6292 | 0 | 0 | 0.00% | 0.00% | 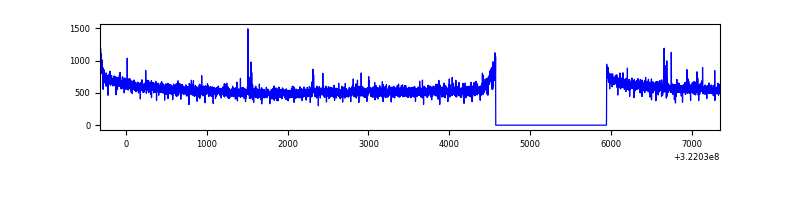 |
| D | 7661 | 6292 | 1523 | 1523 | 19.88% | 24.21% | 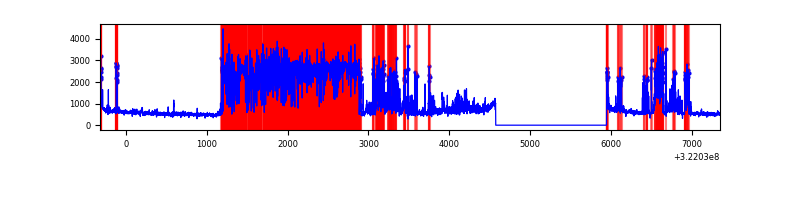 |
Top three noisy pixels from each quadrant. If the there are fewer than three noisy pixels in the level2.evt file, extra rows are filled as -1
| Pixel properties | Quadrant properties | ||||||
|---|---|---|---|---|---|---|---|
| Quadrant | DetID | PixID | Counts | Sigma | Mean | Median | Sigma |
| A | 13 | 254 | 10515 | 53.5 | 912 | 897 | 179.8 |
| A | 0 | 226 | 7828 | 38.55 | 912 | 897 | 179.8 |
| A | 3 | 137 | 7214 | 35.14 | 912 | 897 | 179.8 |
| B | 15 | 32 | 24632 | 140.21 | 912 | 897 | 169.3 |
| B | 12 | 111 | 19367 | 109.11 | 912 | 897 | 169.3 |
| B | 11 | 111 | 16595 | 92.73 | 912 | 897 | 169.3 |
| C | 14 | 238 | 138986 | 711.11 | 849 | 858 | 194.2 |
| C | 7 | 247 | 21104 | 104.23 | 849 | 858 | 194.2 |
| C | 0 | 239 | 15775 | 76.8 | 849 | 858 | 194.2 |
| D | 7 | 238 | 4436619 | 24167.86 | 767 | 747 | 183.5 |
| D | 1 | 52 | 137377 | 744.4 | 767 | 747 | 183.5 |
| D | 8 | 195 | 112472 | 608.71 | 767 | 747 | 183.5 |
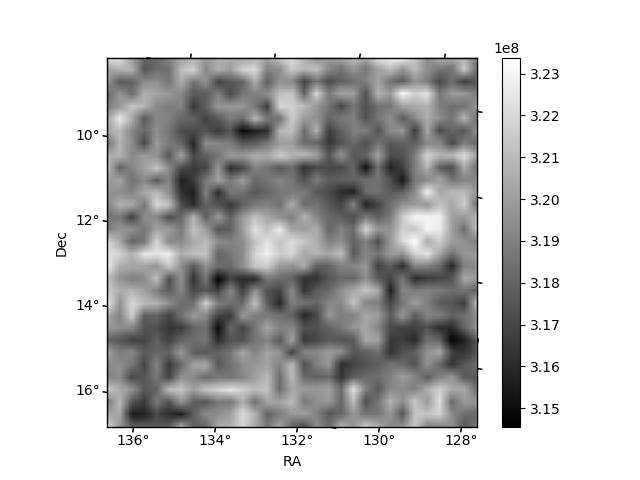
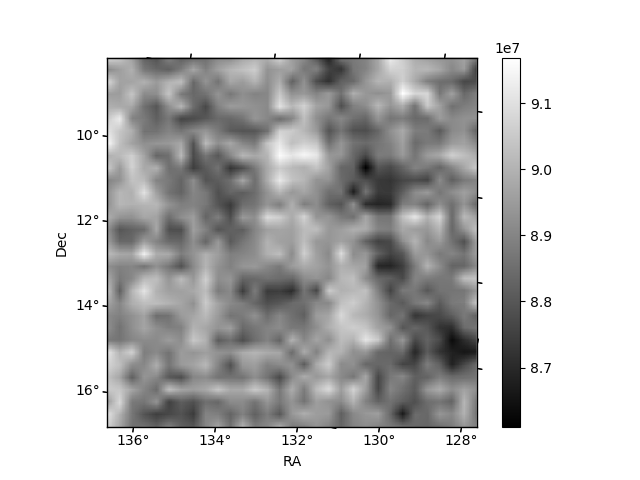
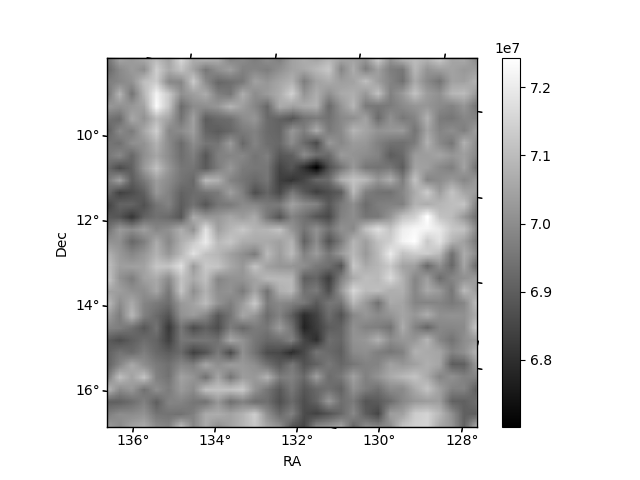
Histogram calculated using DETX and DETY for each event in the final _common_clean file
| Quadrant A | 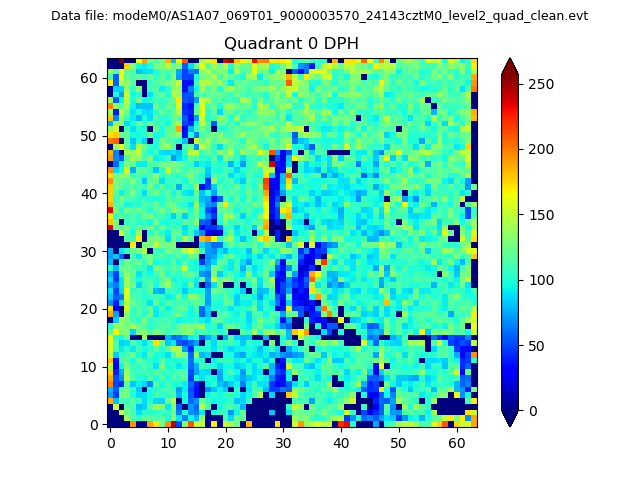 |
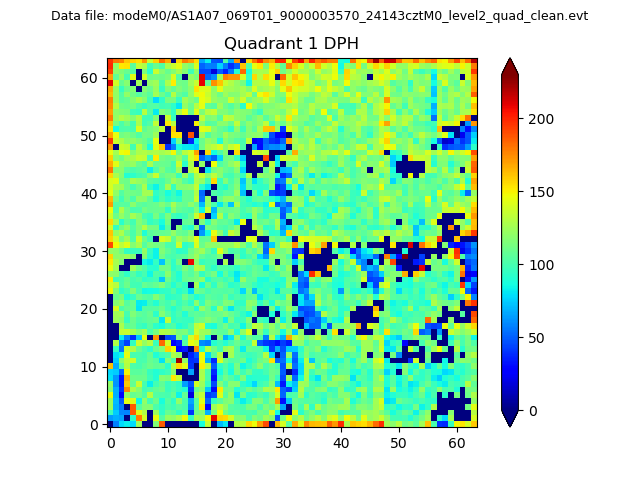 |
Quadrant B |
|---|---|---|---|
| Quadrant D | 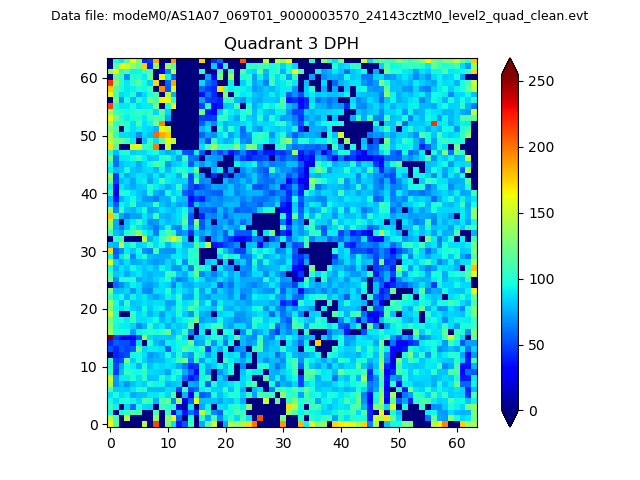 |
 |
Quadrant C |
| Plot type | Count rate plots | Images |
|---|---|---|
| Comparison with Poisson distribution Blue bars denote a histogram of data divided into 1 sec bins. Red curve is a Poisson curve with rate = median count rate of data. |
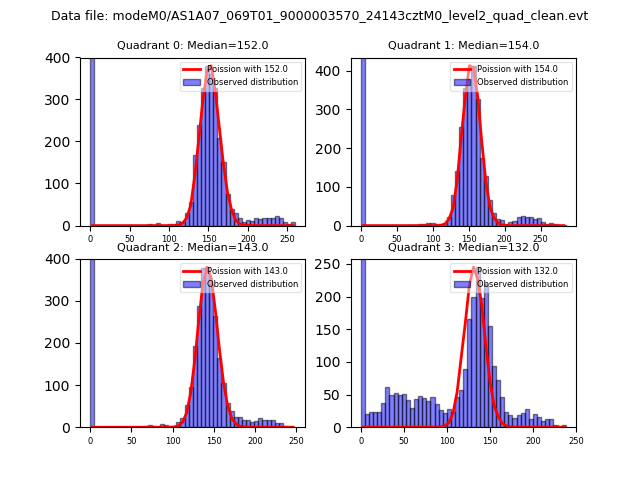 |
 |
| Quadrant-wise count rates Data is divided into 100 sec bins |
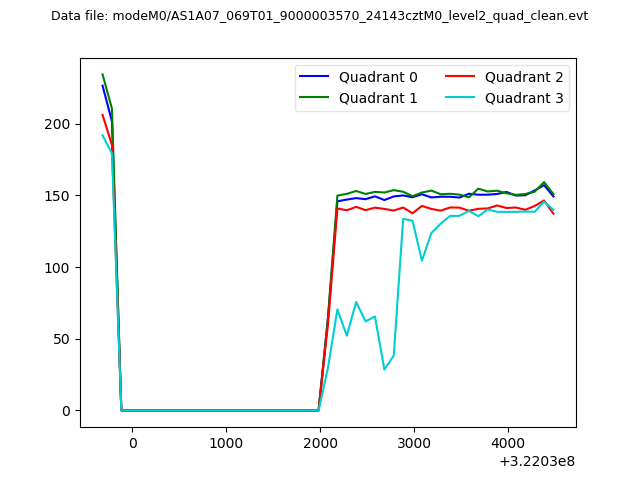 |
|
| Module-wise count rates for Quadrant A Data is divided into 100 sec bins |
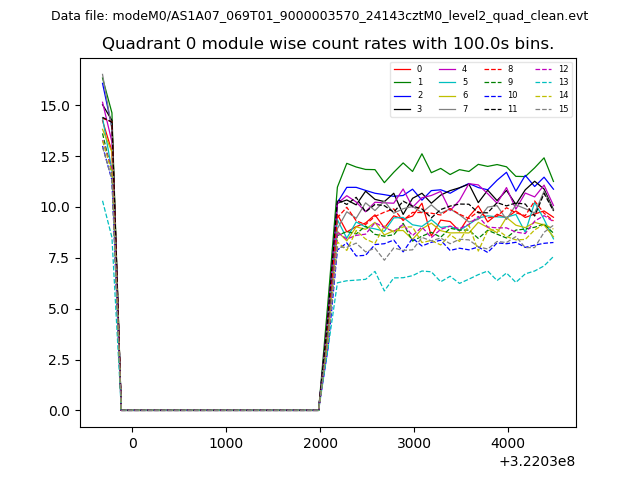 |
 |
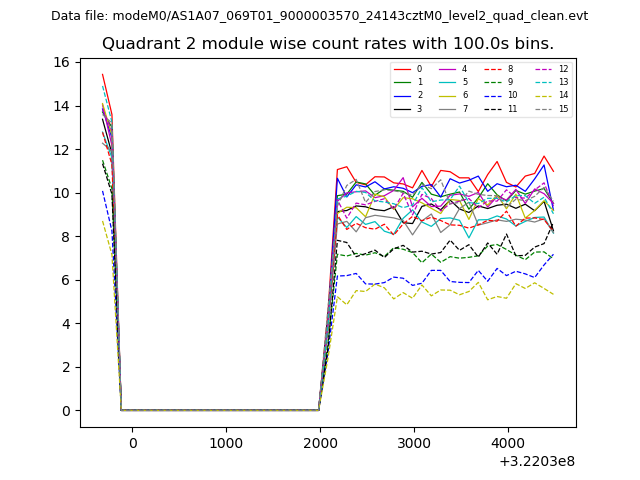
| Module-wise count rates for Quadrant B Data is divided into 100 sec bins |
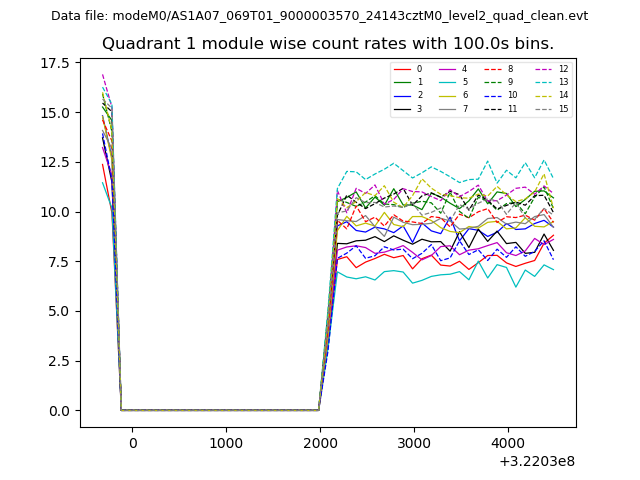 |
 |
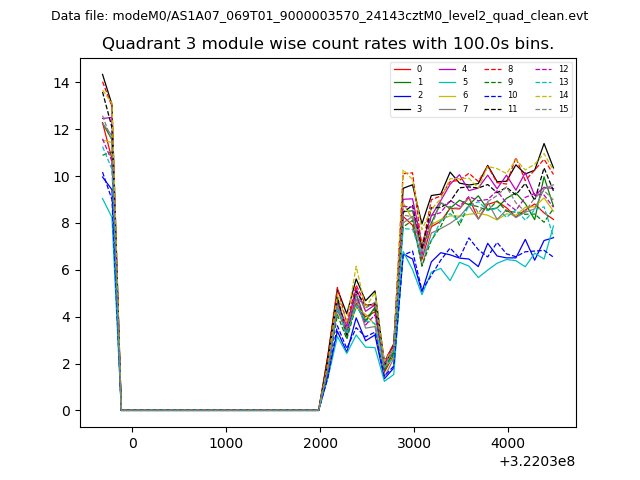
| Module-wise count rates for Quadrant C Data is divided into 100 sec bins |
 |
 |
| Module-wise count rates for Quadrant D Data is divided into 100 sec bins |
 |
 |
| Parameter | Plot |
|---|---|
| CZT HV Monitor |  |
| D_VDD | 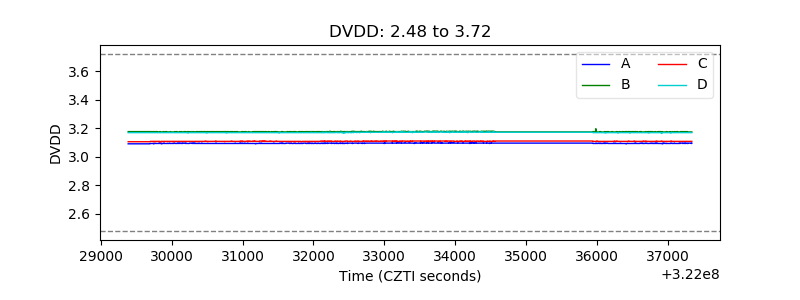 |
| Temperature 1 | 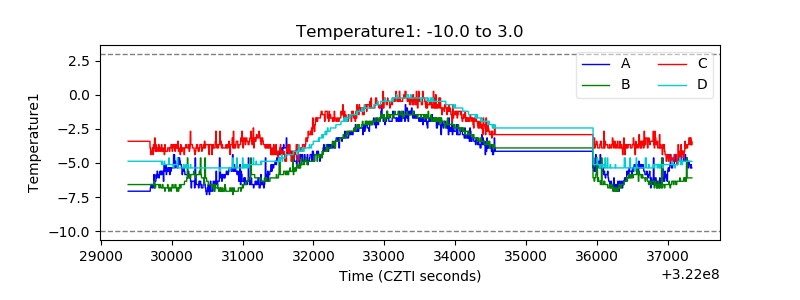 |
| Veto HV Monitor |  |
| Veto LLD | 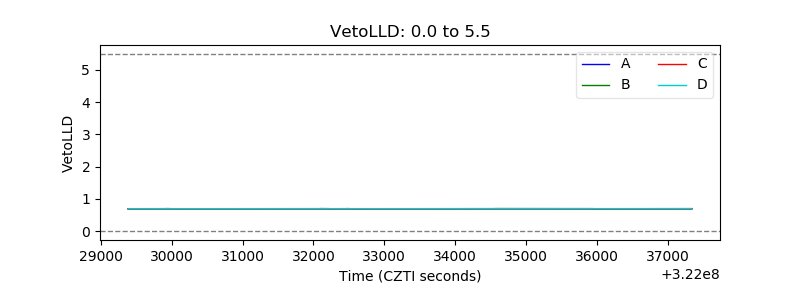 |
| Alpha Counter | 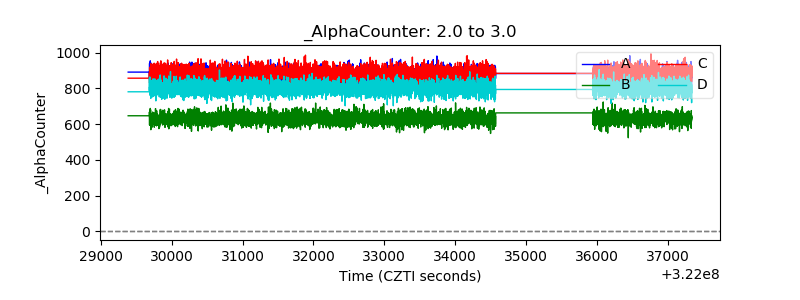 |
| _CPM_Rate | 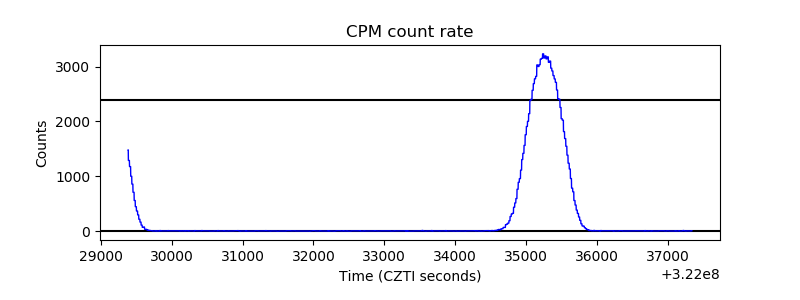 |
| CZT Counter | 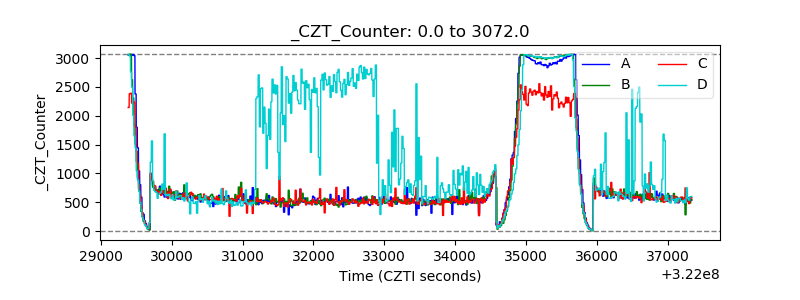 |
| +2.5 Volts monitor |  |
| +5 Volts monitor |  |
| _ROLL_ROT | 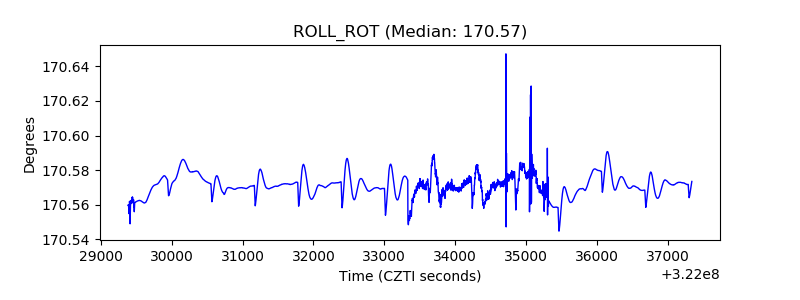 |
| _Roll_DEC | 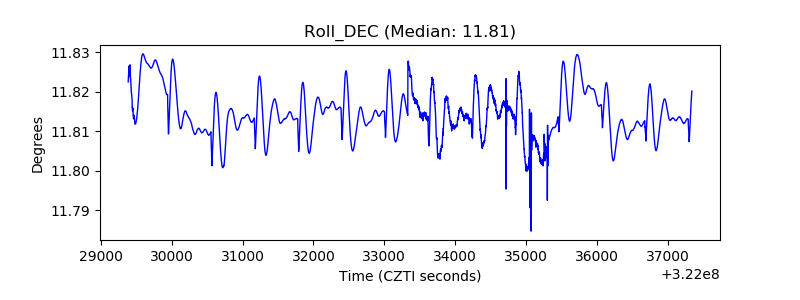 |
| _Roll_RA | 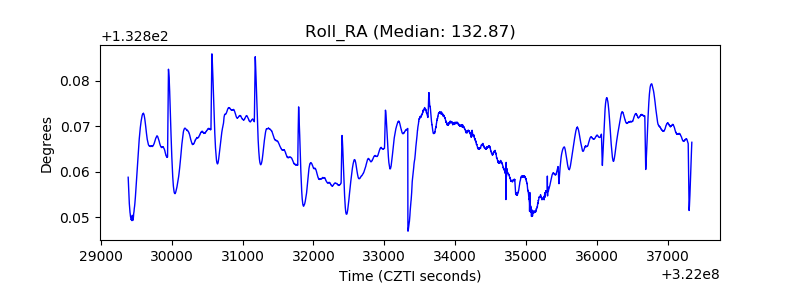 |
| Veto Counter | 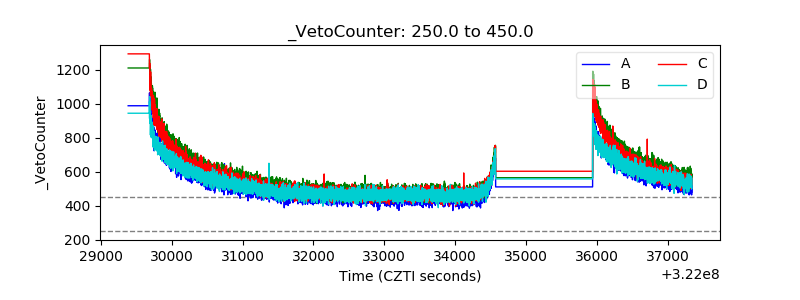 |