| Param | Original file | Final file |
|---|---|---|
| Filename | modeM0/AS1A07_069T01_9000003570_24144cztM0_level2.evt | modeM0/AS1A07_069T01_9000003570_24144cztM0_level2_quad_clean.evt |
| Size (bytes) | 532,739,520 | 70,107,840 |
| Size | 508.1 MB | 66.9 MB |
| Events in quadrant A | 3,570,695 | 435,626 |
| Events in quadrant B | 3,630,024 | 443,513 |
| Events in quadrant C | 3,702,356 | 406,368 |
| Events in quadrant D | 4,802,783 | 396,274 |
| Mode SS | |||
|---|---|---|---|
| Quadrant | BADHDUFLAG | Total packets | Discarded packets |
| A | 0 | 128 | 0 |
| B | 0 | 128 | 0 |
| C | 0 | 128 | 0 |
| D | 0 | 128 | 0 |
| Mode M0 | |||
|---|---|---|---|
| Quadrant | BADHDUFLAG | Total packets | Discarded packets |
| A | 0 | 14297 | 2 |
| B | 0 | 14607 | 2 |
| C | 0 | 14817 | 2 |
| D | 0 | 18354 | 2 |
| Mode M9 | |||
|---|---|---|---|
| Quadrant | BADHDUFLAG | Total packets | Discarded packets |
| A | 0 | 18 | 0 |
| B | 0 | 19 | 0 |
| C | 0 | 19 | 0 |
| D | 0 | 19 | 0 |
| Quadrant | Total seconds | Saturated seconds | Saturation percentage |
|---|---|---|---|
| A | 6319 | 86 | 1.360975% |
| B | 6319 | 125 | 1.978161% |
| C | 6318 | 177 | 2.801519% |
| D | 6318 | 322 | 5.096550% |
Noise dominated data is calculated using 1-second bins in cleaned event files. If a bin has >2000 counts, and if more than 50% of those come from <1% of pixels, then it is considered to be noise-dominated and hence unusable.
| Quadrant | # 1 sec bins | Bins with >0 counts | Bins with >2000 counts | High rate bins dominated by noise | Noise dominated (total time) | Noise dominated (detector-on time) | Marked lightcurve |
|---|---|---|---|---|---|---|---|
| A | 7639 | 6319 | 0 | 0 | 0.00% | 0.00% | 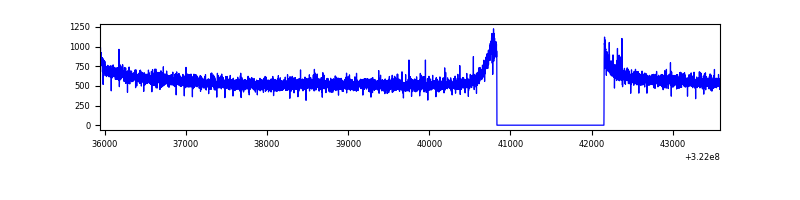 |
| B | 7639 | 6319 | 1 | 1 | 0.01% | 0.02% | 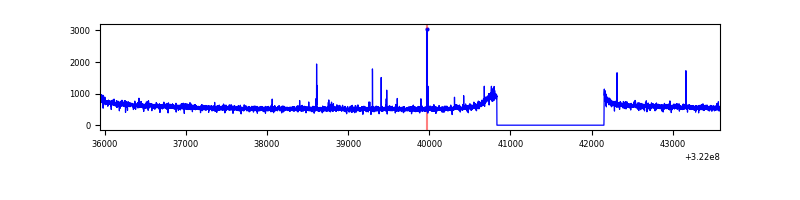 |
| C | 7638 | 6318 | 14 | 14 | 0.18% | 0.22% |  |
| D | 7638 | 6318 | 229 | 229 | 3.00% | 3.62% | 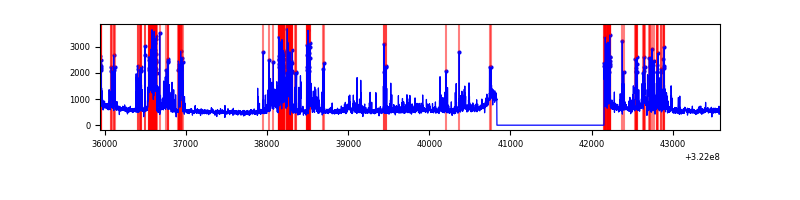 |
Top three noisy pixels from each quadrant. If the there are fewer than three noisy pixels in the level2.evt file, extra rows are filled as -1
| Pixel properties | Quadrant properties | ||||||
|---|---|---|---|---|---|---|---|
| Quadrant | DetID | PixID | Counts | Sigma | Mean | Median | Sigma |
| A | 13 | 254 | 9892 | 49.03 | 925 | 912 | 183.2 |
| A | 0 | 226 | 8286 | 40.26 | 925 | 912 | 183.2 |
| A | 3 | 137 | 7366 | 35.24 | 925 | 912 | 183.2 |
| B | 12 | 111 | 19857 | 110.11 | 923 | 905 | 172.1 |
| B | 11 | 111 | 17386 | 95.76 | 923 | 905 | 172.1 |
| B | 14 | 111 | 15706 | 86.0 | 923 | 905 | 172.1 |
| C | 14 | 238 | 141325 | 711.33 | 859 | 867 | 197.5 |
| C | 2 | 16 | 103411 | 519.32 | 859 | 867 | 197.5 |
| C | 7 | 247 | 58882 | 293.81 | 859 | 867 | 197.5 |
| D | 7 | 238 | 1337469 | 6396.55 | 864 | 842 | 209.0 |
| D | 8 | 195 | 122866 | 583.96 | 864 | 842 | 209.0 |
| D | 1 | 52 | 76794 | 363.48 | 864 | 842 | 209.0 |
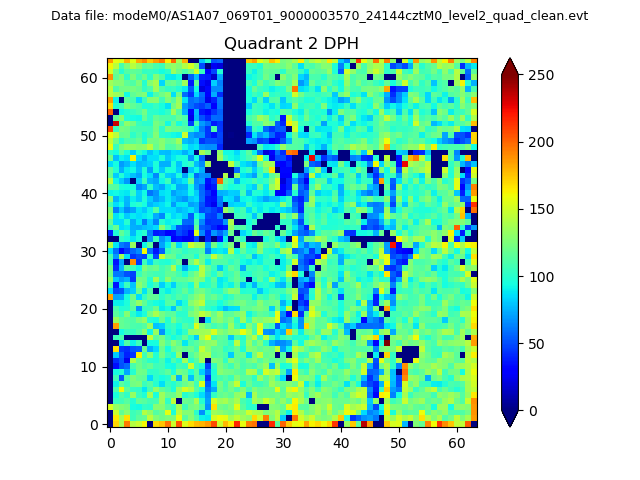
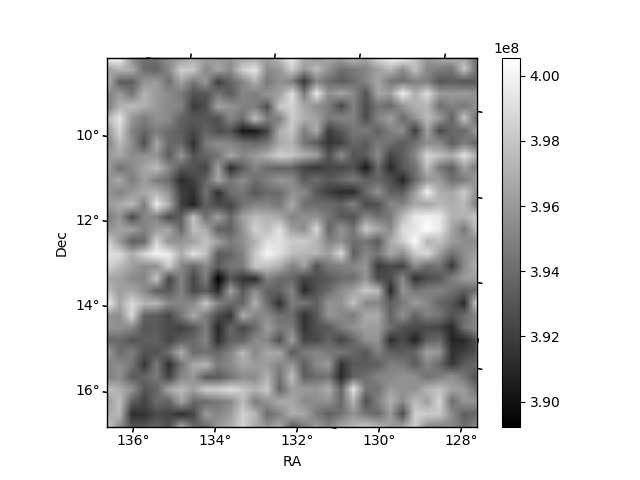
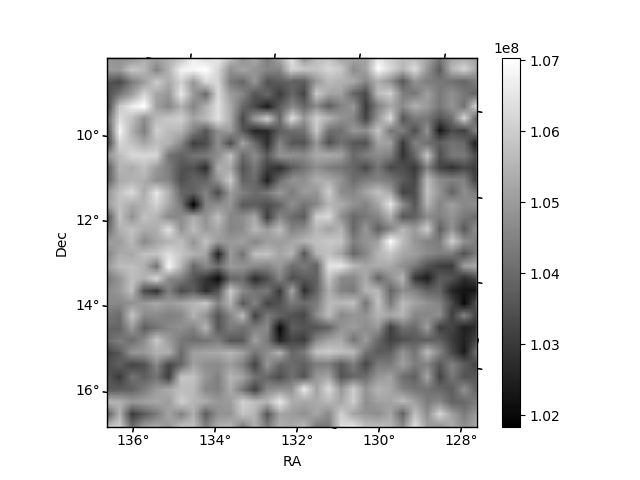
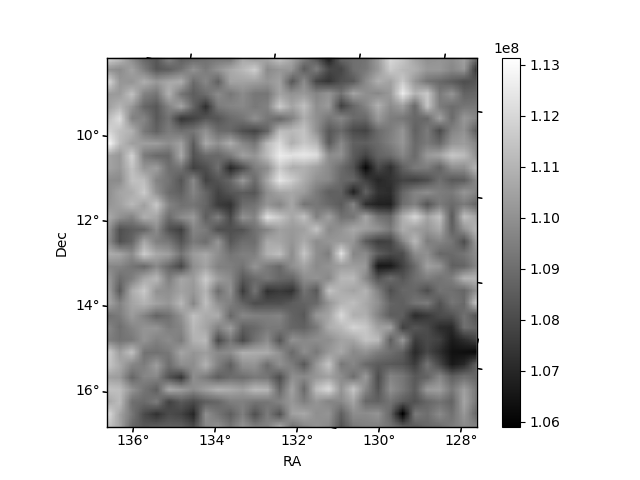
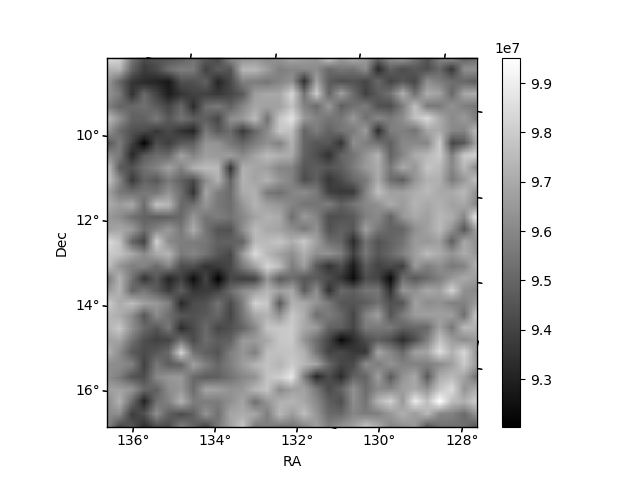
Histogram calculated using DETX and DETY for each event in the final _common_clean file
| Quadrant A | 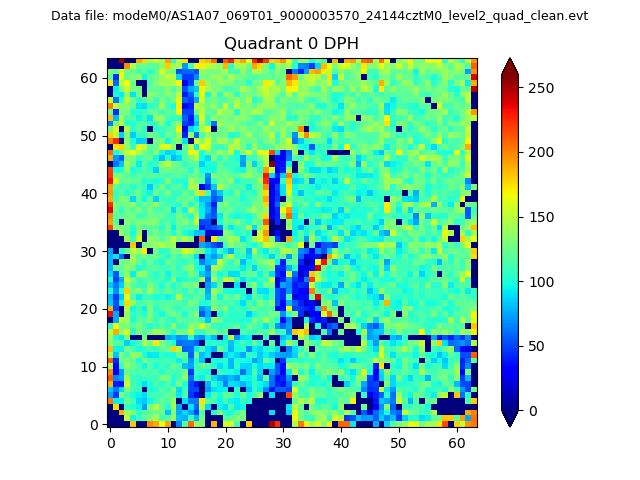 |
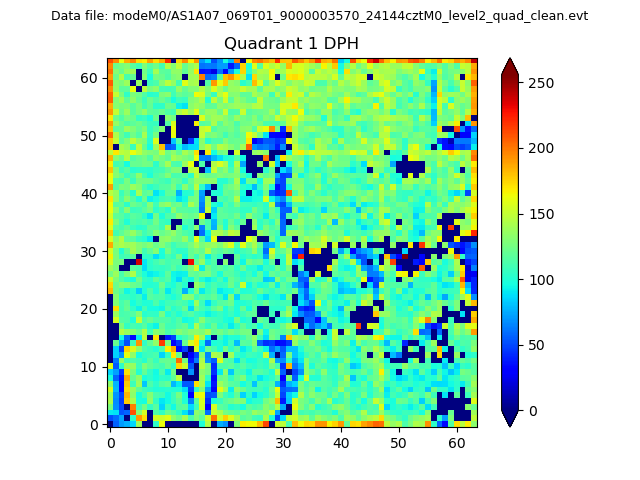 |
Quadrant B |
|---|---|---|---|
| Quadrant D | 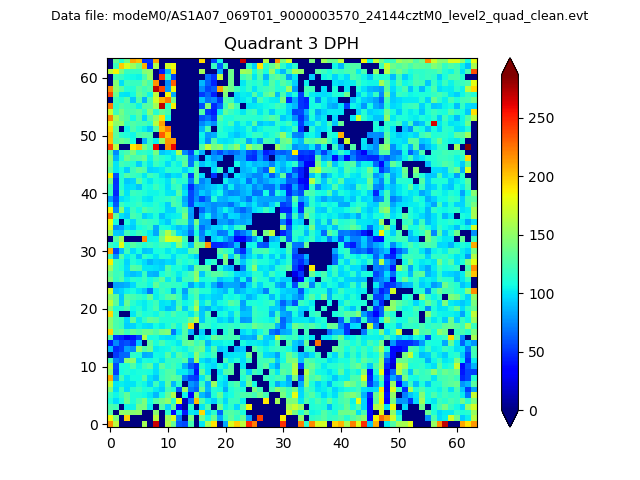 |
 |
Quadrant C |
| Plot type | Count rate plots | Images |
|---|---|---|
| Comparison with Poisson distribution Blue bars denote a histogram of data divided into 1 sec bins. Red curve is a Poisson curve with rate = median count rate of data. |
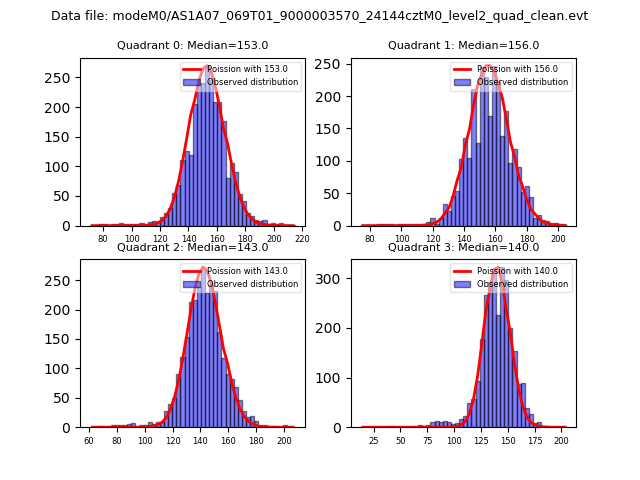 |
 |
| Quadrant-wise count rates Data is divided into 100 sec bins |
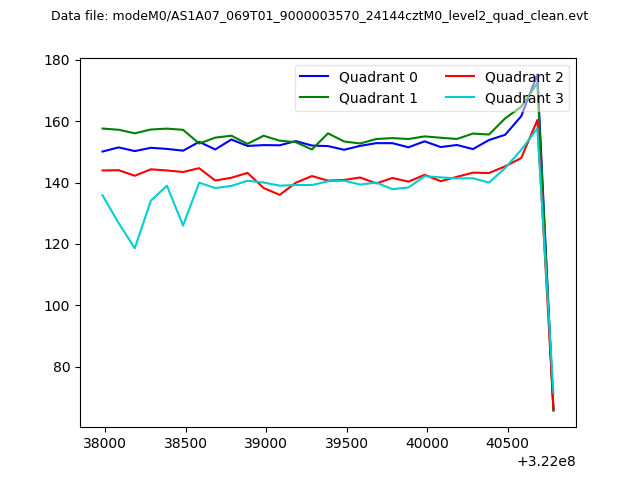 |
|
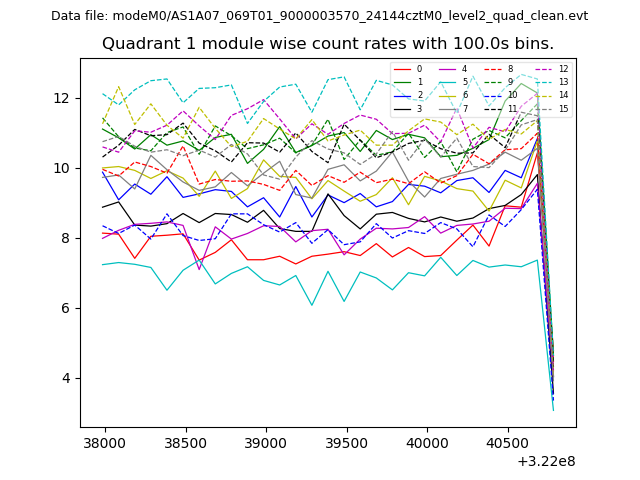
| Module-wise count rates for Quadrant A Data is divided into 100 sec bins |
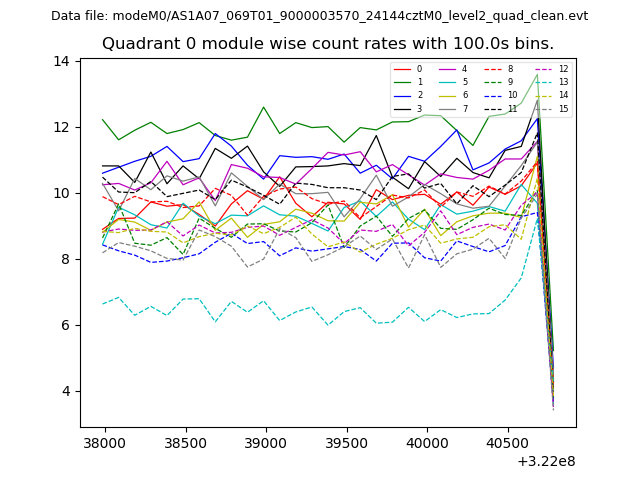 |
 |
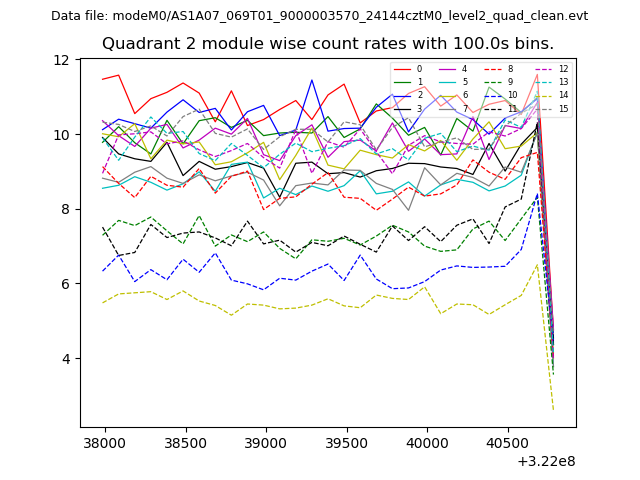
| Module-wise count rates for Quadrant B Data is divided into 100 sec bins |
 |
 |
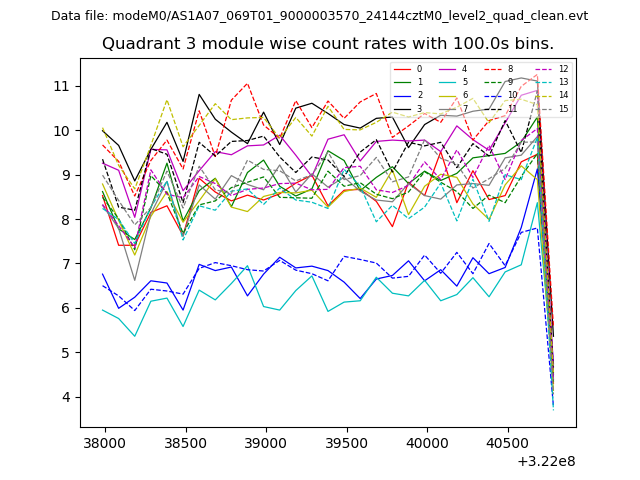
| Module-wise count rates for Quadrant C Data is divided into 100 sec bins |
 |
 |
| Module-wise count rates for Quadrant D Data is divided into 100 sec bins |
 |
 |
| Parameter | Plot |
|---|---|
| CZT HV Monitor | 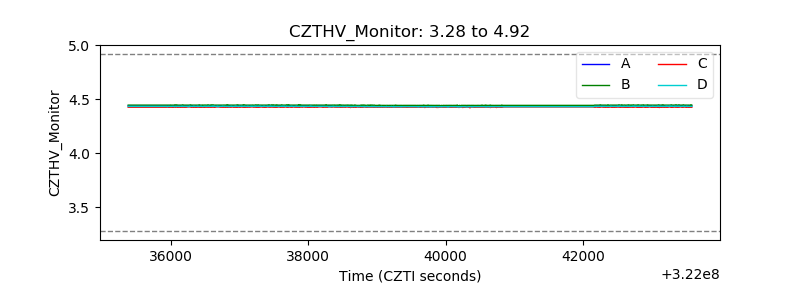 |
| D_VDD | 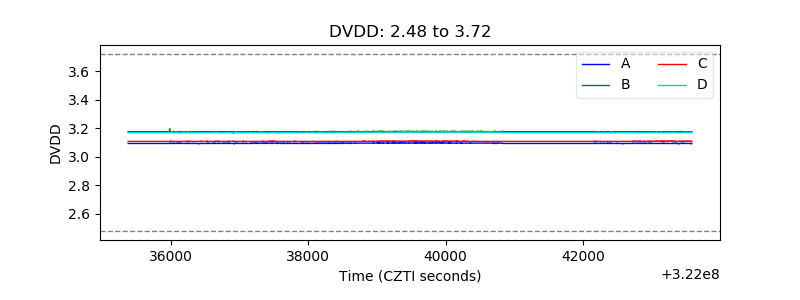 |
| Temperature 1 | 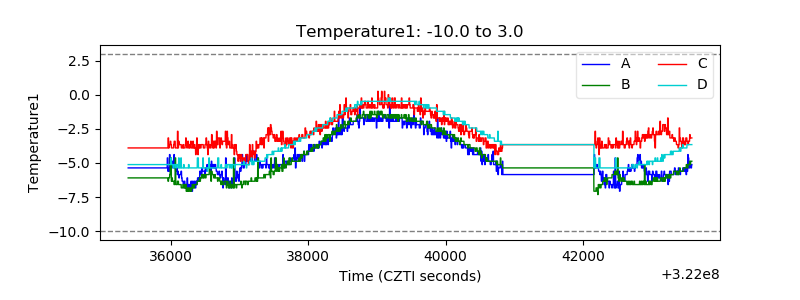 |
| Veto HV Monitor | 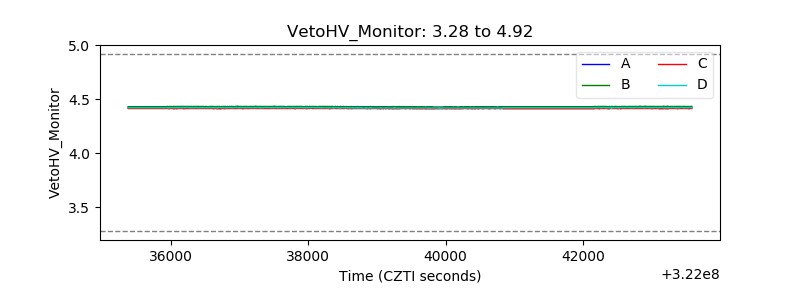 |
| Veto LLD | 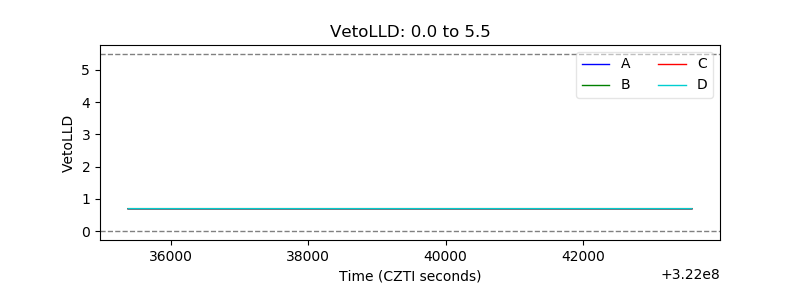 |
| Alpha Counter | 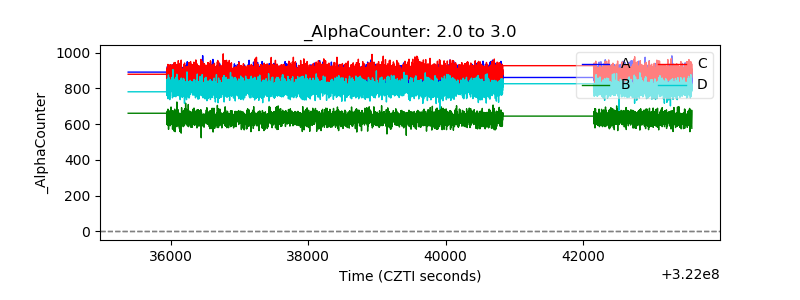 |
| _CPM_Rate | 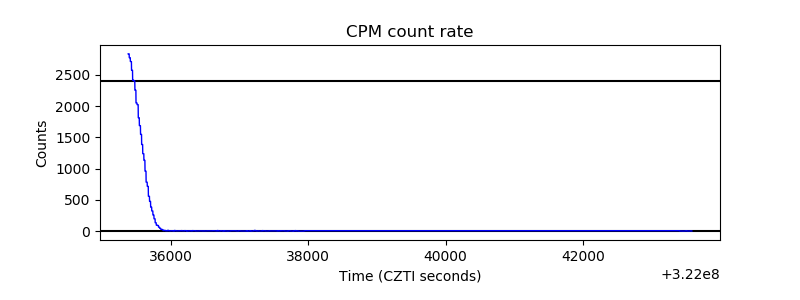 |
| CZT Counter | 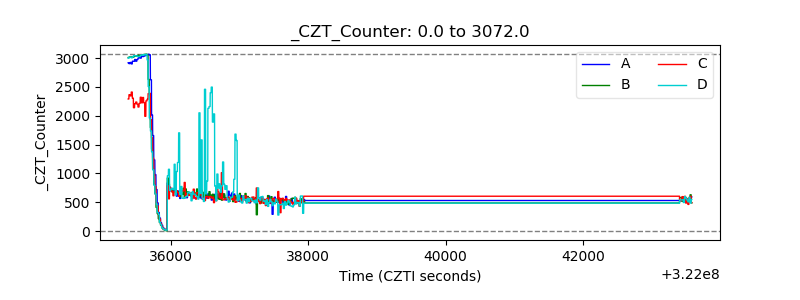 |
| +2.5 Volts monitor |  |
| +5 Volts monitor |  |
| _ROLL_ROT | 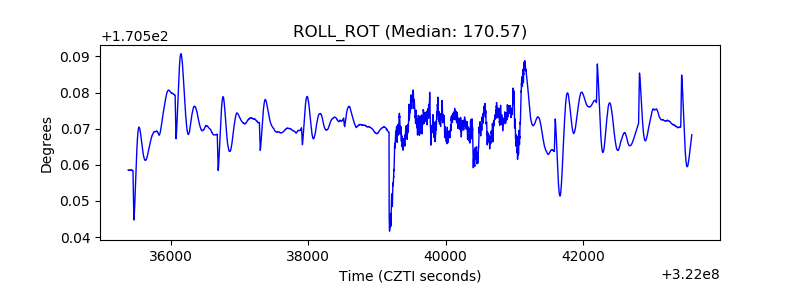 |
| _Roll_DEC | 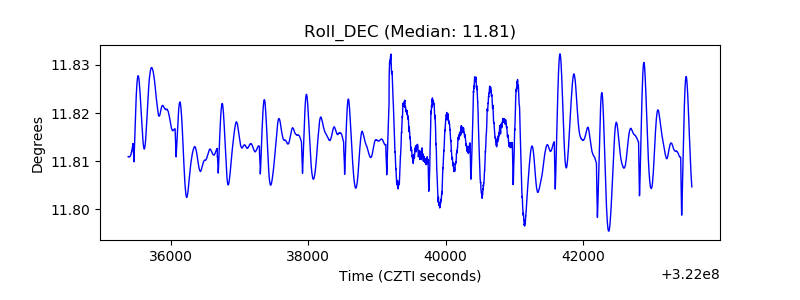 |
| _Roll_RA | 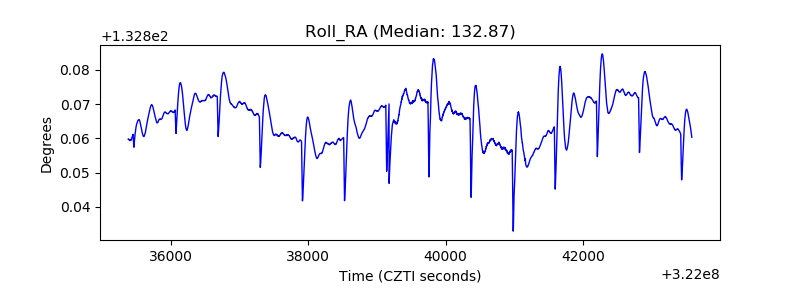 |
| Veto Counter | 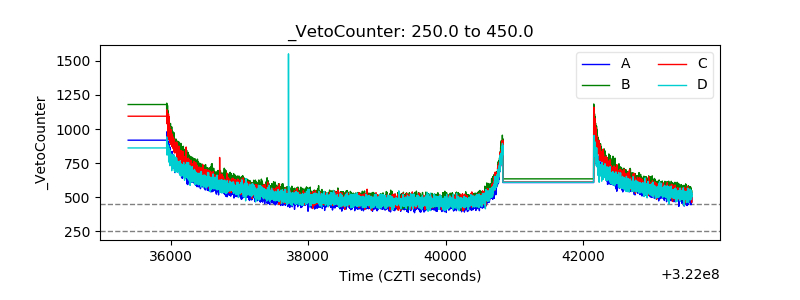 |