| Param | Original file | Final file |
|---|---|---|
| Filename | modeM0/AS1A07_069T01_9000003570_24145cztM0_level2.evt | modeM0/AS1A07_069T01_9000003570_24145cztM0_level2_quad_clean.evt |
| Size (bytes) | 229,080,960 | 27,000,000 |
| Size | 218.5 MB | 25.7 MB |
| Events in quadrant A | 1,523,762 | 159,863 |
| Events in quadrant B | 1,547,072 | 165,412 |
| Events in quadrant C | 1,617,474 | 150,222 |
| Events in quadrant D | 2,060,990 | 144,667 |
| Mode SS | |||
|---|---|---|---|
| Quadrant | BADHDUFLAG | Total packets | Discarded packets |
| A | 0 | 56 | 0 |
| B | 0 | 56 | 0 |
| C | 0 | 56 | 0 |
| D | 0 | 56 | 0 |
| Mode M0 | |||
|---|---|---|---|
| Quadrant | BADHDUFLAG | Total packets | Discarded packets |
| A | 0 | 6064 | 1 |
| B | 0 | 6214 | 1 |
| C | 0 | 6428 | 1 |
| D | 0 | 7938 | 1 |
| Mode M9 | |||
|---|---|---|---|
| Quadrant | BADHDUFLAG | Total packets | Discarded packets |
| A | 0 | 5 | 0 |
| B | 0 | 6 | 0 |
| C | 0 | 6 | 0 |
| D | 0 | 6 | 0 |
| Quadrant | Total seconds | Saturated seconds | Saturation percentage |
|---|---|---|---|
| A | 2747 | 19 | 0.691664% |
| B | 2747 | 23 | 0.837277% |
| C | 2747 | 44 | 1.601747% |
| D | 2747 | 82 | 2.985075% |
Noise dominated data is calculated using 1-second bins in cleaned event files. If a bin has >2000 counts, and if more than 50% of those come from <1% of pixels, then it is considered to be noise-dominated and hence unusable.
| Quadrant | # 1 sec bins | Bins with >0 counts | Bins with >2000 counts | High rate bins dominated by noise | Noise dominated (total time) | Noise dominated (detector-on time) | Marked lightcurve |
|---|---|---|---|---|---|---|---|
| A | 2747 | 2747 | 0 | 0 | 0.00% | 0.00% | 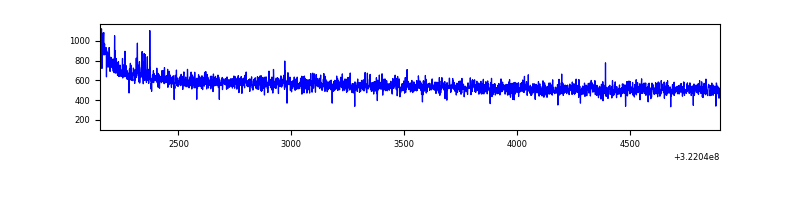 |
| B | 2747 | 2747 | 0 | 0 | 0.00% | 0.00% | 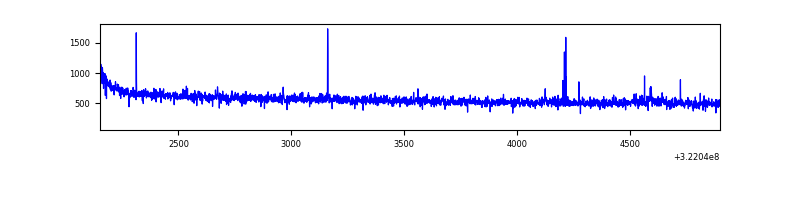 |
| C | 2747 | 2747 | 13 | 13 | 0.47% | 0.47% | 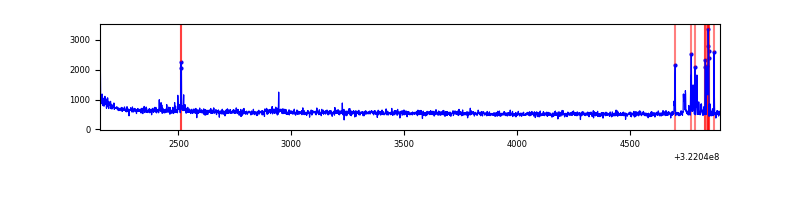 |
| D | 2747 | 2747 | 70 | 70 | 2.55% | 2.55% | 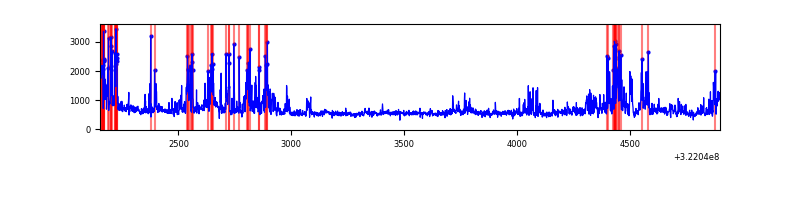 |
Top three noisy pixels from each quadrant. If the there are fewer than three noisy pixels in the level2.evt file, extra rows are filled as -1
| Pixel properties | Quadrant properties | ||||||
|---|---|---|---|---|---|---|---|
| Quadrant | DetID | PixID | Counts | Sigma | Mean | Median | Sigma |
| A | 0 | 23 | 5199 | 60.7 | 394 | 389 | 79.2 |
| A | 13 | 254 | 4447 | 51.21 | 394 | 389 | 79.2 |
| A | 0 | 226 | 3643 | 41.06 | 394 | 389 | 79.2 |
| B | 12 | 111 | 8539 | 109.85 | 392 | 384 | 74.2 |
| B | 11 | 111 | 7483 | 95.63 | 392 | 384 | 74.2 |
| B | 14 | 111 | 7001 | 89.14 | 392 | 384 | 74.2 |
| C | 14 | 238 | 60487 | 705.74 | 366 | 369 | 85.2 |
| C | 2 | 16 | 53489 | 623.59 | 366 | 369 | 85.2 |
| C | 7 | 247 | 47319 | 551.16 | 366 | 369 | 85.2 |
| D | 7 | 238 | 640750 | 7160.3 | 367 | 358 | 89.4 |
| D | 8 | 195 | 27183 | 299.93 | 367 | 358 | 89.4 |
| D | 1 | 52 | 10478 | 113.15 | 367 | 358 | 89.4 |
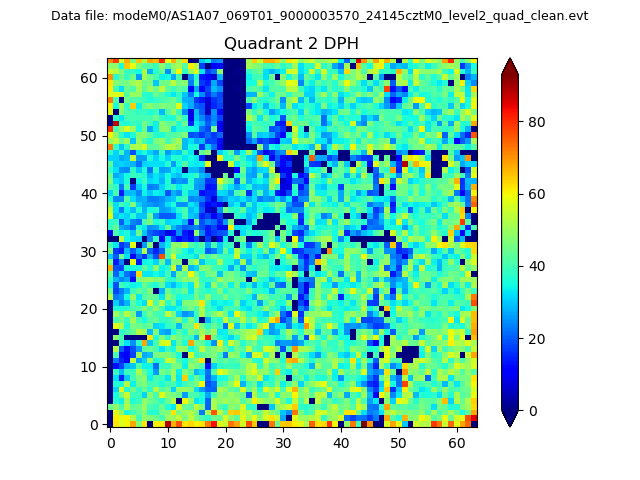
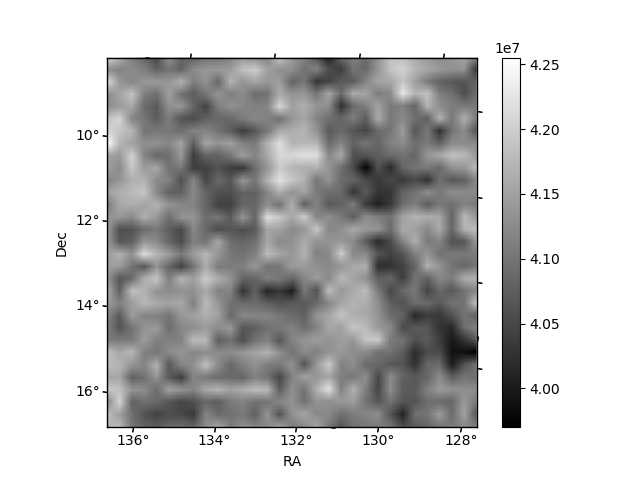
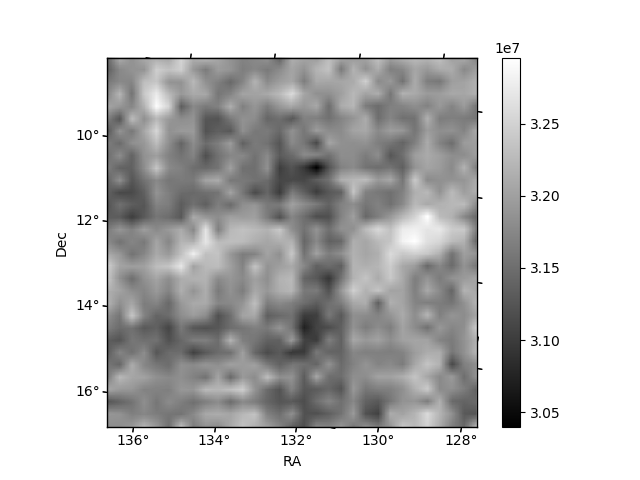
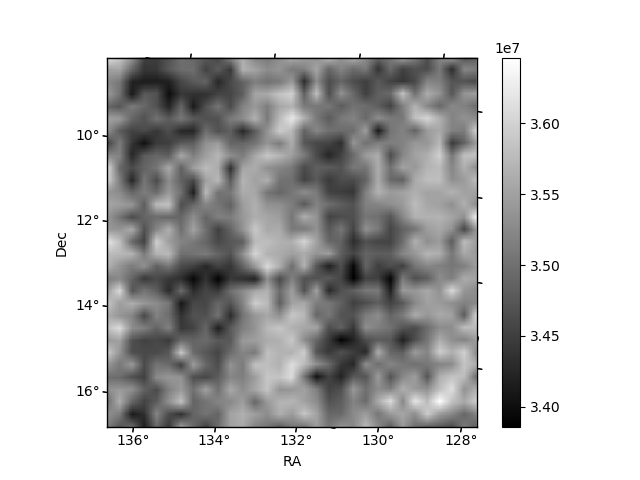
Histogram calculated using DETX and DETY for each event in the final _common_clean file
| Quadrant A | 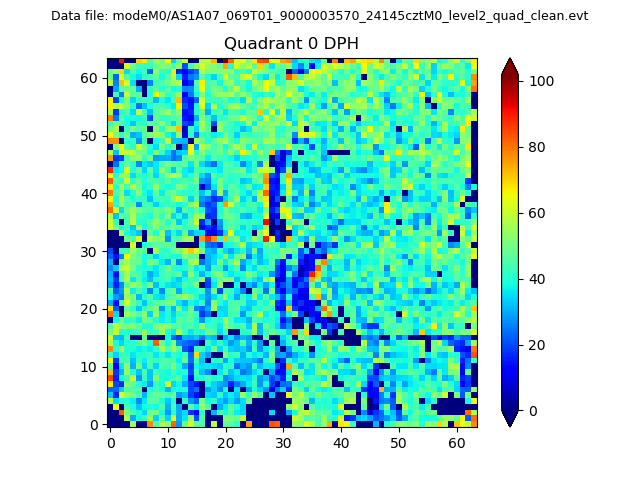 |
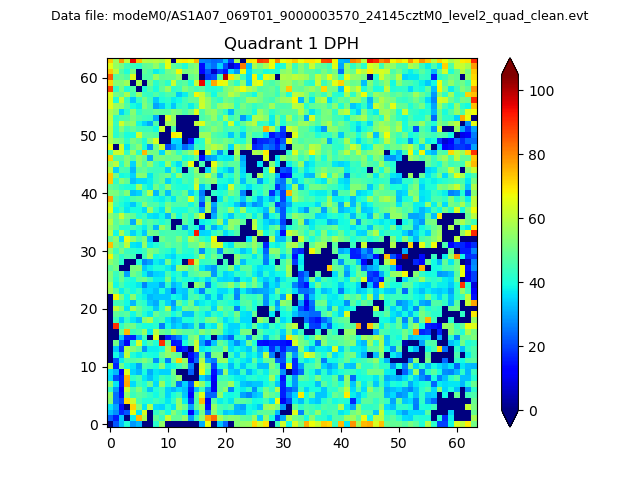 |
Quadrant B |
|---|---|---|---|
| Quadrant D | 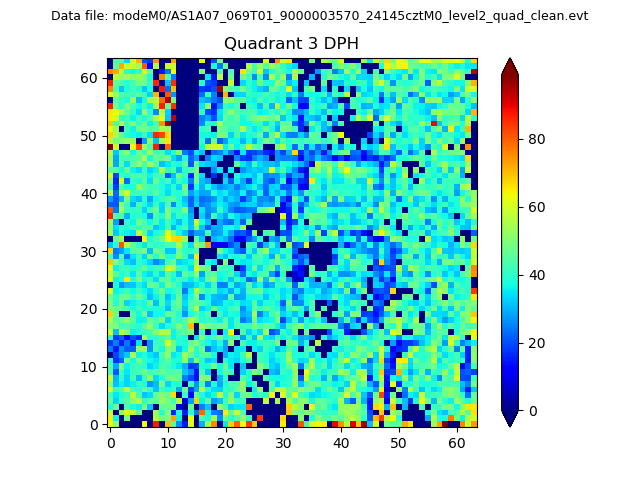 |
 |
Quadrant C |
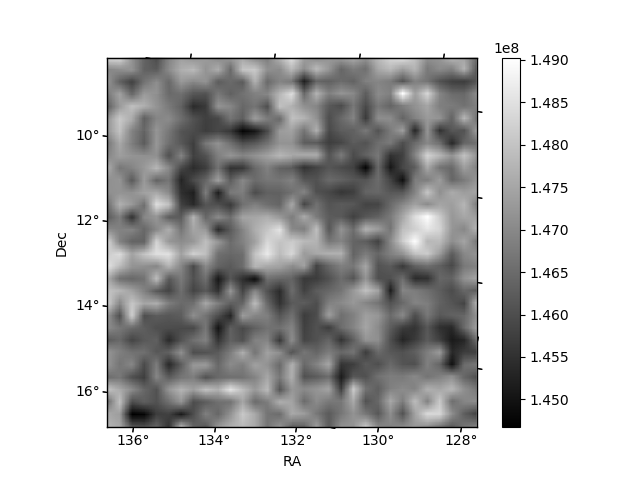
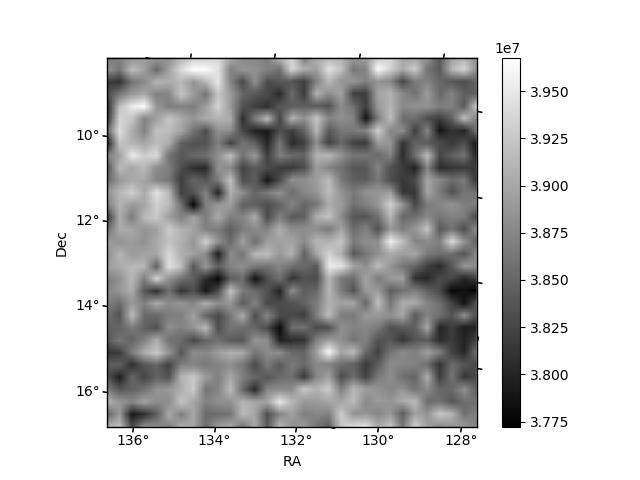
| Plot type | Count rate plots | Images |
|---|---|---|
| Comparison with Poisson distribution Blue bars denote a histogram of data divided into 1 sec bins. Red curve is a Poisson curve with rate = median count rate of data. |
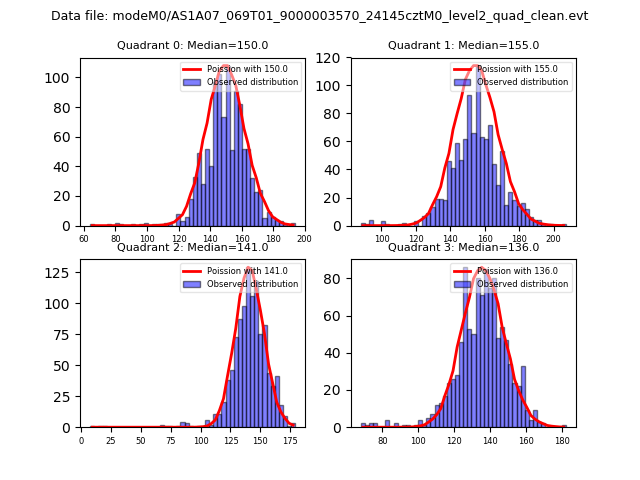 |
 |
| Quadrant-wise count rates Data is divided into 100 sec bins |
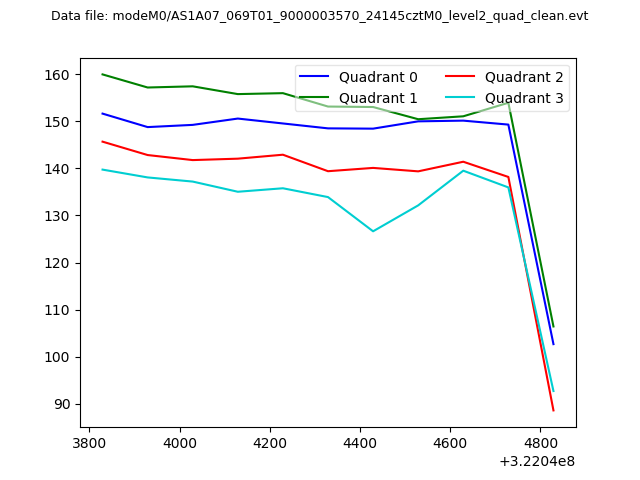 |
|
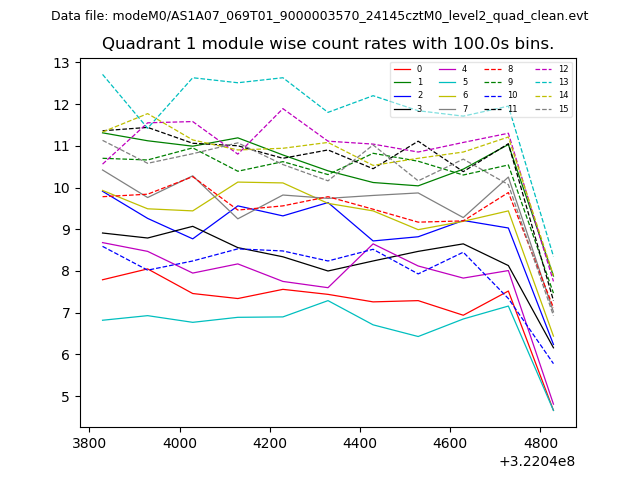
| Module-wise count rates for Quadrant A Data is divided into 100 sec bins |
 |
 |
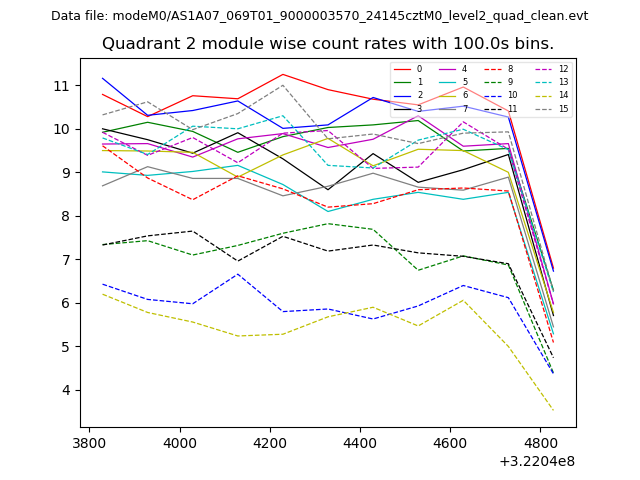
| Module-wise count rates for Quadrant B Data is divided into 100 sec bins |
 |
 |
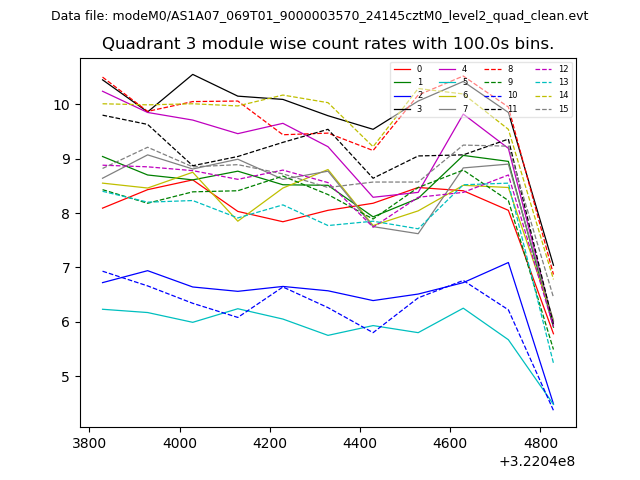
| Module-wise count rates for Quadrant C Data is divided into 100 sec bins |
 |
 |
| Module-wise count rates for Quadrant D Data is divided into 100 sec bins |
 |
 |
| Parameter | Plot |
|---|---|
| CZT HV Monitor |  |
| D_VDD |  |
| Temperature 1 | 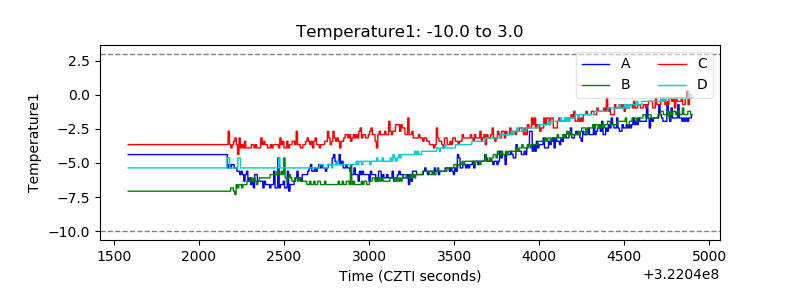 |
| Veto HV Monitor | 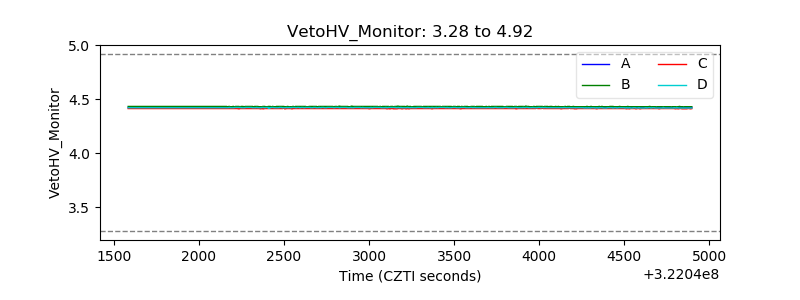 |
| Veto LLD |  |
| Alpha Counter | 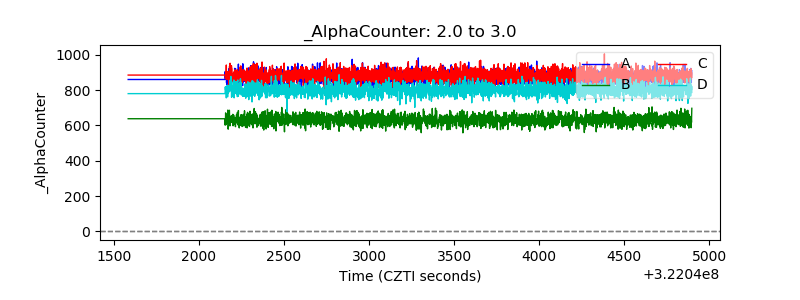 |
| _CPM_Rate | 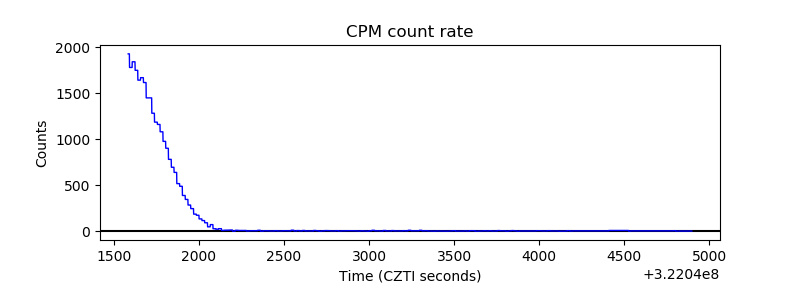 |
| CZT Counter | 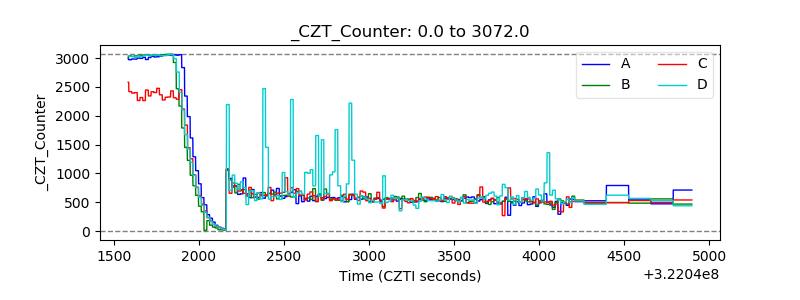 |
| +2.5 Volts monitor | 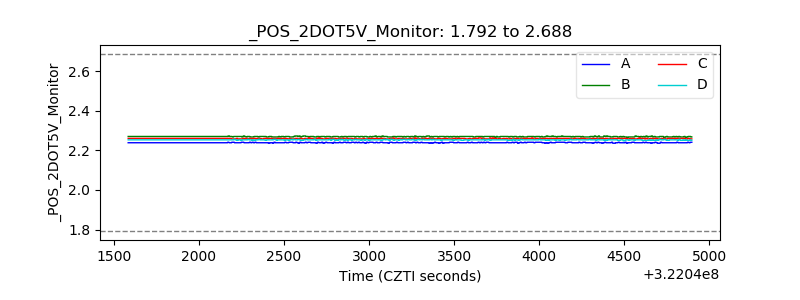 |
| +5 Volts monitor |  |
| _ROLL_ROT | 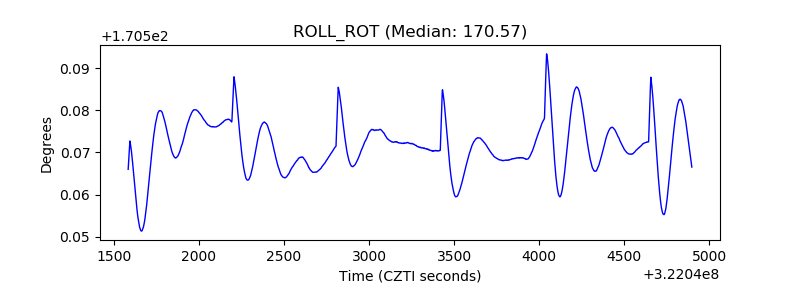 |
| _Roll_DEC | 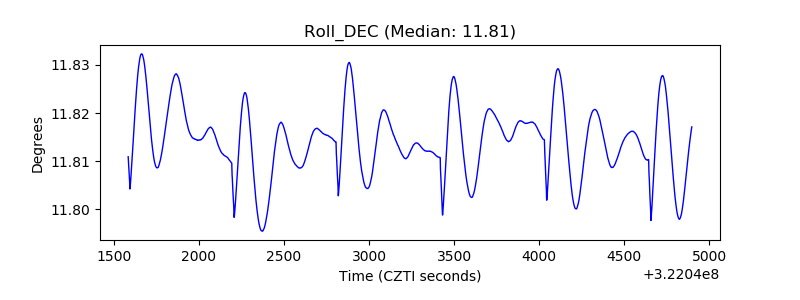 |
| _Roll_RA | 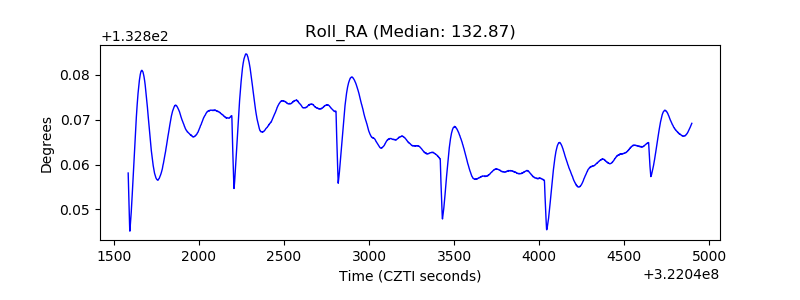 |
| Veto Counter | 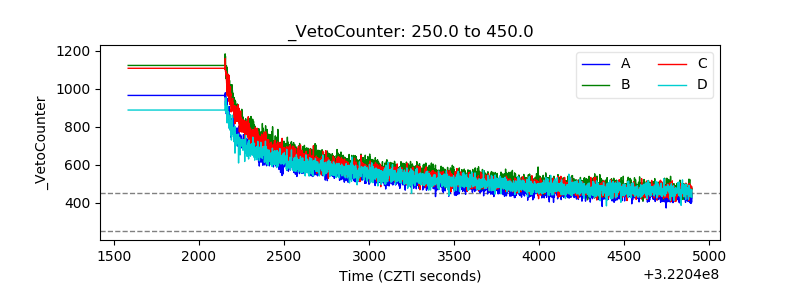 |