| Param | Original file | Final file |
|---|---|---|
| Filename | modeM0/AS1A07_134T02_9000003568_24119cztM0_level2.evt | modeM0/AS1A07_134T02_9000003568_24119cztM0_level2_quad_clean.evt |
| Size (bytes) | 135,843,840 | 29,992,320 |
| Size | 129.6 MB | 28.6 MB |
| Events in quadrant A | 815,310 | 203,068 |
| Events in quadrant B | 859,175 | 205,524 |
| Events in quadrant C | 774,631 | 197,077 |
| Events in quadrant D | 1,555,334 | 185,792 |
| Mode SS | |||
|---|---|---|---|
| Quadrant | BADHDUFLAG | Total packets | Discarded packets |
| A | 0 | 32 | 0 |
| B | 0 | 32 | 0 |
| C | 0 | 32 | 0 |
| D | 0 | 32 | 0 |
| Mode M0 | |||
|---|---|---|---|
| Quadrant | BADHDUFLAG | Total packets | Discarded packets |
| A | 0 | 3368 | 0 |
| B | 0 | 3482 | 0 |
| C | 0 | 3239 | 0 |
| D | 0 | 5781 | 0 |
| Quadrant | Total seconds | Saturated seconds | Saturation percentage |
|---|---|---|---|
| A | 1575 | 5 | 0.317460% |
| B | 1575 | 9 | 0.571429% |
| C | 1575 | 9 | 0.571429% |
| D | 1575 | 128 | 8.126984% |
Noise dominated data is calculated using 1-second bins in cleaned event files. If a bin has >2000 counts, and if more than 50% of those come from <1% of pixels, then it is considered to be noise-dominated and hence unusable.
| Quadrant | # 1 sec bins | Bins with >0 counts | Bins with >2000 counts | High rate bins dominated by noise | Noise dominated (total time) | Noise dominated (detector-on time) | Marked lightcurve |
|---|---|---|---|---|---|---|---|
| A | 1575 | 1575 | 0 | 0 | 0.00% | 0.00% |  |
| B | 1575 | 1575 | 6 | 6 | 0.38% | 0.38% |  |
| C | 1575 | 1575 | 0 | 0 | 0.00% | 0.00% |  |
| D | 1575 | 1575 | 99 | 99 | 6.29% | 6.29% |  |
Top three noisy pixels from each quadrant. If the there are fewer than three noisy pixels in the level2.evt file, extra rows are filled as -1
| Pixel properties | Quadrant properties | ||||||
|---|---|---|---|---|---|---|---|
| Quadrant | DetID | PixID | Counts | Sigma | Mean | Median | Sigma |
| A | 3 | 1 | 43619 | 1013.39 | 199 | 194 | 42.9 |
| A | 13 | 254 | 2816 | 61.19 | 199 | 194 | 42.9 |
| A | 0 | 226 | 1721 | 35.64 | 199 | 194 | 42.9 |
| B | 5 | 250 | 21233 | 527.74 | 195 | 190 | 39.9 |
| B | 0 | 189 | 19169 | 475.98 | 195 | 190 | 39.9 |
| B | 12 | 32 | 15267 | 378.12 | 195 | 190 | 39.9 |
| C | 14 | 238 | 28977 | 622.62 | 188 | 189 | 46.2 |
| C | 7 | 247 | 7695 | 162.34 | 188 | 189 | 46.2 |
| C | 3 | 233 | 3091 | 62.76 | 188 | 189 | 46.2 |
| D | 8 | 195 | 473219 | 9745.03 | 190 | 183 | 48.5 |
| D | 12 | 218 | 219156 | 4511.07 | 190 | 183 | 48.5 |
| D | 1 | 52 | 77017 | 1582.86 | 190 | 183 | 48.5 |
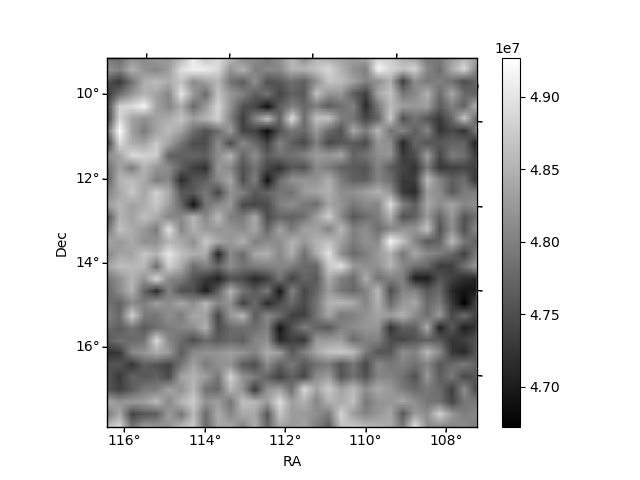
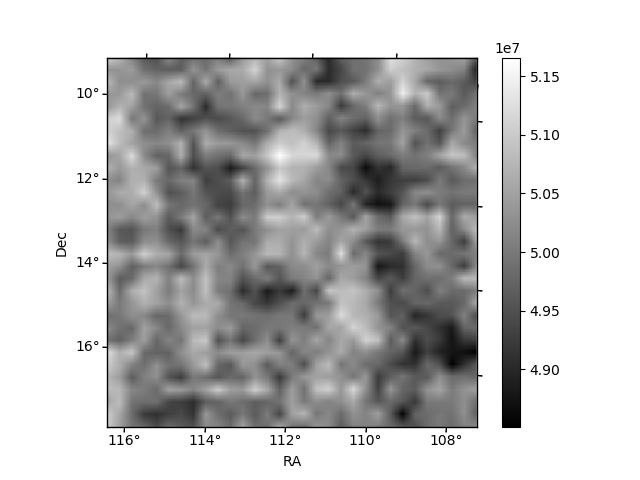
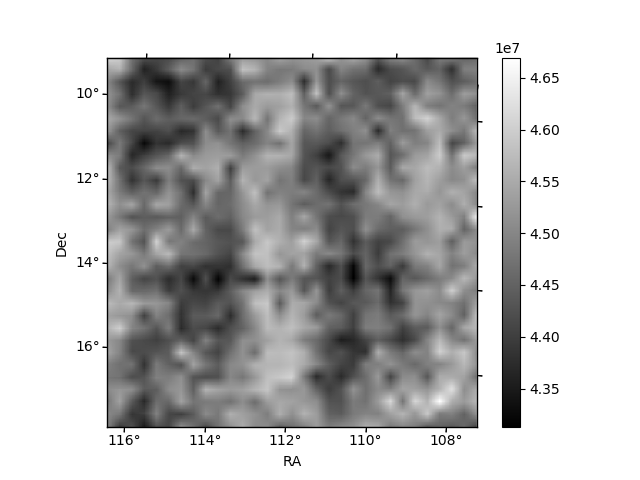
Histogram calculated using DETX and DETY for each event in the final _common_clean file
| Quadrant A | 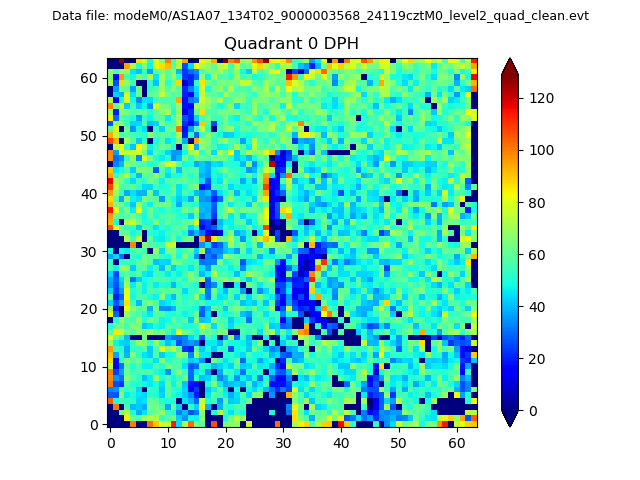 |
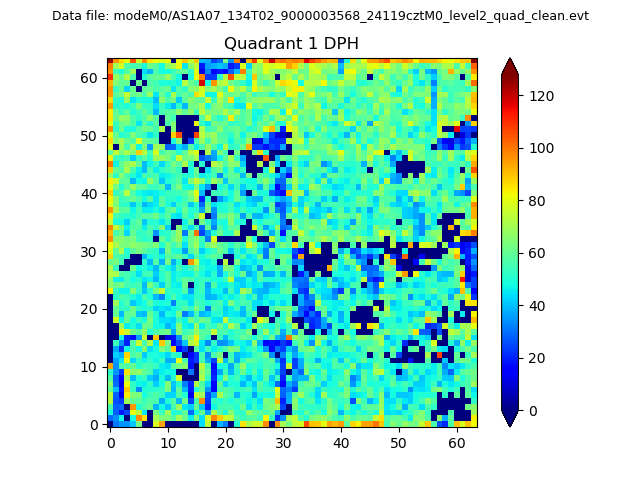 |
Quadrant B |
|---|---|---|---|
| Quadrant D | 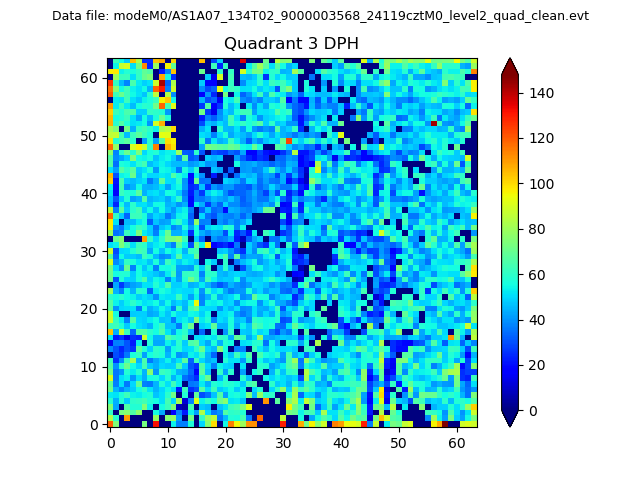 |
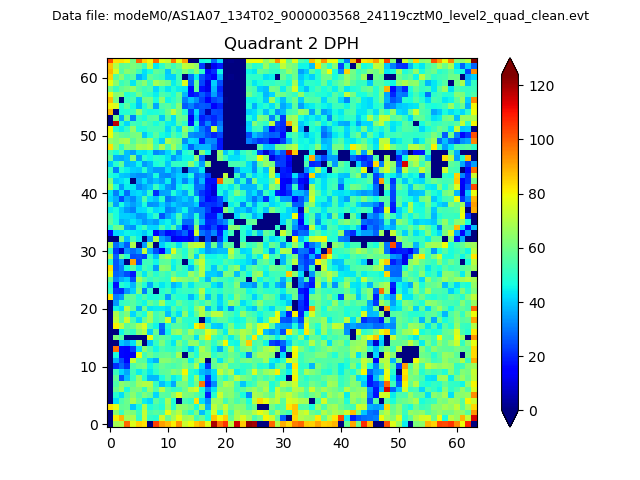 |
Quadrant C |
| Plot type | Count rate plots | Images |
|---|---|---|
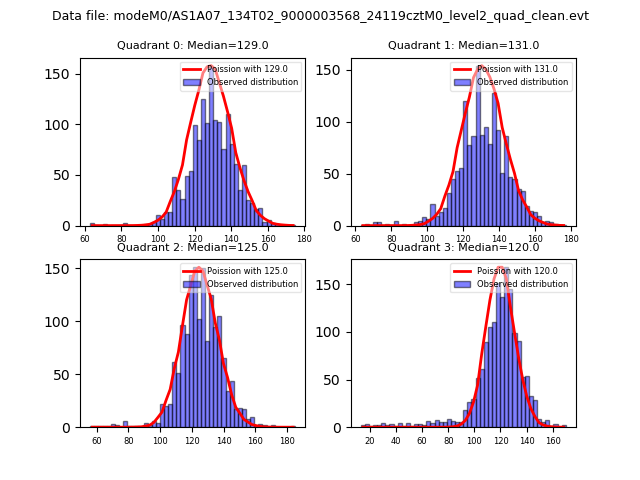
| Comparison with Poisson distribution Blue bars denote a histogram of data divided into 1 sec bins. Red curve is a Poisson curve with rate = median count rate of data. |
 |
 |
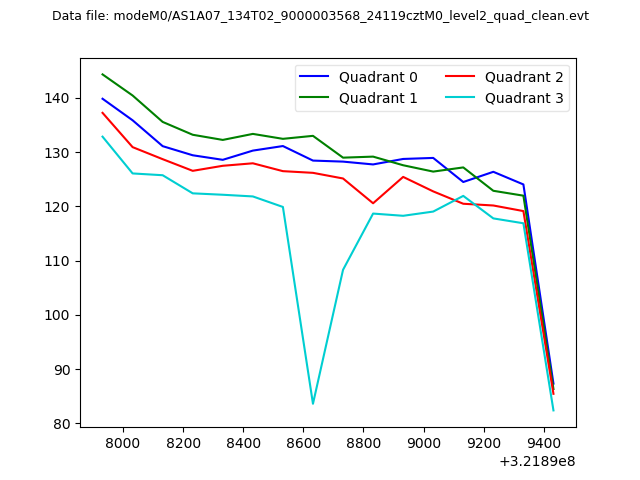
| Quadrant-wise count rates Data is divided into 100 sec bins |
 |
|
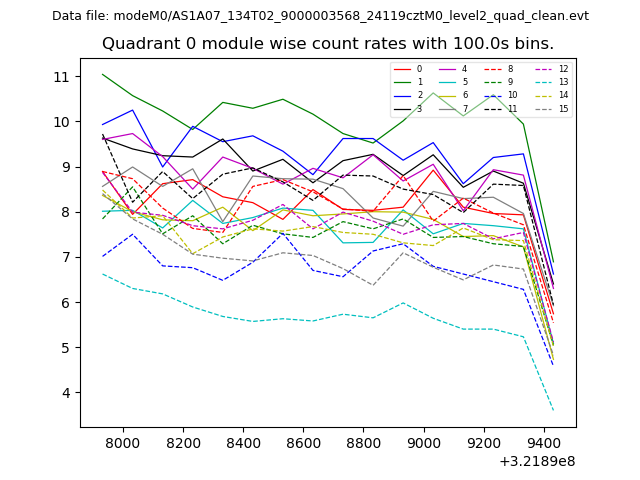
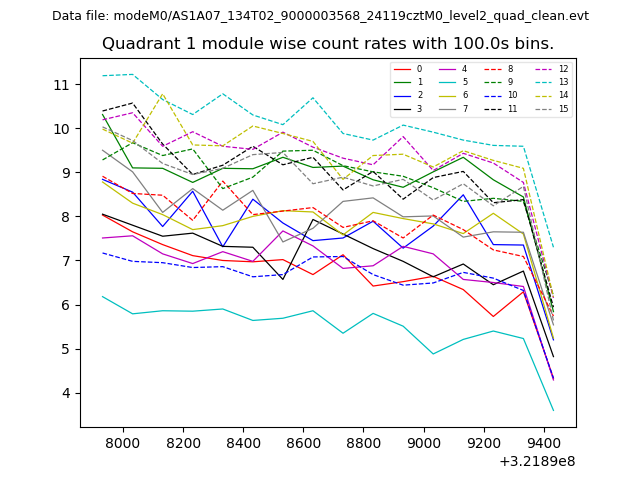
| Module-wise count rates for Quadrant A Data is divided into 100 sec bins |
 |
 |
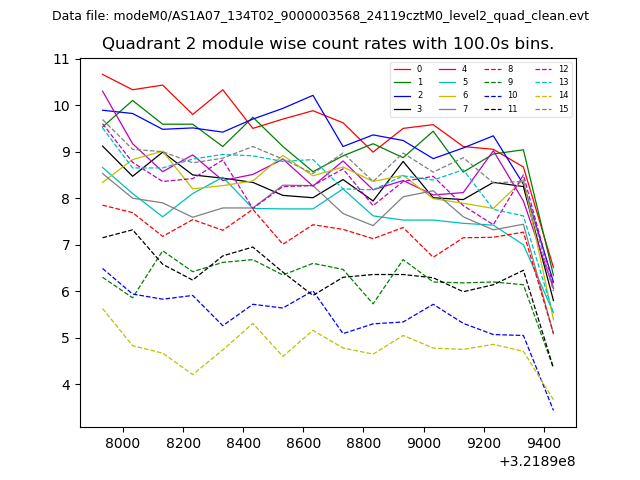
| Module-wise count rates for Quadrant B Data is divided into 100 sec bins |
 |
 |
| Module-wise count rates for Quadrant C Data is divided into 100 sec bins |
 |
 |
| Module-wise count rates for Quadrant D Data is divided into 100 sec bins |
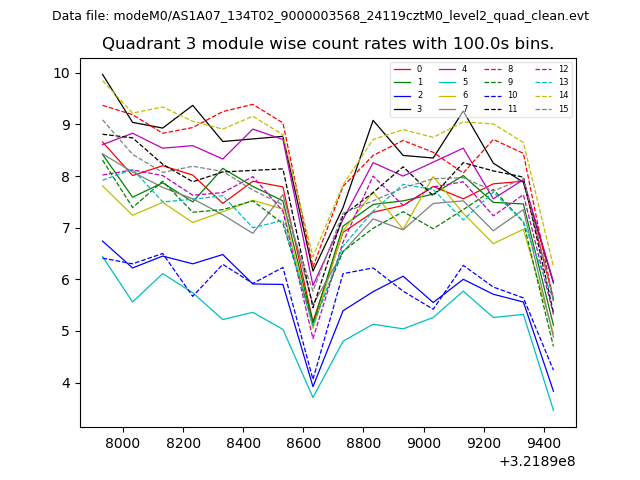 |
 |
| Parameter | Plot |
|---|---|
| CZT HV Monitor | 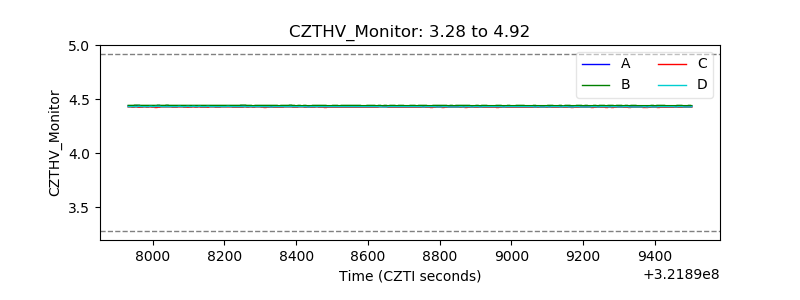 |
| D_VDD |  |
| Temperature 1 | 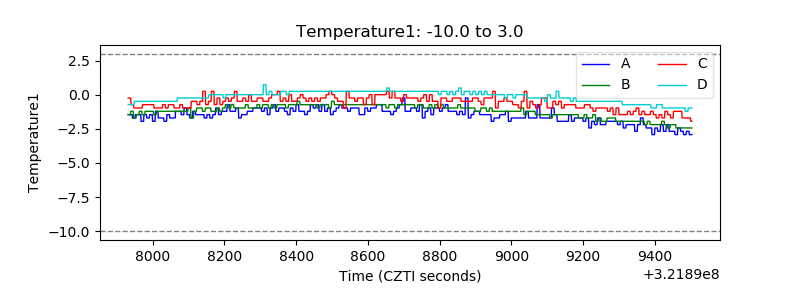 |
| Veto HV Monitor | 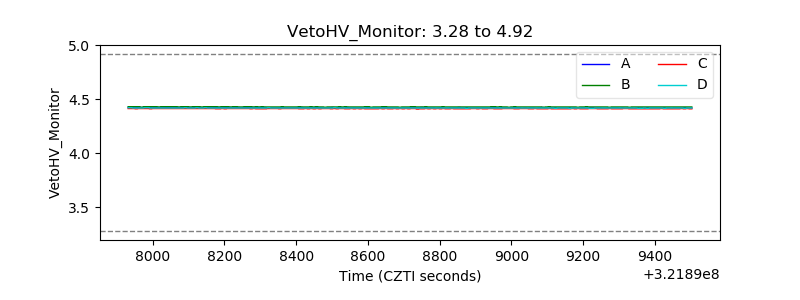 |
| Veto LLD | 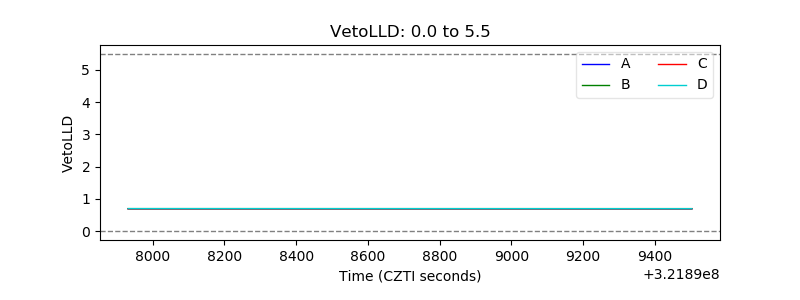 |
| Alpha Counter | 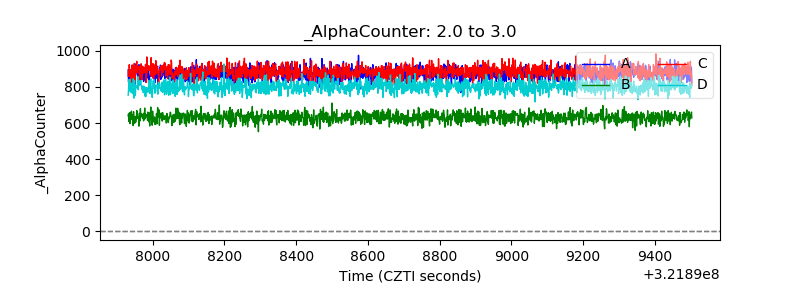 |
| _CPM_Rate | 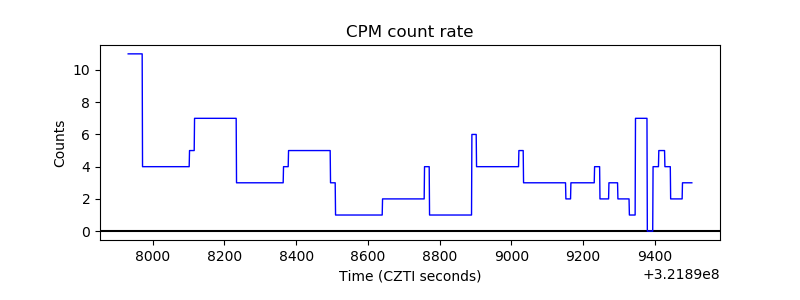 |
| CZT Counter | 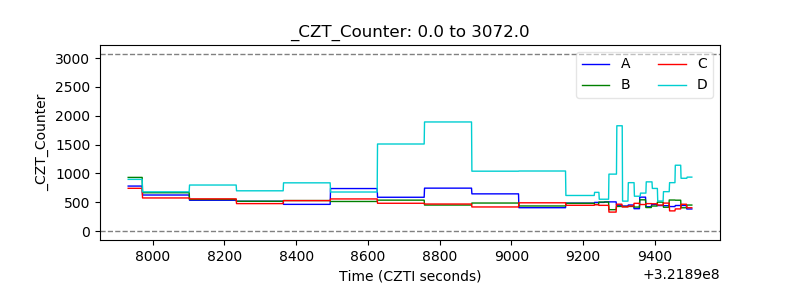 |
| +2.5 Volts monitor | 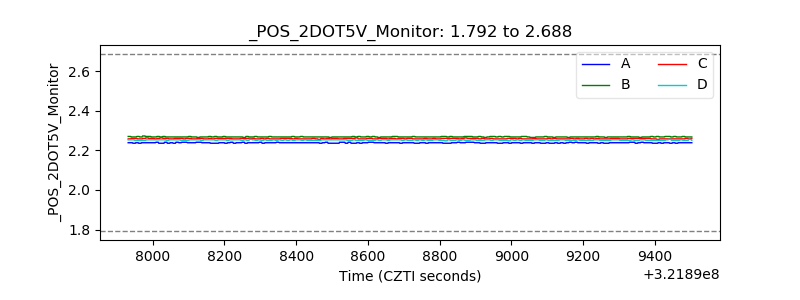 |
| +5 Volts monitor |  |
| _ROLL_ROT | 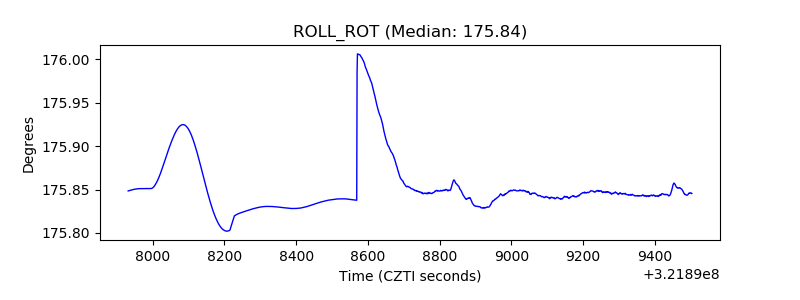 |
| _Roll_DEC | 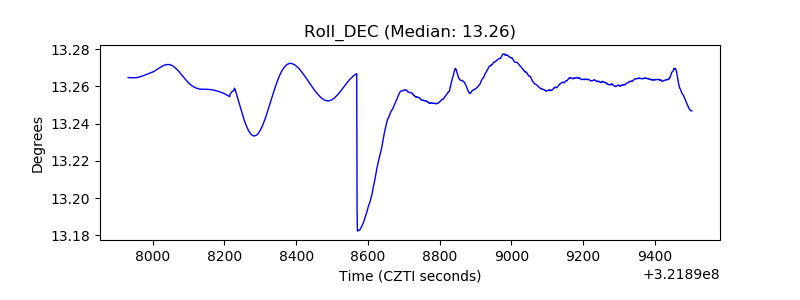 |
| _Roll_RA |  |
| Veto Counter | 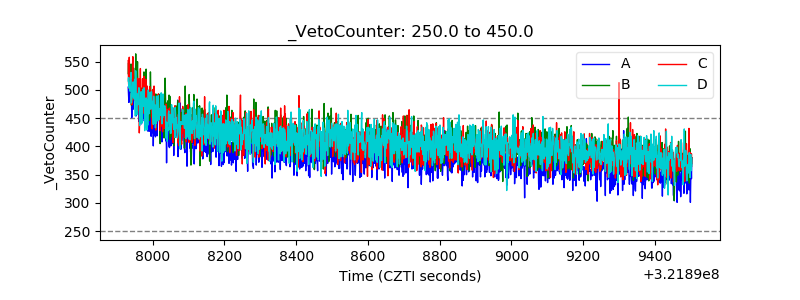 |