| Param | Original file | Final file |
|---|---|---|
| Filename | modeM0/AS1A07_134T02_9000003568_24120cztM0_level2.evt | modeM0/AS1A07_134T02_9000003568_24120cztM0_level2_quad_clean.evt |
| Size (bytes) | 557,481,600 | 96,517,440 |
| Size | 531.7 MB | 92.0 MB |
| Events in quadrant A | 3,485,815 | 621,168 |
| Events in quadrant B | 3,616,065 | 627,410 |
| Events in quadrant C | 3,614,571 | 600,564 |
| Events in quadrant D | 5,682,917 | 576,415 |
| Mode M9 | |||
|---|---|---|---|
| Quadrant | BADHDUFLAG | Total packets | Discarded packets |
| A | 0 | 2 | 0 |
| B | 0 | 2 | 0 |
| C | 0 | 2 | 0 |
| D | 0 | 2 | 0 |
| Mode SS | |||
|---|---|---|---|
| Quadrant | BADHDUFLAG | Total packets | Discarded packets |
| A | 0 | 146 | 0 |
| B | 0 | 146 | 0 |
| C | 0 | 146 | 0 |
| D | 0 | 146 | 0 |
| Mode M0 | |||
|---|---|---|---|
| Quadrant | BADHDUFLAG | Total packets | Discarded packets |
| A | 0 | 14984 | 1 |
| B | 0 | 15224 | 1 |
| C | 0 | 15320 | 1 |
| D | 0 | 21760 | 3 |
| Quadrant | Total seconds | Saturated seconds | Saturation percentage |
|---|---|---|---|
| A | 7134 | 116 | 1.626016% |
| B | 7135 | 148 | 2.074282% |
| C | 7135 | 158 | 2.214436% |
| D | 7134 | 269 | 3.770676% |
Noise dominated data is calculated using 1-second bins in cleaned event files. If a bin has >2000 counts, and if more than 50% of those come from <1% of pixels, then it is considered to be noise-dominated and hence unusable.
| Quadrant | # 1 sec bins | Bins with >0 counts | Bins with >2000 counts | High rate bins dominated by noise | Noise dominated (total time) | Noise dominated (detector-on time) | Marked lightcurve |
|---|---|---|---|---|---|---|---|
| A | 7364 | 7135 | 0 | 0 | 0.00% | 0.00% | 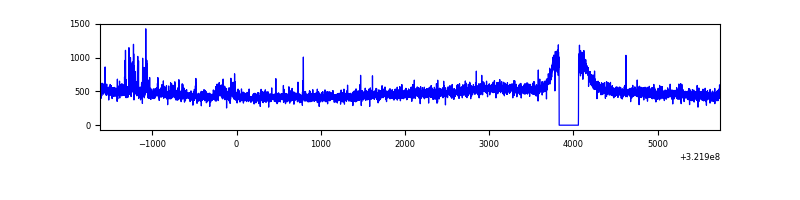 |
| B | 7365 | 7136 | 6 | 6 | 0.08% | 0.08% | 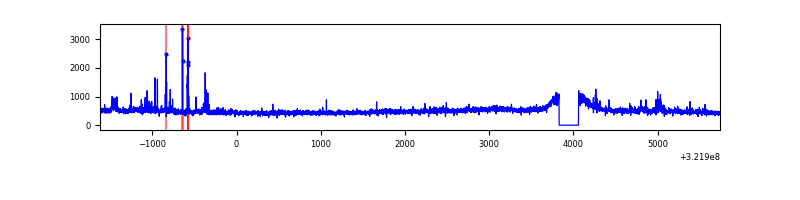 |
| C | 7365 | 7136 | 20 | 20 | 0.27% | 0.28% | 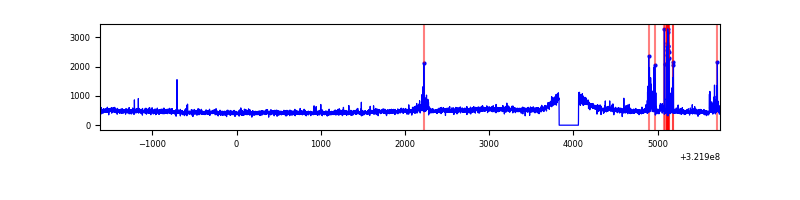 |
| D | 7364 | 7135 | 189 | 189 | 2.57% | 2.65% | 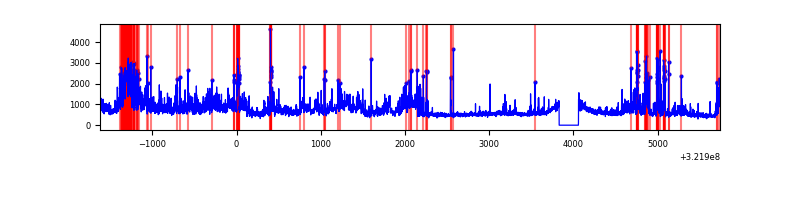 |
Top three noisy pixels from each quadrant. If the there are fewer than three noisy pixels in the level2.evt file, extra rows are filled as -1
| Pixel properties | Quadrant properties | ||||||
|---|---|---|---|---|---|---|---|
| Quadrant | DetID | PixID | Counts | Sigma | Mean | Median | Sigma |
| A | 3 | 1 | 70988 | 389.0 | 883 | 865 | 180.3 |
| A | 13 | 254 | 11297 | 57.87 | 883 | 865 | 180.3 |
| A | 2 | 250 | 8507 | 42.39 | 883 | 865 | 180.3 |
| B | 0 | 189 | 52276 | 301.54 | 876 | 853 | 170.5 |
| B | 5 | 250 | 28538 | 162.34 | 876 | 853 | 170.5 |
| B | 4 | 187 | 20879 | 117.43 | 876 | 853 | 170.5 |
| C | 14 | 238 | 129581 | 651.6 | 840 | 843 | 197.6 |
| C | 10 | 9 | 120489 | 605.58 | 840 | 843 | 197.6 |
| C | 7 | 247 | 55356 | 275.91 | 840 | 843 | 197.6 |
| D | 8 | 195 | 994863 | 4749.71 | 851 | 826 | 209.3 |
| D | 1 | 52 | 896519 | 4279.81 | 851 | 826 | 209.3 |
| D | 12 | 218 | 254884 | 1213.94 | 851 | 826 | 209.3 |
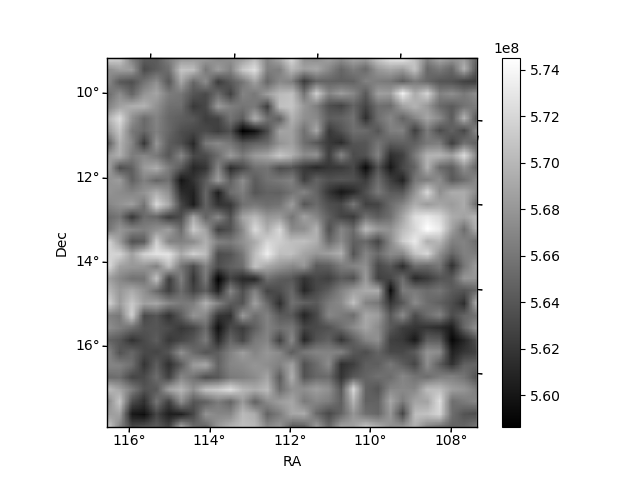
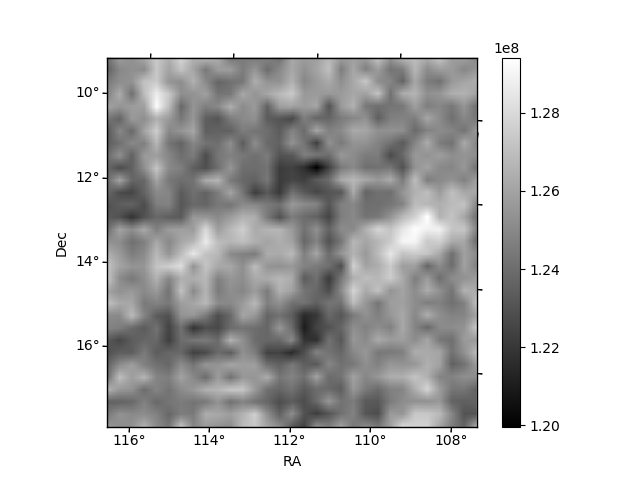
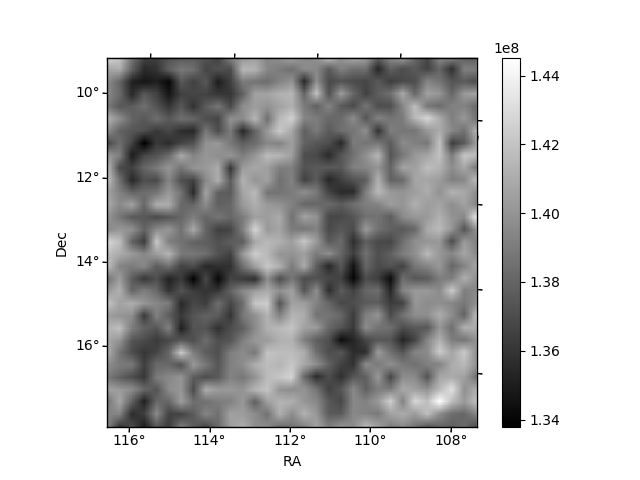
Histogram calculated using DETX and DETY for each event in the final _common_clean file
| Quadrant A | 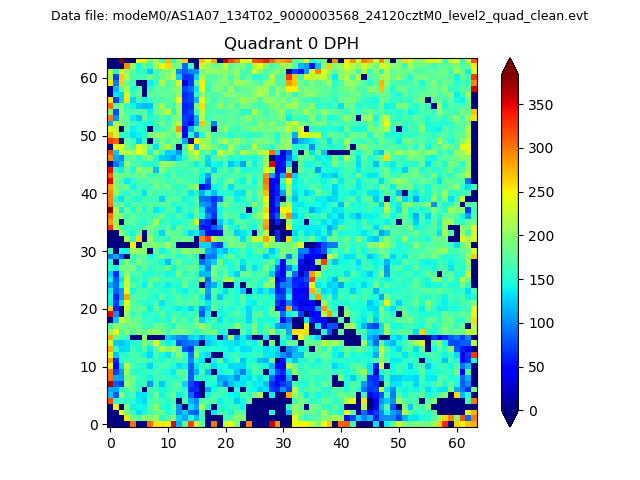 |
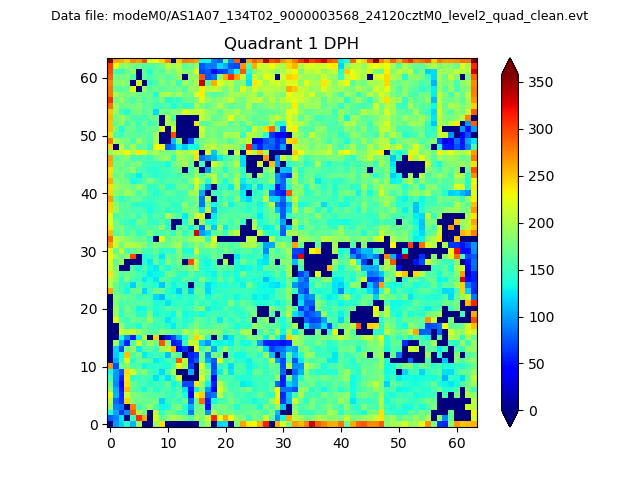 |
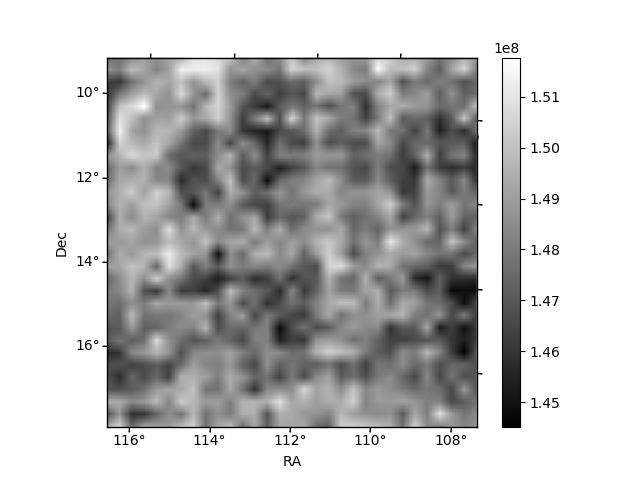
Quadrant B |
|---|---|---|---|
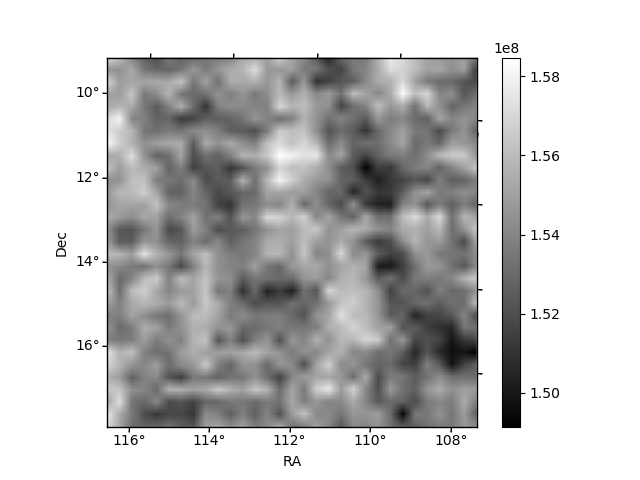
| Quadrant D | 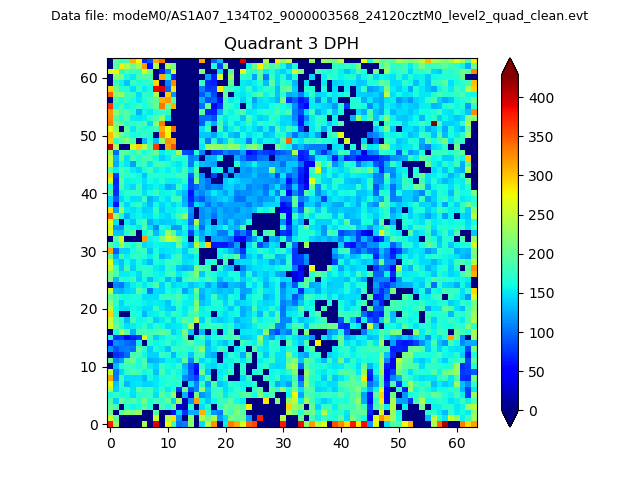 |
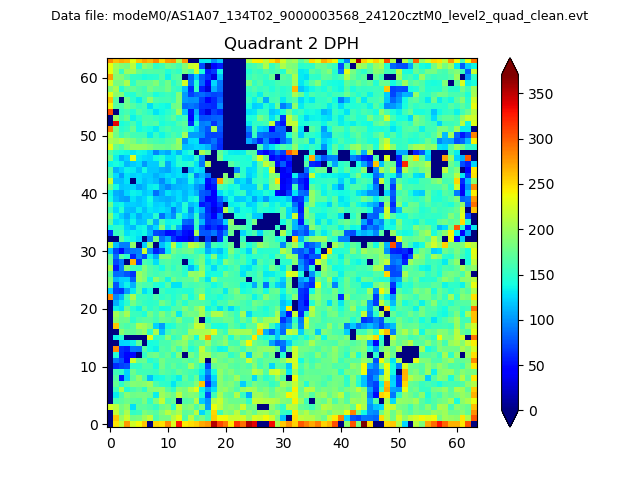 |
Quadrant C |
| Plot type | Count rate plots | Images |
|---|---|---|
| Comparison with Poisson distribution Blue bars denote a histogram of data divided into 1 sec bins. Red curve is a Poisson curve with rate = median count rate of data. |
 |
 |
| Quadrant-wise count rates Data is divided into 100 sec bins |
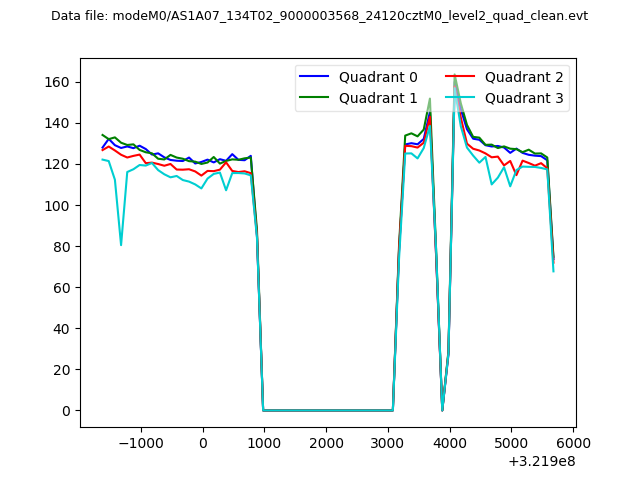 |
|
| Module-wise count rates for Quadrant A Data is divided into 100 sec bins |
 |
 |
| Module-wise count rates for Quadrant B Data is divided into 100 sec bins |
 |
 |
| Module-wise count rates for Quadrant C Data is divided into 100 sec bins |
 |
 |
| Module-wise count rates for Quadrant D Data is divided into 100 sec bins |
 |
 |
| Parameter | Plot |
|---|---|
| CZT HV Monitor |  |
| D_VDD | 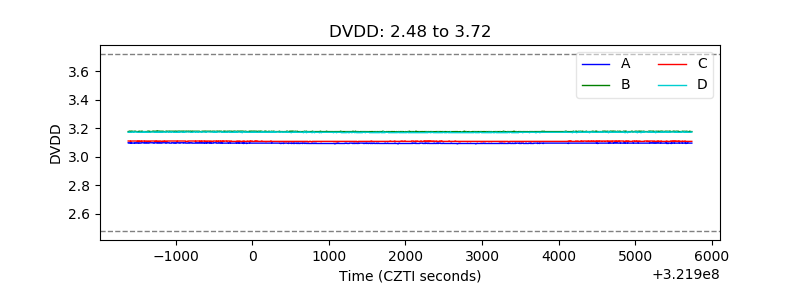 |
| Temperature 1 | 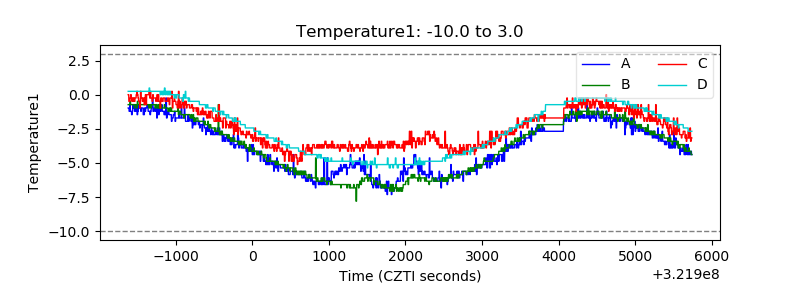 |
| Veto HV Monitor | 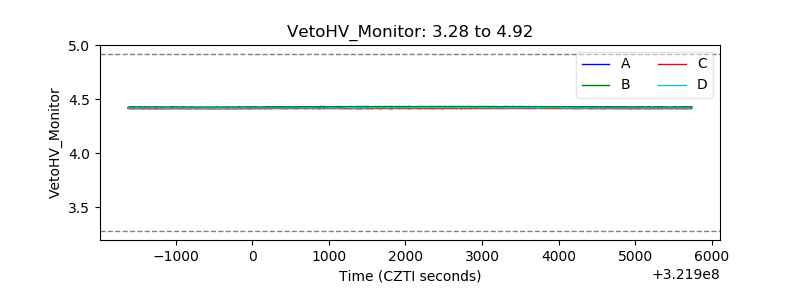 |
| Veto LLD | 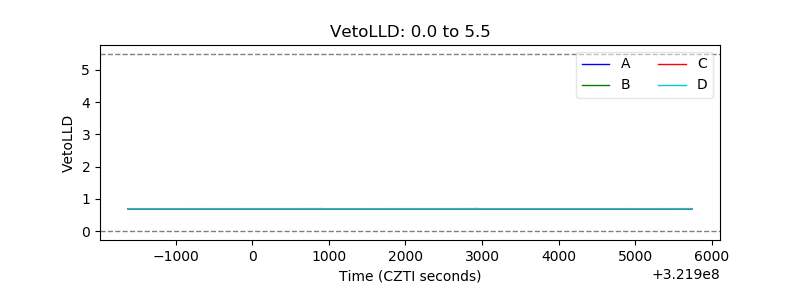 |
| Alpha Counter | 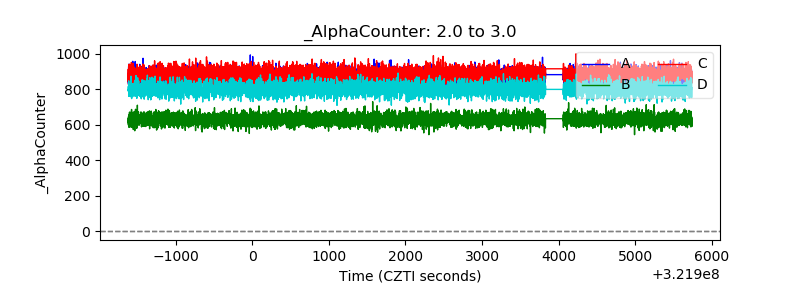 |
| _CPM_Rate | 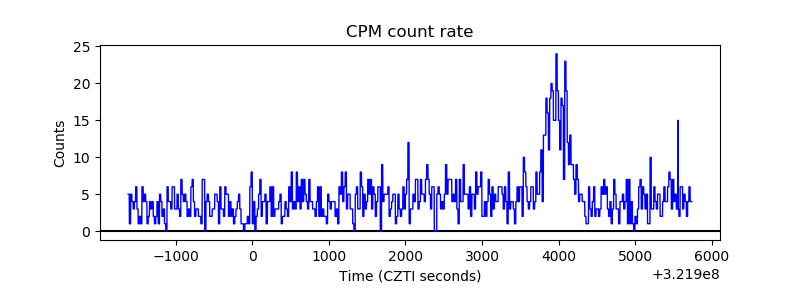 |
| CZT Counter | 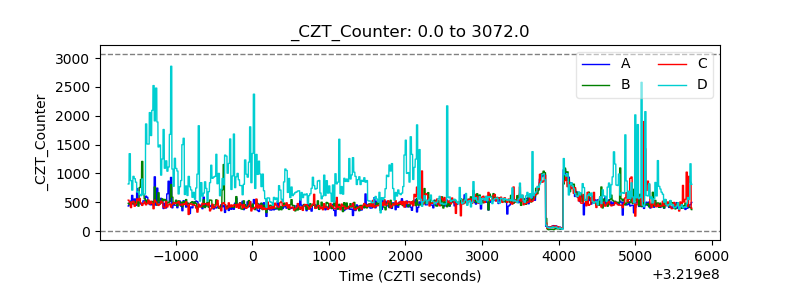 |
| +2.5 Volts monitor |  |
| +5 Volts monitor | 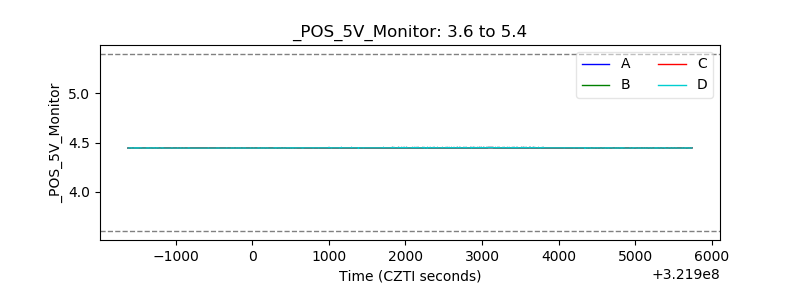 |
| _ROLL_ROT | 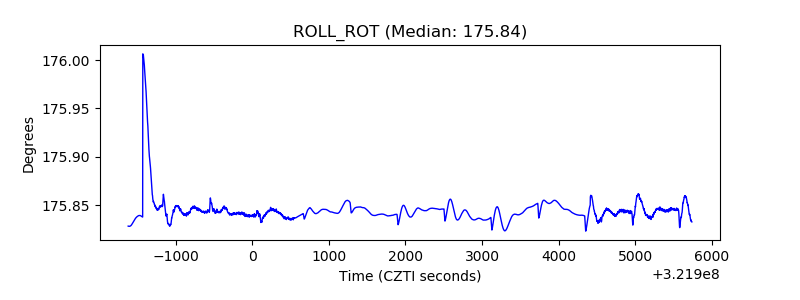 |
| _Roll_DEC | 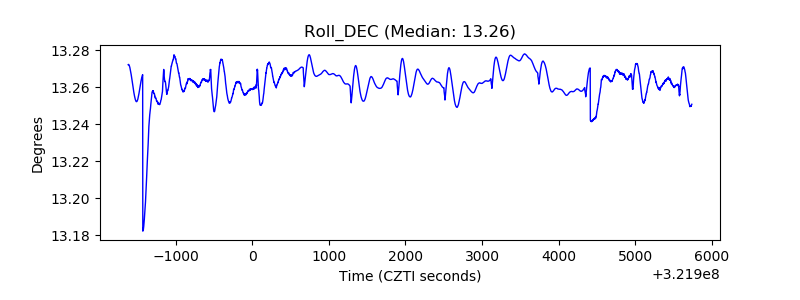 |
| _Roll_RA | 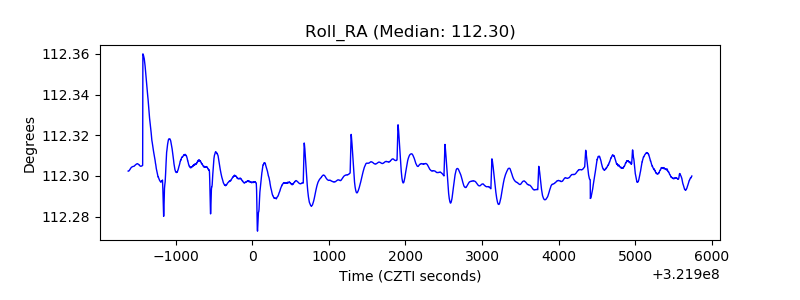 |
| Veto Counter |  |