| Param | Original file | Final file |
|---|---|---|
| Filename | modeM0/AS1A07_134T02_9000003568_24123cztM0_level2.evt | modeM0/AS1A07_134T02_9000003568_24123cztM0_level2_quad_clean.evt |
| Size (bytes) | 1,209,340,800 | 219,309,120 |
| Size | 1.1 GB | 209.1 MB |
| Events in quadrant A | 8,276,569 | 1,384,261 |
| Events in quadrant B | 8,630,232 | 1,397,188 |
| Events in quadrant C | 8,556,945 | 1,344,036 |
| Events in quadrant D | 9,977,941 | 1,310,426 |
| Mode M9 | |||
|---|---|---|---|
| Quadrant | BADHDUFLAG | Total packets | Discarded packets |
| A | 0 | 20 | 0 |
| B | 0 | 21 | 0 |
| C | 0 | 21 | 0 |
| D | 0 | 21 | 0 |
| Mode SS | |||
|---|---|---|---|
| Quadrant | BADHDUFLAG | Total packets | Discarded packets |
| A | 0 | 356 | 0 |
| B | 0 | 356 | 0 |
| C | 0 | 356 | 0 |
| D | 0 | 356 | 0 |
| Mode M0 | |||
|---|---|---|---|
| Quadrant | BADHDUFLAG | Total packets | Discarded packets |
| A | 0 | 36073 | 4 |
| B | 0 | 36871 | 4 |
| C | 0 | 36601 | 4 |
| D | 0 | 41707 | 4 |
| Quadrant | Total seconds | Saturated seconds | Saturation percentage |
|---|---|---|---|
| A | 17499 | 150 | 0.857192% |
| B | 17499 | 214 | 1.222927% |
| C | 17498 | 273 | 1.560178% |
| D | 17498 | 284 | 1.623043% |
Noise dominated data is calculated using 1-second bins in cleaned event files. If a bin has >2000 counts, and if more than 50% of those come from <1% of pixels, then it is considered to be noise-dominated and hence unusable.
| Quadrant | # 1 sec bins | Bins with >0 counts | Bins with >2000 counts | High rate bins dominated by noise | Noise dominated (total time) | Noise dominated (detector-on time) | Marked lightcurve |
|---|---|---|---|---|---|---|---|
| A | 19469 | 17501 | 0 | 0 | 0.00% | 0.00% | 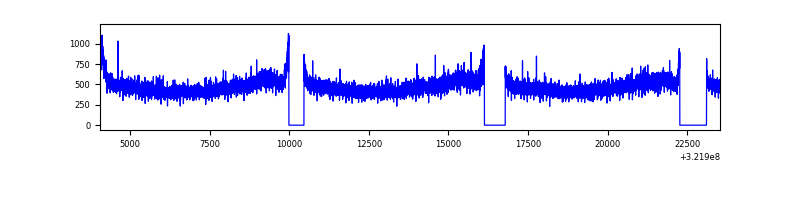 |
| B | 19469 | 17502 | 13 | 13 | 0.07% | 0.07% | 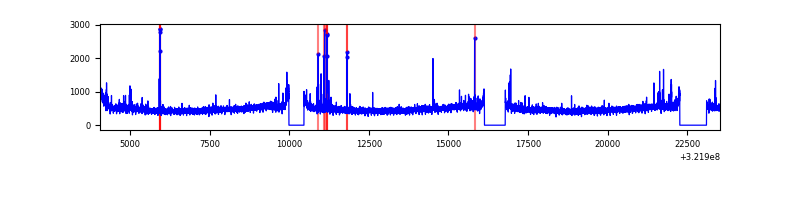 |
| C | 19468 | 17501 | 19 | 19 | 0.10% | 0.11% | 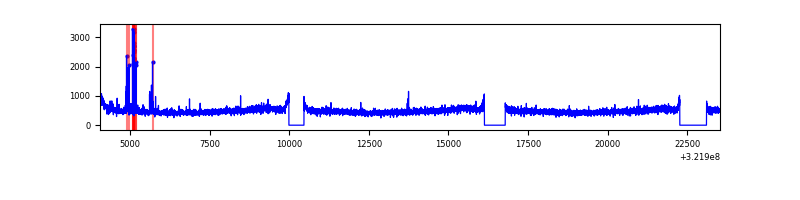 |
| D | 19468 | 17501 | 173 | 173 | 0.89% | 0.99% | 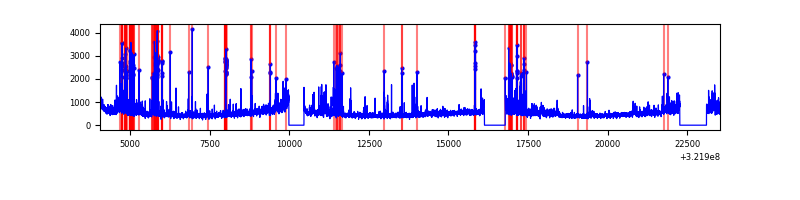 |
Top three noisy pixels from each quadrant. If the there are fewer than three noisy pixels in the level2.evt file, extra rows are filled as -1
| Pixel properties | Quadrant properties | ||||||
|---|---|---|---|---|---|---|---|
| Quadrant | DetID | PixID | Counts | Sigma | Mean | Median | Sigma |
| A | 13 | 254 | 26987 | 57.93 | 2136 | 2089 | 429.8 |
| A | 2 | 250 | 25531 | 54.54 | 2136 | 2089 | 429.8 |
| A | 3 | 1 | 24624 | 52.43 | 2136 | 2089 | 429.8 |
| B | 0 | 190 | 79236 | 190.27 | 2121 | 2065 | 405.6 |
| B | 4 | 171 | 61825 | 147.34 | 2121 | 2065 | 405.6 |
| B | 12 | 111 | 50089 | 118.41 | 2121 | 2065 | 405.6 |
| C | 14 | 238 | 321413 | 666.97 | 2041 | 2052 | 478.8 |
| C | 10 | 9 | 121820 | 250.13 | 2041 | 2052 | 478.8 |
| C | 7 | 247 | 119824 | 245.96 | 2041 | 2052 | 478.8 |
| D | 8 | 195 | 799529 | 1565.04 | 2072 | 2009 | 509.6 |
| D | 1 | 52 | 588720 | 1151.35 | 2072 | 2009 | 509.6 |
| D | 12 | 233 | 337432 | 658.23 | 2072 | 2009 | 509.6 |
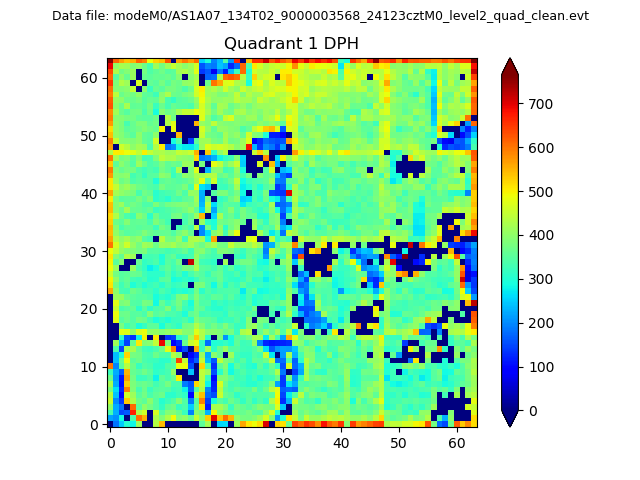
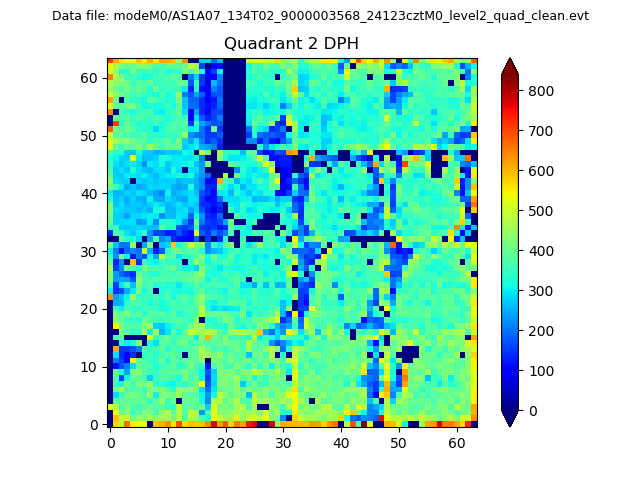
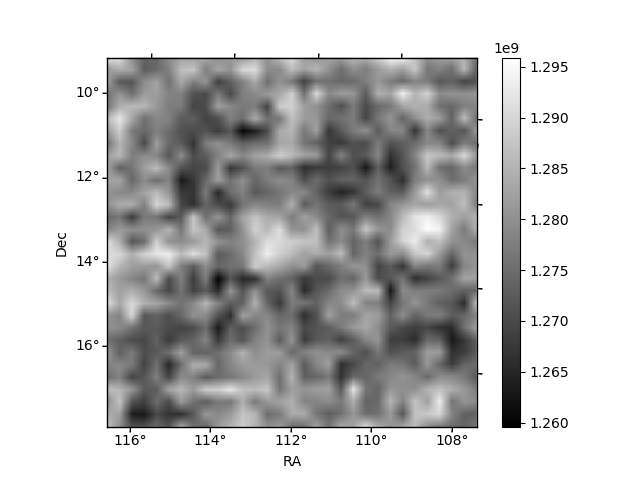
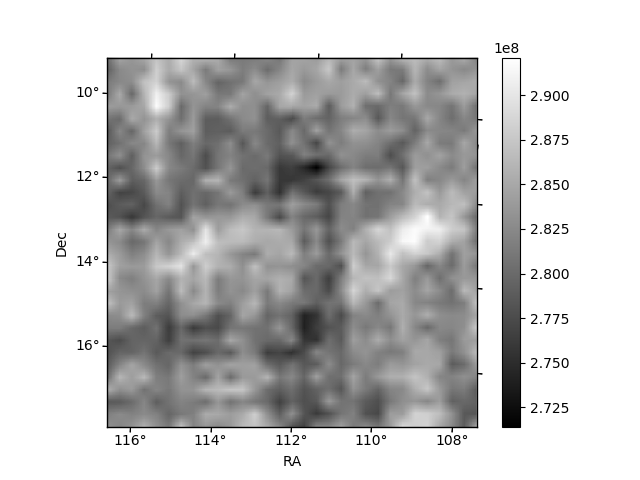
Histogram calculated using DETX and DETY for each event in the final _common_clean file
| Quadrant A |  |
 |
Quadrant B |
|---|---|---|---|
| Quadrant D | 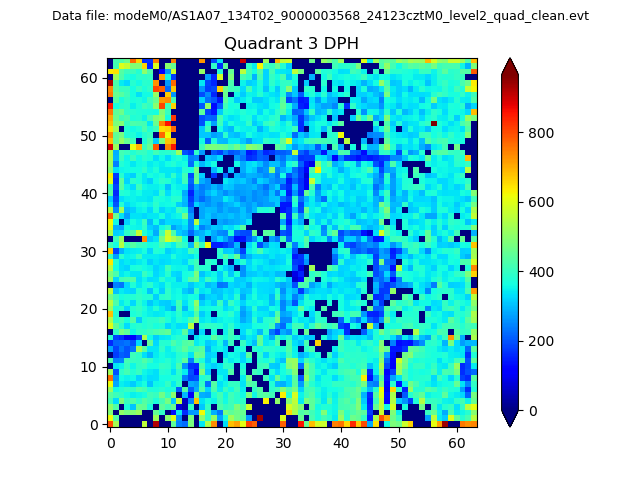 |
 |
Quadrant C |
| Plot type | Count rate plots | Images |
|---|---|---|
| Comparison with Poisson distribution Blue bars denote a histogram of data divided into 1 sec bins. Red curve is a Poisson curve with rate = median count rate of data. |
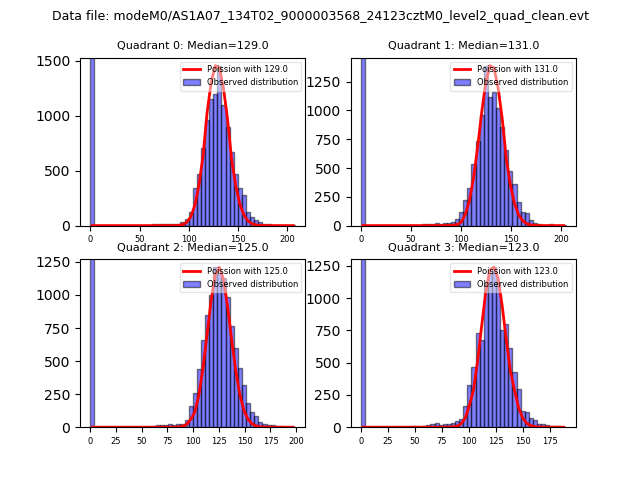 |
 |
| Quadrant-wise count rates Data is divided into 100 sec bins |
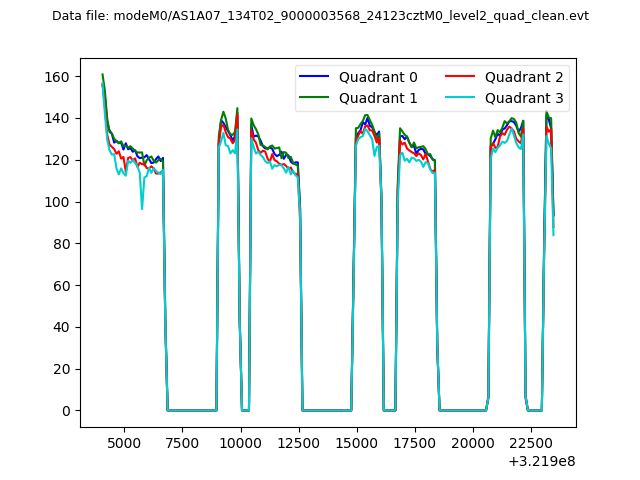 |
|
| Module-wise count rates for Quadrant A Data is divided into 100 sec bins |
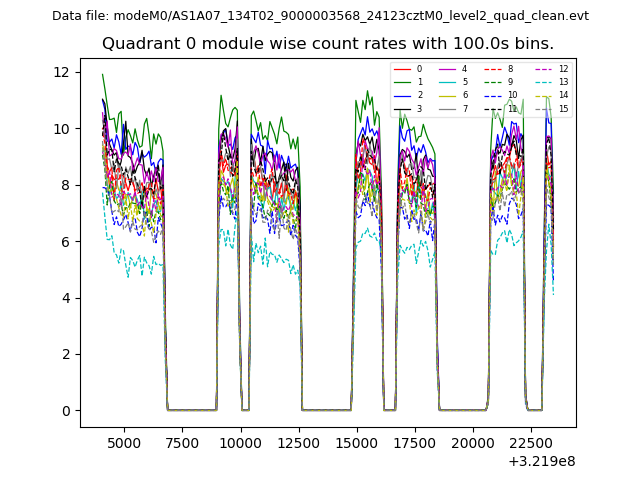 |
 |
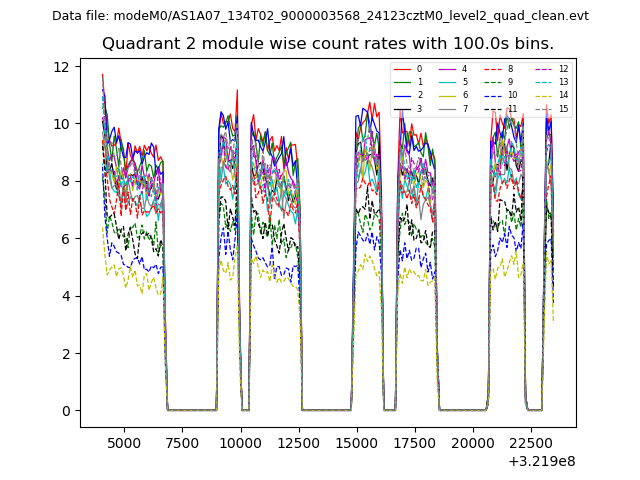
| Module-wise count rates for Quadrant B Data is divided into 100 sec bins |
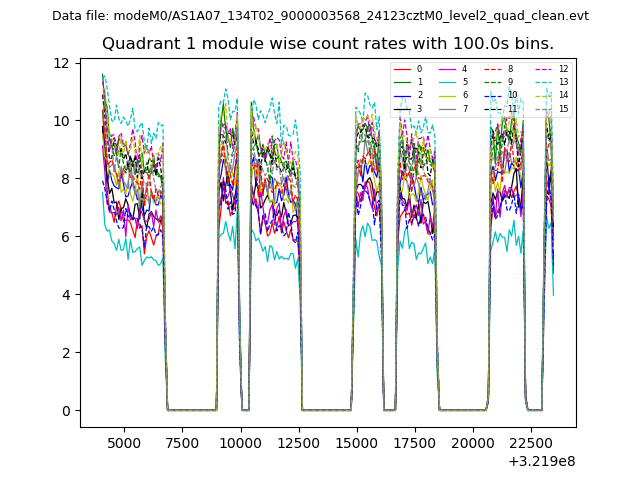 |
 |
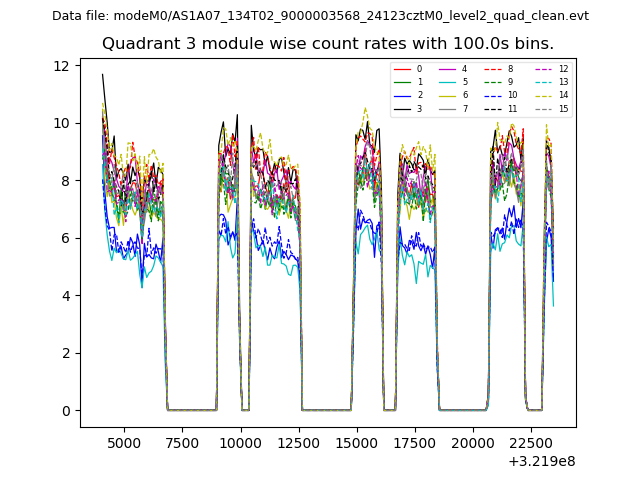
| Module-wise count rates for Quadrant C Data is divided into 100 sec bins |
 |
 |
| Module-wise count rates for Quadrant D Data is divided into 100 sec bins |
 |
 |
| Parameter | Plot |
|---|---|
| CZT HV Monitor | 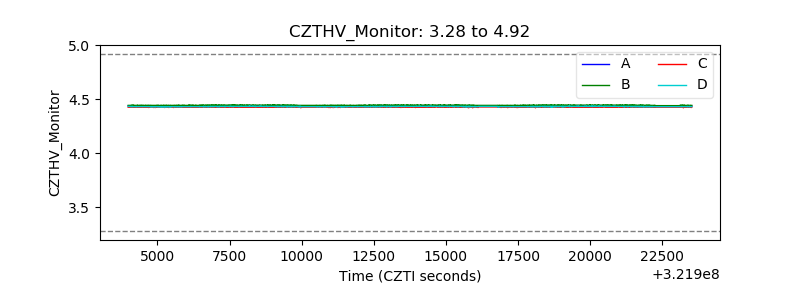 |
| D_VDD | 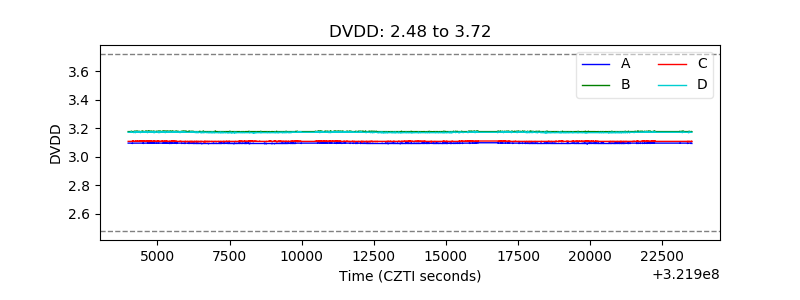 |
| Temperature 1 | 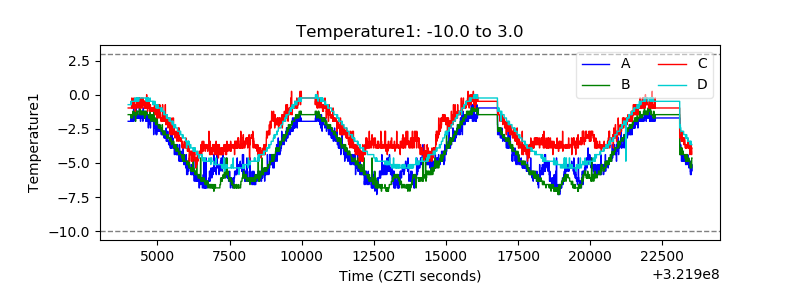 |
| Veto HV Monitor | 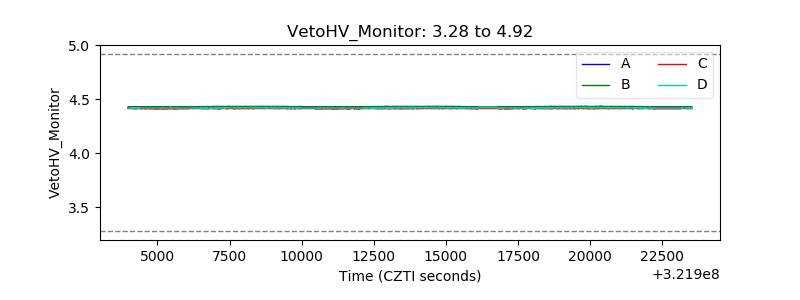 |
| Veto LLD | 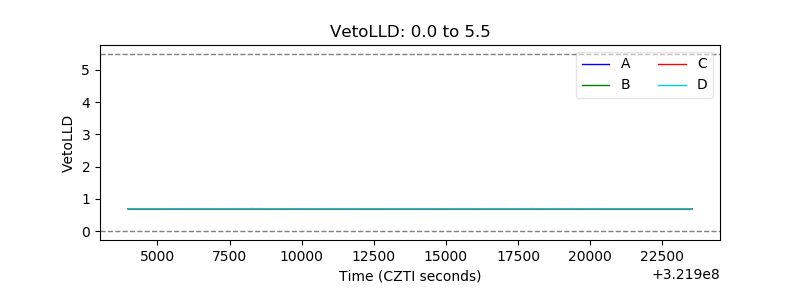 |
| Alpha Counter | 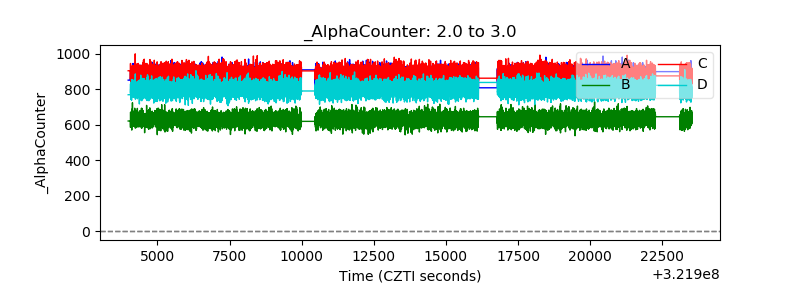 |
| _CPM_Rate | 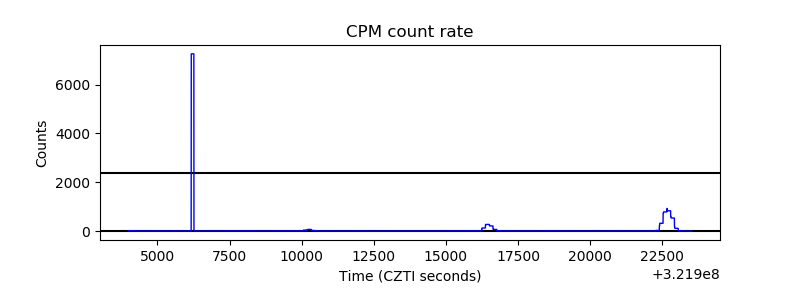 |
| CZT Counter |  |
| +2.5 Volts monitor |  |
| +5 Volts monitor |  |
| _ROLL_ROT | 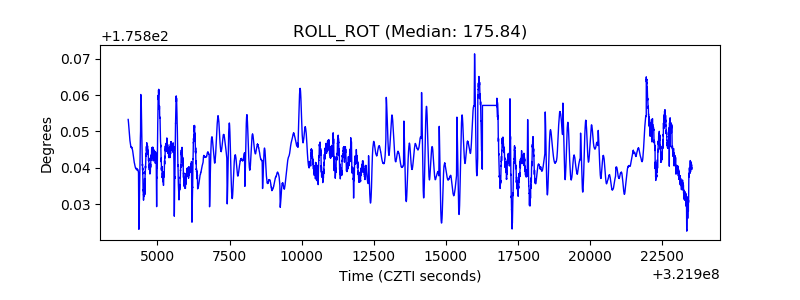 |
| _Roll_DEC |  |
| _Roll_RA |  |
| Veto Counter | 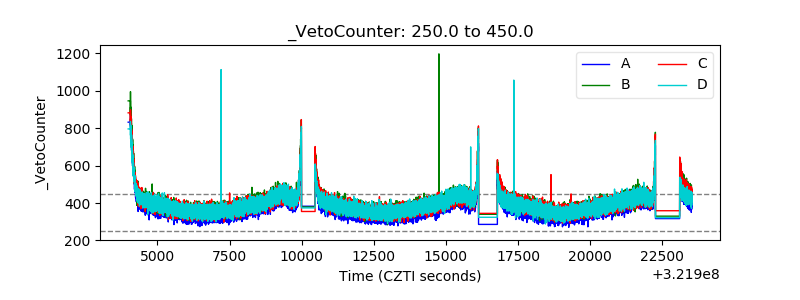 |