| Param | Original file | Final file |
|---|---|---|
| Filename | modeM0/AS1A07_134T02_9000003568_24124cztM0_level2.evt | modeM0/AS1A07_134T02_9000003568_24124cztM0_level2_quad_clean.evt |
| Size (bytes) | 68,348,160 | 17,962,560 |
| Size | 65.2 MB | 17.1 MB |
| Events in quadrant A | 424,506 | 120,391 |
| Events in quadrant B | 448,481 | 123,099 |
| Events in quadrant C | 437,529 | 117,087 |
| Events in quadrant D | 693,931 | 111,707 |
| Mode SS | |||
|---|---|---|---|
| Quadrant | BADHDUFLAG | Total packets | Discarded packets |
| A | 0 | 18 | 0 |
| B | 0 | 18 | 0 |
| C | 0 | 18 | 0 |
| D | 0 | 18 | 0 |
| Mode M0 | |||
|---|---|---|---|
| Quadrant | BADHDUFLAG | Total packets | Discarded packets |
| A | 0 | 1831 | 0 |
| B | 0 | 1860 | 0 |
| C | 0 | 1836 | 0 |
| D | 0 | 2746 | 0 |
| Quadrant | Total seconds | Saturated seconds | Saturation percentage |
|---|---|---|---|
| A | 914 | 0 | 0.000000% |
| B | 915 | 0 | 0.000000% |
| C | 915 | 1 | 0.109290% |
| D | 915 | 2 | 0.218579% |
Noise dominated data is calculated using 1-second bins in cleaned event files. If a bin has >2000 counts, and if more than 50% of those come from <1% of pixels, then it is considered to be noise-dominated and hence unusable.
| Quadrant | # 1 sec bins | Bins with >0 counts | Bins with >2000 counts | High rate bins dominated by noise | Noise dominated (total time) | Noise dominated (detector-on time) | Marked lightcurve |
|---|---|---|---|---|---|---|---|
| A | 914 | 914 | 0 | 0 | 0.00% | 0.00% | 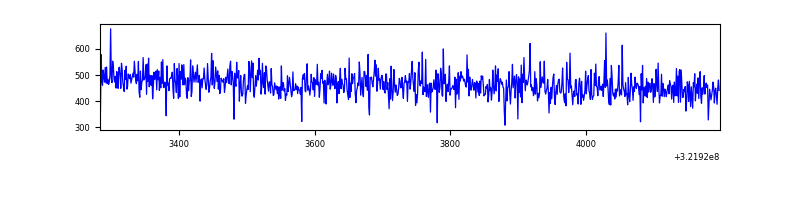 |
| B | 915 | 915 | 0 | 0 | 0.00% | 0.00% | 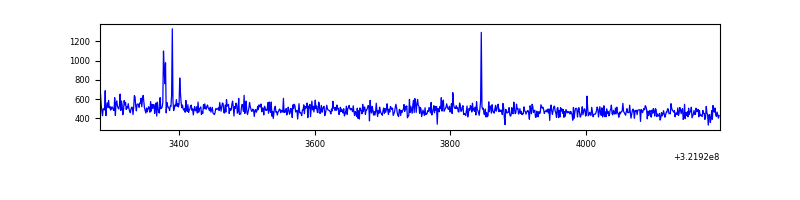 |
| C | 915 | 915 | 0 | 0 | 0.00% | 0.00% | 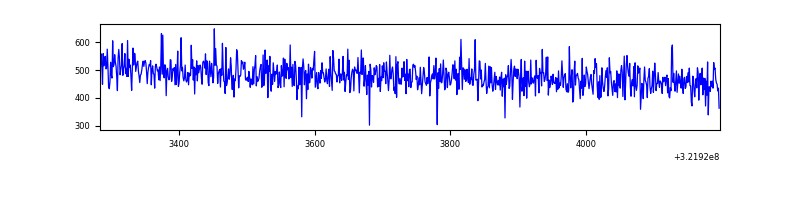 |
| D | 915 | 915 | 0 | 0 | 0.00% | 0.00% | 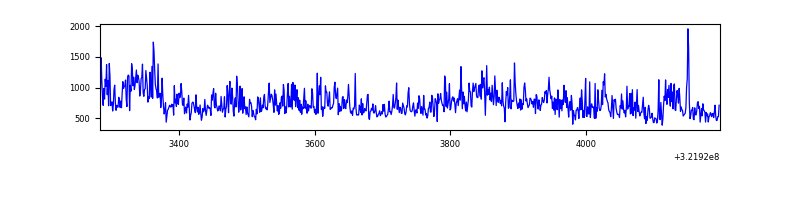 |
Top three noisy pixels from each quadrant. If the there are fewer than three noisy pixels in the level2.evt file, extra rows are filled as -1
| Pixel properties | Quadrant properties | ||||||
|---|---|---|---|---|---|---|---|
| Quadrant | DetID | PixID | Counts | Sigma | Mean | Median | Sigma |
| A | 13 | 254 | 1534 | 59.66 | 110 | 108 | 23.9 |
| A | 0 | 226 | 947 | 35.1 | 110 | 108 | 23.9 |
| A | 3 | 137 | 909 | 33.51 | 110 | 108 | 23.9 |
| B | 4 | 52 | 3920 | 161.52 | 111 | 109 | 23.6 |
| B | 4 | 171 | 3062 | 125.16 | 111 | 109 | 23.6 |
| B | 4 | 187 | 3048 | 124.56 | 111 | 109 | 23.6 |
| C | 14 | 238 | 17185 | 625.48 | 107 | 108 | 27.3 |
| C | 7 | 247 | 2056 | 71.35 | 107 | 108 | 27.3 |
| C | 13 | 61 | 744 | 23.29 | 107 | 108 | 27.3 |
| D | 8 | 195 | 279066 | 9903.73 | 107 | 104 | 28.2 |
| D | 2 | 234 | 4056 | 140.3 | 107 | 104 | 28.2 |
| D | 13 | 138 | 3234 | 111.12 | 107 | 104 | 28.2 |
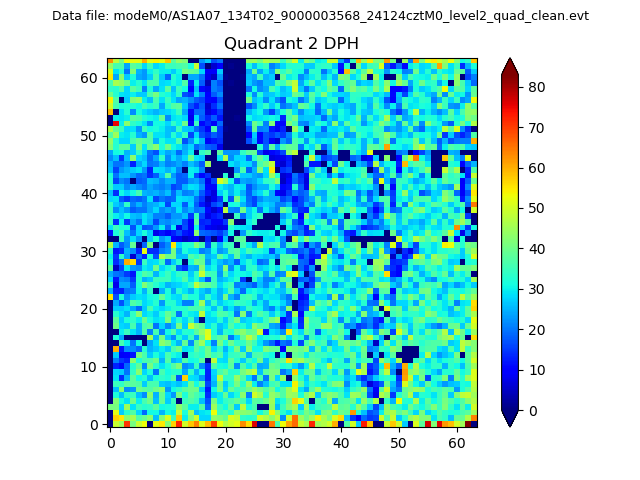
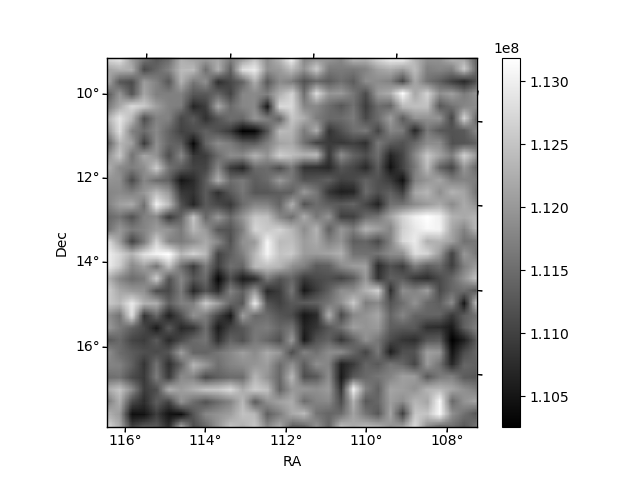
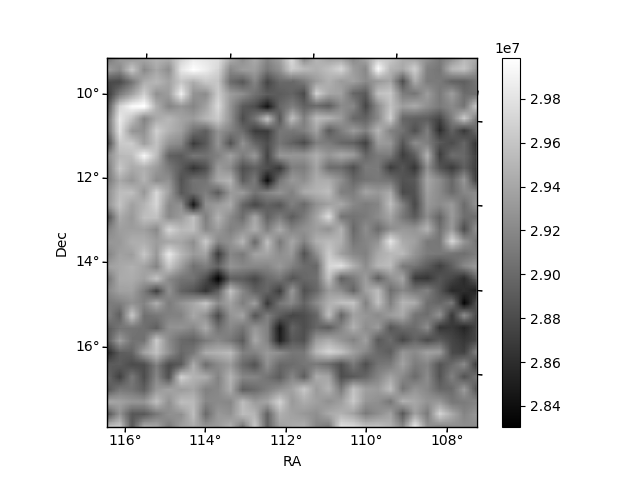
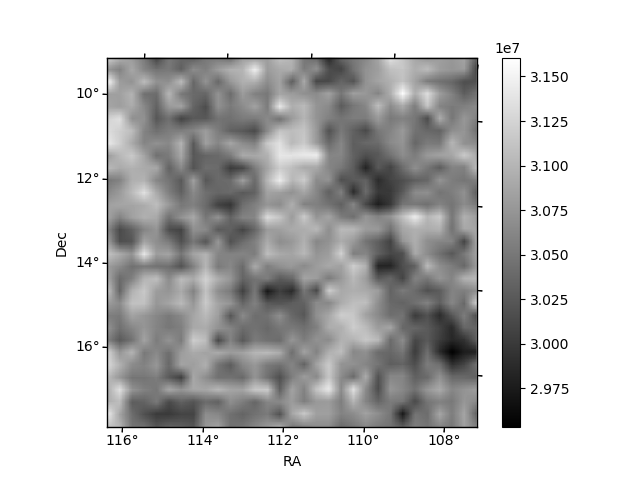
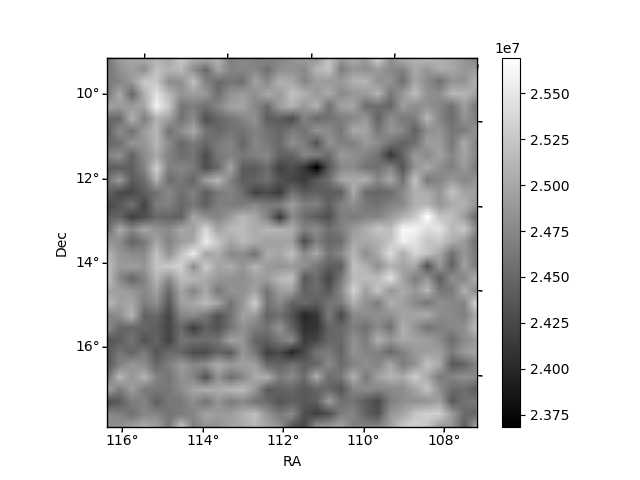
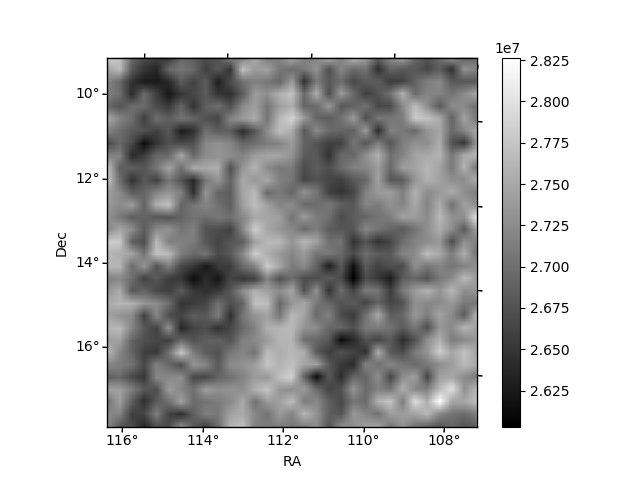
Histogram calculated using DETX and DETY for each event in the final _common_clean file
| Quadrant A | 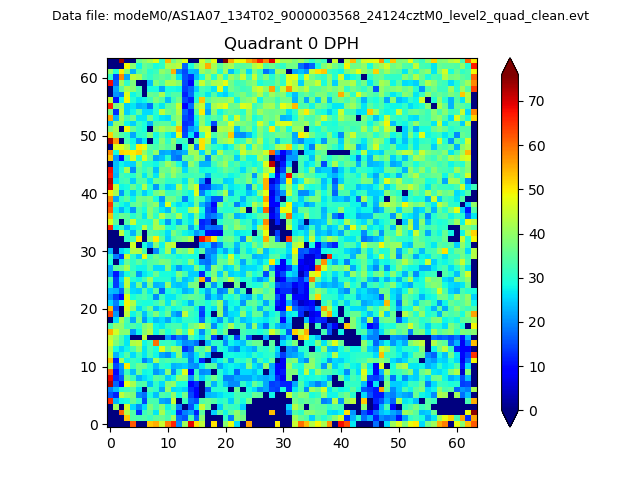 |
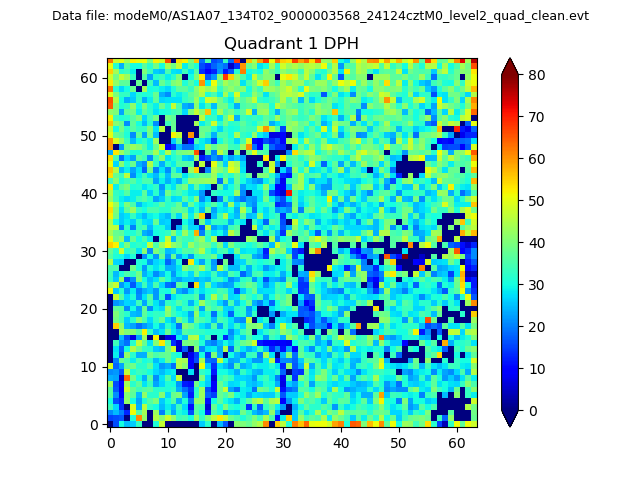 |
Quadrant B |
|---|---|---|---|
| Quadrant D | 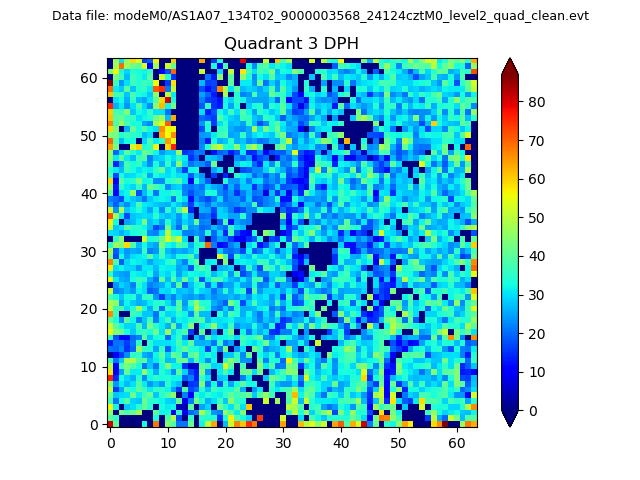 |
 |
Quadrant C |
| Plot type | Count rate plots | Images |
|---|---|---|
| Comparison with Poisson distribution Blue bars denote a histogram of data divided into 1 sec bins. Red curve is a Poisson curve with rate = median count rate of data. |
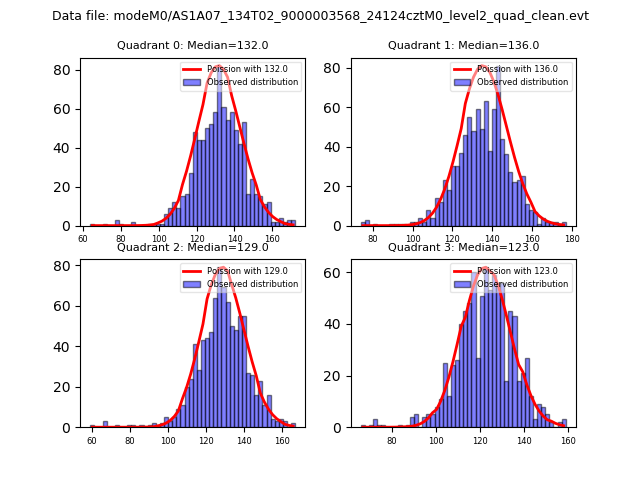 |
 |
| Quadrant-wise count rates Data is divided into 100 sec bins |
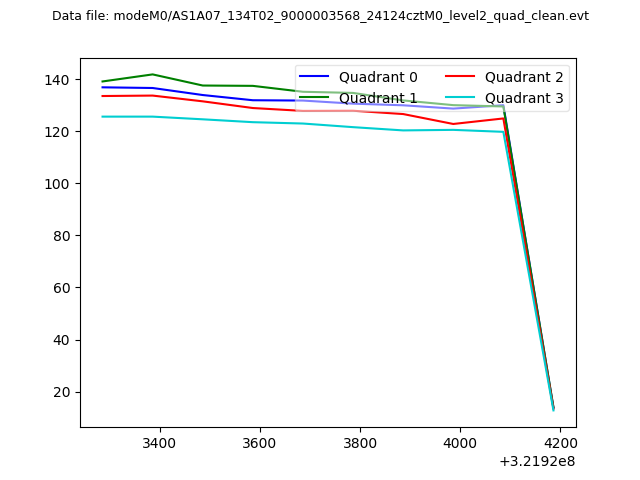 |
|
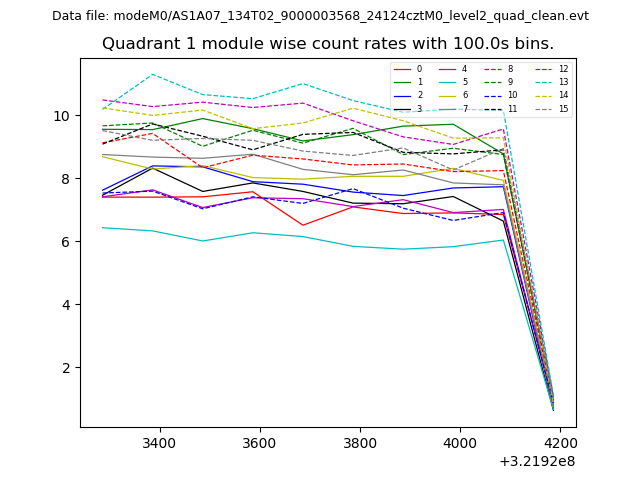
| Module-wise count rates for Quadrant A Data is divided into 100 sec bins |
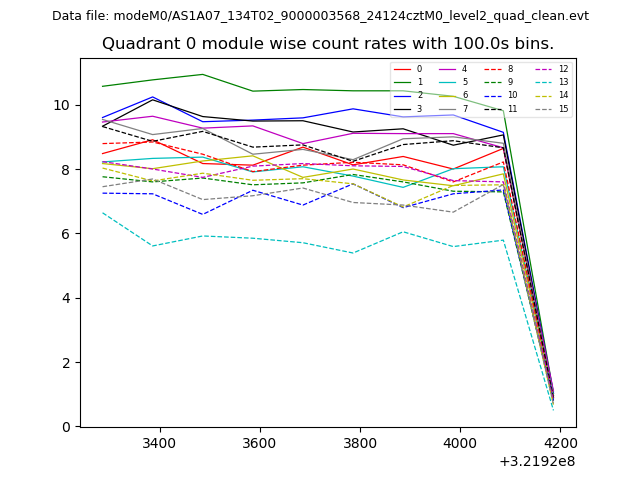 |
 |
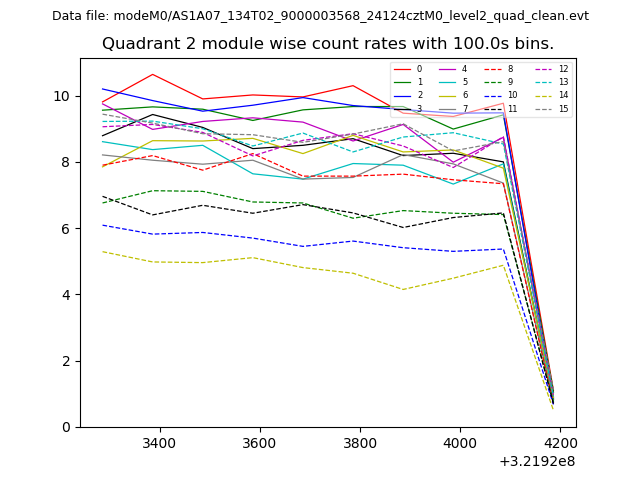
| Module-wise count rates for Quadrant B Data is divided into 100 sec bins |
 |
 |
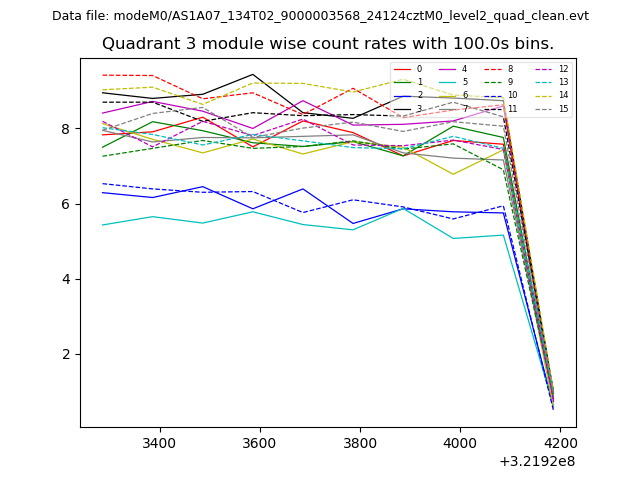
| Module-wise count rates for Quadrant C Data is divided into 100 sec bins |
 |
 |
| Module-wise count rates for Quadrant D Data is divided into 100 sec bins |
 |
 |
| Parameter | Plot |
|---|---|
| CZT HV Monitor |  |
| D_VDD | 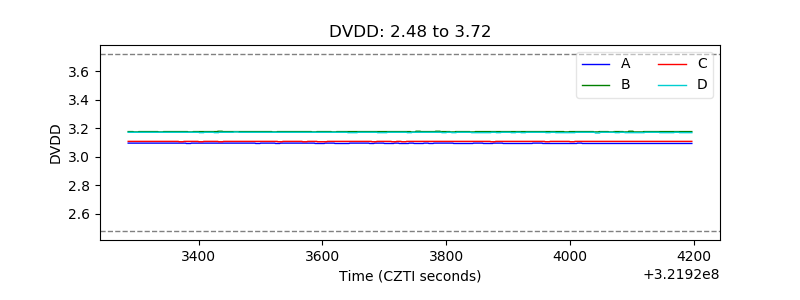 |
| Temperature 1 |  |
| Veto HV Monitor | 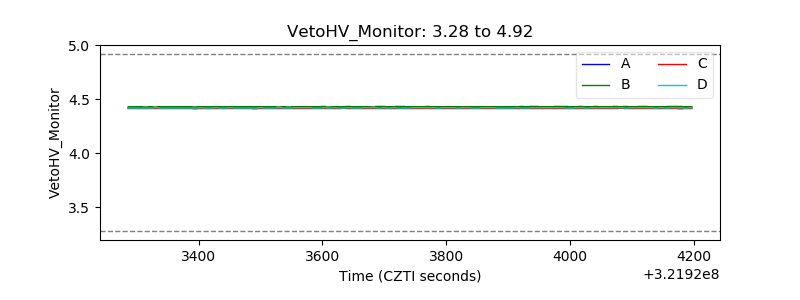 |
| Veto LLD |  |
| Alpha Counter | 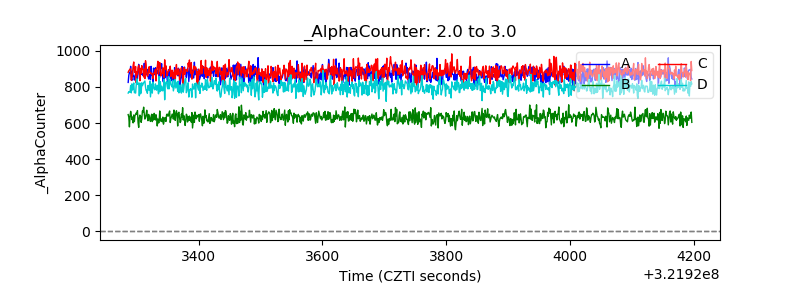 |
| _CPM_Rate | 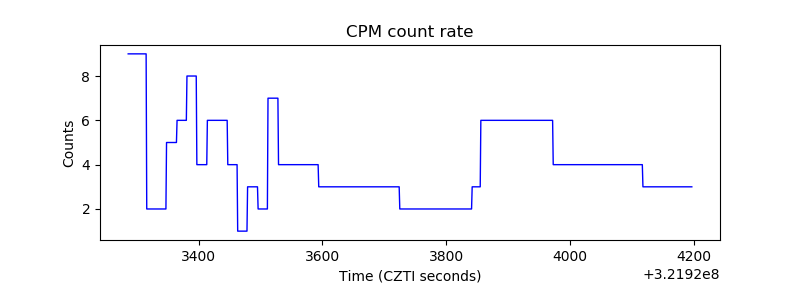 |
| CZT Counter | 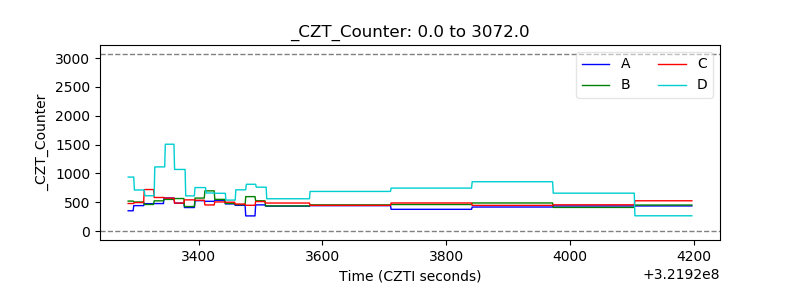 |
| +2.5 Volts monitor |  |
| +5 Volts monitor |  |
| _ROLL_ROT | 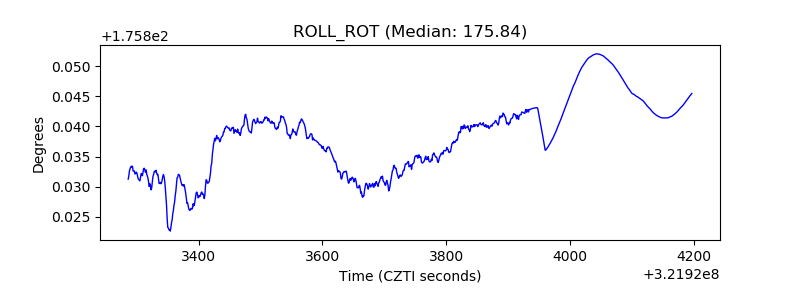 |
| _Roll_DEC | 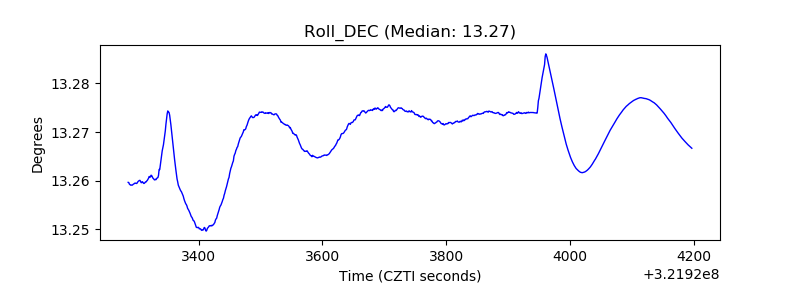 |
| _Roll_RA | 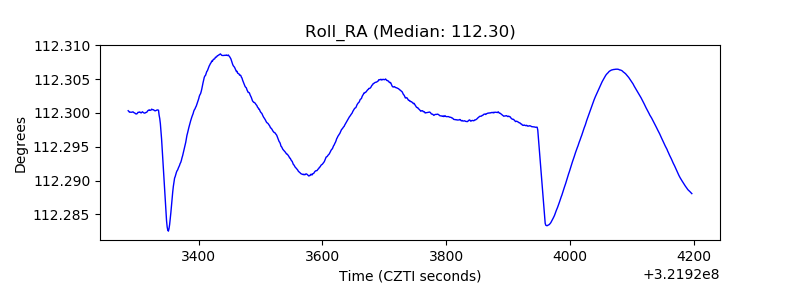 |
| Veto Counter | 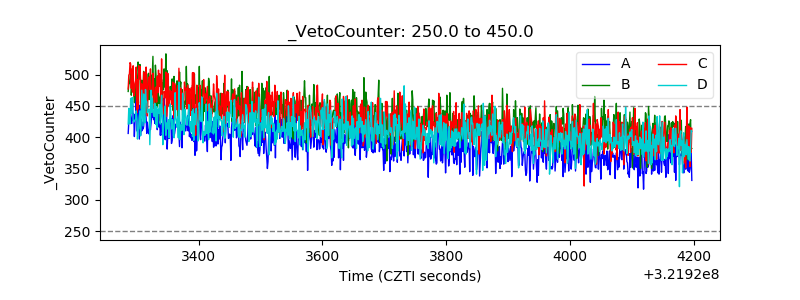 |