| Param | Original file | Final file |
|---|---|---|
| Filename | modeM0/AS1C05_002T09_9000003566cztM0_level2.fits | modeM0/AS1C05_002T09_9000003566cztM0_level2_quad_clean.evt |
| Size (bytes) | 70,634,880 | 66,931,200 |
| Size | 67.4 MB | 63.8 MB |
| Events in quadrant A | 432,712 | 401,299 |
| Events in quadrant B | 414,076 | 398,467 |
| Events in quadrant C | 417,332 | 381,422 |
| Events in quadrant D | 357,506 | 327,440 |
| Mode M9 | |||
|---|---|---|---|
| Quadrant | BADHDUFLAG | Total packets | Discarded packets |
| A | 0 | 5 | 0 |
| B | 0 | 5 | 0 |
| C | 0 | 5 | 0 |
| D | 0 | 5 | 0 |
| Mode M0 | |||
|---|---|---|---|
| Quadrant | BADHDUFLAG | Total packets | Discarded packets |
| A | 0 | 15196 | 0 |
| B | 0 | 15276 | 0 |
| C | 0 | 15164 | 0 |
| D | 0 | 22321 | 0 |
| Mode SS | |||
|---|---|---|---|
| Quadrant | BADHDUFLAG | Total packets | Discarded packets |
| A | 0 | 152 | 0 |
| B | 0 | 152 | 0 |
| C | 0 | 152 | 0 |
| D | 0 | 152 | 0 |
| Quadrant | Total seconds | Saturated seconds | Saturation percentage |
|---|---|---|---|
| A | 7433 | 82 | 1.103188% |
| B | 7433 | 105 | 1.412619% |
| C | 7433 | 132 | 1.775864% |
| D | 7433 | 619 | 8.327728% |
Noise dominated data is calculated using 1-second bins in cleaned event files. If a bin has >2000 counts, and if more than 50% of those come from <1% of pixels, then it is considered to be noise-dominated and hence unusable.
| Quadrant | # 1 sec bins | Bins with >0 counts | Bins with >2000 counts | High rate bins dominated by noise | Noise dominated (total time) | Noise dominated (detector-on time) | Marked lightcurve |
|---|---|---|---|---|---|---|---|
| A | 7993 | 7433 | 0 | 0 | 0.00% | 0.00% |  |
| B | 7993 | 7432 | 0 | 0 | 0.00% | 0.00% |  |
| C | 7993 | 7432 | 0 | 0 | 0.00% | 0.00% |  |
| D | 7993 | 7432 | 0 | 0 | 0.00% | 0.00% |  |
Top three noisy pixels from each quadrant. If the there are fewer than three noisy pixels in the level2.evt file, extra rows are filled as -1
| Pixel properties | Quadrant properties | ||||||
|---|---|---|---|---|---|---|---|
| Quadrant | DetID | PixID | Counts | Sigma | Mean | Median | Sigma |
| A | 0 | 29 | 423 | 10.6 | 112 | 105 | 30.0 |
| A | 9 | 19 | 344 | 7.96 | 112 | 105 | 30.0 |
| A | 7 | 110 | 344 | 7.96 | 112 | 105 | 30.0 |
| B | 2 | 9 | 313 | 8.6 | 109 | 104 | 24.3 |
| B | 3 | 80 | 294 | 7.82 | 109 | 104 | 24.3 |
| B | 5 | 255 | 275 | 7.04 | 109 | 104 | 24.3 |
| C | 3 | 202 | 329 | 7.51 | 110 | 103 | 30.1 |
| C | 9 | 209 | 309 | 6.84 | 110 | 103 | 30.1 |
| C | 9 | 242 | 302 | 6.61 | 110 | 103 | 30.1 |
| D | 3 | 14 | 270 | 6.16 | 101 | 92 | 28.9 |
| D | 6 | 38 | 266 | 6.02 | 101 | 92 | 28.9 |
| D | 10 | 113 | 265 | 5.98 | 101 | 92 | 28.9 |
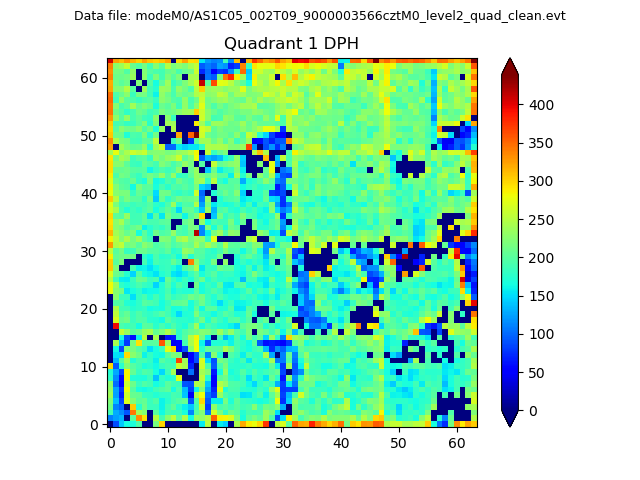
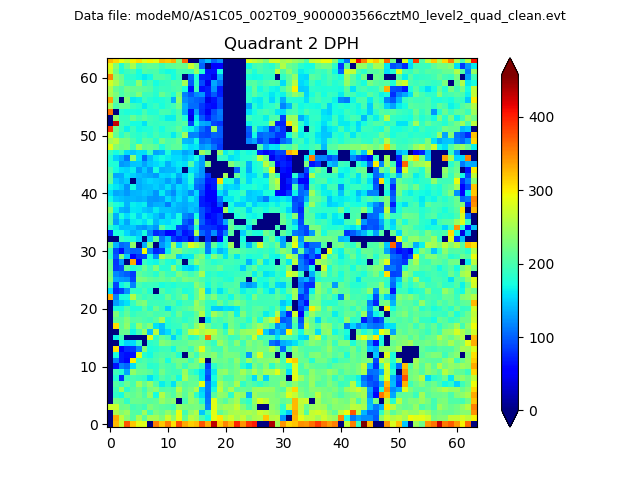
Histogram calculated using DETX and DETY for each event in the final _common_clean file
| Quadrant A |  |
 |
Quadrant B |
|---|---|---|---|
| Quadrant D |  |
 |
Quadrant C |
| Plot type | Count rate plots | Images |
|---|---|---|
| Comparison with Poisson distribution Blue bars denote a histogram of data divided into 1 sec bins. Red curve is a Poisson curve with rate = median count rate of data. |
 |
 |
| Quadrant-wise count rates Data is divided into 100 sec bins |
 |
|
| Module-wise count rates for Quadrant A Data is divided into 100 sec bins |
 |
 |
| Module-wise count rates for Quadrant B Data is divided into 100 sec bins |
 |
 |
| Module-wise count rates for Quadrant C Data is divided into 100 sec bins |
 |
 |
| Module-wise count rates for Quadrant D Data is divided into 100 sec bins |
 |
 |
| Parameter | Plot |
|---|---|
| CZT HV Monitor |  |
| D_VDD |  |
| Temperature 1 |  |
| Veto HV Monitor |  |
| Veto LLD |  |
| Alpha Counter |  |
| _CPM_Rate |  |
| CZT Counter |  |
| +2.5 Volts monitor |  |
| +5 Volts monitor |  |
| _ROLL_ROT |  |
| _Roll_DEC |  |
| _Roll_RA |  |
| Veto Counter |  |